Fluorinated Ethylene Propylene is a copolymer of hexafluoropropylene (HFP) and tetrafluoroethylene (TFE) and is a melt-processable fluoropolymer. Being very similar in composition to PTFE (polytetrafluoroethylene), Fluorinated Ethylene Propylene is bestowed with the beneficial properties of low friction and non-reactivity that are hallmarks of PTFE. The only exception is that Fluorinated Ethylene Propylene is softer than PTFE and has a lower melting point of 260 degree C, in addition to being highly transparent and resistant to sunlight.
Global demand for fluoropolymers has been witnessing considerable growth and as major worldwide economies are on the path to recovery, the need for specialty, melt-processable grades such as Fluorinated Ethylene Propylene has also been growing rapidly. This polymer is finding extensive use in areas such as wire and cable, photovoltaic (PV), aerospace and automotive markets.
The report reviews, analyses and projects the Fluorinated Ethylene Propylene market for the period 2012-2022 globally and the regional markets including North America, Europe, Asia-Pacific and Rest of World. The regional markets further analyzed for 12 independent countries across North America – The United States, Canada and Mexico; Europe – France, Germany, Italy, Russia and the United Kingdom; and Asia-Pacific – China, Japan, India and South Korea.
Global Fluorinated Ethylene Propylene (FEP) Market
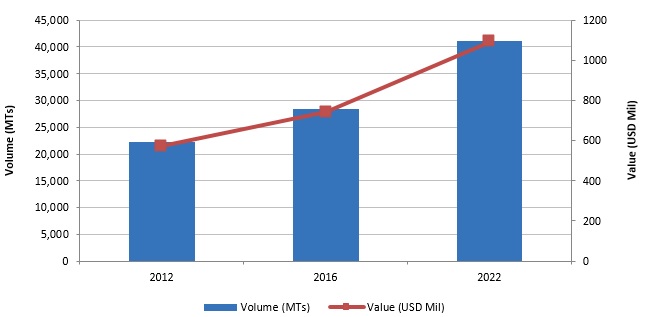
Global volume consumption of Fluorinated Ethylene Propylene, standing at 22.2 thousand metric tons in 2012, is forecast to be 28.4 thousand metric tons in 2016 and is projected to reach 41.1 thousand metric tons by 2022 at a CAGR of 6.4% between 2016 and 2022. Over the same period, value demand for FEP is likely to register a faster CAGR of 6.7% and reach a projected US$1.1 billion by 2022 from a forecast US$740.2 million in 2016.
The global Fluorinated Ethylene Propylene market report analyzes the key end-use sectors comprising Chemical Processing, Electricals & Electronics, Mechanical/Industrial, Automotive & Transportation and Other Sectors including such as Medical etc. The global markets for the above mentioned end-use sectors are analyzed in terms of volume in metric tons and value in USD.
This 194 page global Fluorinated Ethylene Propylene market report includes 146 charts (includes a data table and graphical representation for each chart), supported with meaningful and easy to understand graphical presentation, of market numbers. This report profiles 6 key global players and 14 major players across North America – 3; Europe – 3; and Asia-Pacific – 8. The research also provides the listing of the companies engaged in manufacturing, processing and compounding of Fluorinated Ethylene Propylene. The global list of companies covers the address, contact numbers and the website addresses of 92 companies.
PART A: GLOBAL MARKET PERSPECTIVE
1. INTRODUCTION
1.1 Product Outline
1.1.1 Fluorinated Ethylene Propylene (FEP)
1.1.1.1 A Brief Introduction to Fluoropolymers
1.1.2 Structure and Properties of FEP
1.1.3 Manufacturing Process of Fluorinated Ethylene Propylene (FEP)
1.1.3.1 Synthesis of Tetrafluoroethylene (TFE)
1.1.3.2 Synthesis of Hexafluoropropylene (HFP)
1.1.3.3 Production of Fluorinated Ethylene Propylene (FEP)
1.1.4 FEP Product Forms and Applications
1.1.4.1 FEP Pellets/Granules
1.1.4.2 FEP Dispersions & Coating Powders
1.1.4.3 FEP Film
1.2 Key Market Trends & Growth Drivers
2. END-USE SECTOR ANALYSIS
2.1 Chemical Processing Sector
2.2 Electricals & Electronics Sector
2.3 Mechanical/Industrial Sector
2.4 Automotive & Transportation Sector
2.5 Other Sectors
3. INDUSTRY LANDSCAPE
3.1 Fluorinated Ethylene Propylene (FEP) Production Capacities
3.2 Key Global Players
3M Company (United States)
Daikin Industries Ltd (Japan)
Dongyue Group Limited (China)
Shanghai 3F New Material Co Ltd (China)
The Chemours Company (United States)
Zhejiang Juhua Co Ltd (China)
4. KEY BUSINESS & PRODUCT TRENDS
IICT Develops FEP Polymer for ISRO's Cryogenic Engine
The Chemours Company Spun Off from DuPont
LabPure® FEP Bags Introduced by Saint-Gobain
DuPont™ Fluoropolymer Solutions Expands Melt-Processible Fluoroplastic Resin Capacity
New FEP Fluoroplastic Resin Launched by DuPont Chemicals & Fluoroproducts
Shandong Dongyue Polymer Material Co Ltd Acquires Shandong HuaxiaShenzhou New material Co Ltd
Daikin America Expands FEP and ETFE Fluoropolymers Capacity
5. GLOBAL MARKET OVERVIEW
5.1 Global Fluorinated Ethylene Propylene (FEP) Market Overview by End-use Sector
5.1.1 Global Fluorinated Ethylene Propylene (FEP) End-use Sector Market Overview by Global Region
5.1.1.1 Chemical Processing Sector
5.1.1.2 Electricals & Electronics Sector
5.1.1.3 Mechanical/Industrial Sector
5.1.1.4 Automotive & Transportation Sector
5.1.1.5 Other Sectors
PART B: REGIONAL MARKET PERSPECTIVE
Global Fluorinated Ethylene Propylene (FEP) Market Overview by Geographic Region
REGIONAL MARKET OVERVIEW
1. NORTH AMERICA
1.1 North American Fluorinated Ethylene Propylene (FEP) Market Overview by Geographic Region
1.2 North American Fluorinated Ethylene Propylene (FEP) Market Overview by End-use Sector
1.3 Major Market Players
3M Company (United States)
Daikin America, Inc. (United States)
The Chemours Company (United States)
1.4 North American Fluorinated Ethylene Propylene (FEP) Market Overview by Country
1.4.1 The United States
1.4.1.1 Market Overview by End-use Sector
1.4.2 Canada
1.4.2.1 Market Overview by End-use Sector
1.4.3 Mexico
1.4.3.1 Market Overview by End-use Sector
2. EUROPE
2.1 European Fluorinated Ethylene Propylene (FEP) Market Overview by Geographic Region
2.2 European Fluorinated Ethylene Propylene (FEP) Market Overview by End-use Sector
2.3 Major Market Players
Chemours Netherlands B.V. (Netherlands)
Dyneon GmbH & Co. KG (Germany)
HaloPolymer OJSC (Russia)
2.4 European Fluorinated Ethylene Propylene (FEP) Market Overview by Country
2.4.1 France
2.4.1.1 Market Overview by End-use Sector
2.4.2 Germany
2.4.2.1 Market Overview by End-use Sector
2.4.3 Italy
2.4.3.1 Market Overview by End-use Sector
2.4.4 Russia
2.4.4.1 Market Overview by End-use Sector
2.4.5 The United Kingdom
2.4.5.1 Market Overview by End-use Sector
2.4.6 Rest of Europe
2.4.6.1 Market Overview by End-use Sector
3. ASIA-PACIFIC
3.1 Asia-Pacific Fluorinated Ethylene Propylene (FEP) Market Overview by Geographic Region
3.2 Asia-Pacific Fluorinated Ethylene Propylene (FEP) Market Overview by End-use Sector
3.3 Major Market Players
Daikin Fluorochemicals (China) Co Ltd (China)
Daikin Industries Ltd (Japan)
Du Pont-Mitsui Fluorochemicals Co Ltd (Japan)
Dongyue Group Limited (China)
Jinhua Yonghe Fluorochemical Co Ltd (China)
Shandong Huafu Fluoro-Chemical Co Ltd (Jinan 3F) (China)
Shanghai 3F New Material Co Ltd (China)
Zhejiang Juhua Co Ltd (China)
3.4 Asia-Pacific Fluorinated Ethylene Propylene (FEP) Market Overview by Country
3.4.1 China
3.4.1.1 Market Overview by End-use Sector
3.4.2 Japan
3.4.2.1 Market Overview by End-use Sector
3.4.3 India
3.4.3.1 Market Overview by End-use Sector
3.4.4 South Korea
3.4.4.1 Market Overview by End-use Sector
3.4.5 Rest of Asia-Pacific
3.4.5.1 Market Overview by End-use Sector
4. REST OF WORLD
4.1 Rest of World Fluorinated Ethylene Propylene (FEP) Market Overview by Geographic Region
4.2 Rest of World Fluorinated Ethylene Propylene (FEP) Market Overview by End-use Sector
PART C: GUIDE TO THE INDUSTRY
1. FEP Resin Manufacturers
2. FEP Processors
PART D: ANNEXURE
1. RESEARCH METHODOLOGY
2. FEEDBACK
Charts & Graphs
PART A: GLOBAL MARKET PERSPECTIVE
Chart 1: Fluorinated Ethylene Propylene (FEP) Global Market 2012, 2016 and 2022
Chart 2: Fluorinated Ethylene Propylene (FEP) Global Market 2012, 2016 and 2022 by Geographic Region
Chart 3: Global Fluorinated Ethylene Propylene (FEP) Market (2012, 2016 & 2022) by End-use Sector – Chemical Processing, Electrical & Electronics, Mechanical/Industrial, Automotive & Transportation and Others in Metric Tons
Chart 4: Global Market for Fluorinated Ethylene Propylene (FEP) in Chemical Processing Sector (2012, 2016 & 2022) by Geographic Region – North America, Europe, Asia-Pacific and Rest of World in Metric Tons
Chart 5: Global Market for Fluorinated Ethylene Propylene (FEP) in Electrical & Electronics Sector (2012, 2016 & 2022) by Geographic Region – North America, Europe, Asia-Pacific and Rest of World in Metric Tons
Chart 6: Global Market for Fluorinated Ethylene Propylene (FEP) in Mechanical/Industrial Sector (2012, 2016 & 2022) by Geographic Region – North America, Europe, Asia-Pacific and Rest of World in Metric Tons
Chart 7: Global Market for Fluorinated Ethylene Propylene (FEP) in Automotive & Transportation Sector (2012, 2016 & 2022) by Geographic Region – North America, Europe, Asia-Pacific and Rest of World in Metric Tons
Chart 8: Global Market for Fluorinated Ethylene Propylene (FEP) in Other Sectors (2012, 2016 & 2022) by Geographic Region – North America, Europe, Asia-Pacific and Rest of World in Metric Tons
Chart 9: 2015 Global Fluorinated Ethylene Propylene (FEP) Resin Manufacturers and their Estimated Production Capacities (Metric Tons/Year)
Chart 10: 2015 Global Fluorinated Ethylene Propylene (FEP) Estimated Capacities (Metric Tons/Year) by Company
Chart 11: 2015 Global Fluorinated Ethylene Propylene (FEP) Estimated Capacities (Metric Tons/Year) by Region/Country
Chart 12: Global Fluorinated Ethylene Propylene (FEP) Market Analysis (2012-2022) in Volume (Metric Tons) and Value (USD Million)
Chart 13: Global Fluorinated Ethylene Propylene (FEP) Market Analysis (2012-2022) by End-use Sector – Chemical Processing, Electrical & Electronics, Mechanical/Industrial, Automotive & Transportation and Others in Metric Tons
Chart 14: Glance at 2012, 2017 and 2022 Global Fluorinated Ethylene Propylene (FEP) Volume Market Share (%) by End-use Sector – Chemical Processing, Electrical & Electronics, Mechanical/Industrial, Automotive & Transportation and Others
Chart 15: Global Fluorinated Ethylene Propylene (FEP) Market Analysis (2012-2022) by End-use Sector – Chemical Processing, Electrical & Electronics, Mechanical/Industrial, Automotive & Transportation and Others in USD Million
Chart 16: Glance at 2012, 2017 and 2022 Global Fluorinated Ethylene Propylene (FEP) Value Market Share (%) by End-use Sector – Chemical Processing, Electrical & Electronics, Mechanical/Industrial, Automotive & Transportation and Others
Chart 17: Global Market for Fluorinated Ethylene Propylene (FEP) in Chemical Processing Sector (2012-2022) by Geographic Region – North America, Europe, Asia-Pacific and Rest of World in Metric Tons
Chart 18: Glance at 2012, 2017 and 2022 Global Volume Market Share (%) for Fluorinated Ethylene Propylene (FEP) in Chemical Processing Sector by Geographic Region – North America, Europe, Asia-Pacific and Rest of World
Chart 19: Global Market for Fluorinated Ethylene Propylene (FEP) in Chemical Processing Sector (2012-2022) by Geographic Region – North America, Europe, Asia-Pacific and Rest of World in USD Million
Chart 20: Glance at 2012, 2017 and 2022 Global Value Market Share (%) for Fluorinated Ethylene Propylene (FEP) in Chemical Processing Sector by Geographic Region – North America, Europe, Asia-Pacific and Rest of World
Chart 21: Global Market for Fluorinated Ethylene Propylene (FEP) in Electricals & Electronics Sector (2012-2022) by Geographic Region – North America, Europe, Asia-Pacific and Rest of World in Metric Tons
Chart 22: Glance at 2012, 2017 and 2022 Global Volume Market Share (%) for Fluorinated Ethylene Propylene (FEP) in Electricals & Electronics Sector by Geographic Region – North America, Europe, Asia-Pacific and Rest of World
Chart 23: Global Market for Fluorinated Ethylene Propylene (FEP) in Electricals & Electronics Sector (2012-2022) by Geographic Region – North America, Europe, Asia-Pacific and Rest of World in USD Million
Chart 24: Glance at 2012, 2017 and 2022 Global Value Market Share (%) for Fluorinated Ethylene Propylene (FEP) in Electricals & Electronics Sector by Geographic Region – North America, Europe, Asia-Pacific and Rest of World
Chart 25: Global Market for Fluorinated Ethylene Propylene (FEP) in Mechanical/Industrial Sector (2012-2022) by Geographic Region – North America, Europe, Asia-Pacific and Rest of World in Metric Tons
Chart 26: Glance at 2012, 2017 and 2022 Global Volume Market Share (%) for Fluorinated Ethylene Propylene (FEP) in Mechanical/Industrial Sector by Geographic Region – North America, Europe, Asia-Pacific and Rest of World
Chart 27: Global Market for Fluorinated Ethylene Propylene (FEP) in Mechanical/Industrial Sector (2012-2022) by Geographic Region – North America, Europe, Asia-Pacific and Rest of World in USD Million
Chart 28: Glance at 2012, 2017 and 2022 Global Value Market Share (%) for Fluorinated Ethylene Propylene (FEP) in Mechanical/Industrial Sector by Geographic Region – North America, Europe, Asia-Pacific and Rest of World
Chart 29: Global Market for Fluorinated Ethylene Propylene (FEP) in Automotive & Transportation Sector (2012-2022) by Geographic Region – North America, Europe, Asia-Pacific and Rest of World in Metric Tons
Chart 30: Glance at 2012, 2017 and 2022 Global Volume Market Share (%) for Fluorinated Ethylene Propylene (FEP) in Automotive & Transportation Sector by Geographic Region – North America, Europe, Asia-Pacific and Rest of World
Chart 31: Global Market for Fluorinated Ethylene Propylene (FEP) in Automotive & Transportation Sector (2012-2022) by Geographic Region – North America, Europe, Asia-Pacific and Rest of World in USD Million
Chart 32: Glance at 2012, 2017 and 2022 Global Value Market Share (%) for Fluorinated Ethylene Propylene (FEP) in Automotive & Transportation Sector by Geographic Region – North America, Europe, Asia-Pacific and Rest of World
Chart 33: Global Market for Fluorinated Ethylene Propylene (FEP) in Other Sectors (2012-2022) by Geographic Region – North America, Europe, Asia-Pacific and Rest of World in Metric Tons
Chart 34: Glance at 2012, 2017 and 2022 Global Volume Market Share (%) for Fluorinated Ethylene Propylene (FEP) in Other Sectors by Geographic Region – North America, Europe, Asia-Pacific and Rest of World
Chart 35: Global Market for Fluorinated Ethylene Propylene (FEP) in Other Sectors (2012-2022) by Geographic Region – North America, Europe, Asia-Pacific and Rest of World in USD Million
Chart 36: Glance at 2012, 2017 and 2022 Global Value Market Share (%) for Fluorinated Ethylene Propylene (FEP) in Other Sectors by Geographic Region – North America, Europe, Asia-Pacific and Rest of World
PART B: REGIONAL MARKET PERSPECTIVE
Chart 37: Global Fluorinated Ethylene Propylene (FEP) Market Analysis (2012-2022) by Geographic Region – North America, Europe, Asia-Pacific and Rest of World in Metric Tons
Chart 38: Glance at 2012, 2017 and 2022 Global Fluorinated Ethylene Propylene (FEP) Volume Market Share (%) by Geographic Region – North America, Europe, Asia-Pacific and Rest of World
Chart 39: Global Fluorinated Ethylene Propylene (FEP) Market Analysis (2012-2022) by Geographic Region – North America, Europe, Asia-Pacific and Rest of World in USD Million
Chart 40: Glance at 2012, 2017 and 2022 Global Fluorinated Ethylene Propylene (FEP) Value Market Share (%) by Geographic Region – North America, Europe, Asia-Pacific and Rest of World
REGIONAL MARKET OVERVIEW
NORTH AMERICA
Chart 41: North American Fluorinated Ethylene Propylene (FEP) Market Analysis (2012-2022) in Volume (Metric Tons) and Value (USD Million)
Chart 42: North American Fluorinated Ethylene Propylene (FEP) Market Analysis (2012-2022) by Geographic Region – United States, Canada and Mexico in Metric Tons
Chart 43: Glance at 2012, 2017 and 2022 North American Fluorinated Ethylene Propylene (FEP) Volume Market Share (%) by Geographic Region – United States, Canada and Mexico
Chart 44: North American Fluorinated Ethylene Propylene (FEP) Market Analysis (2012-2022) by Geographic Region – United States, Canada and Mexico in USD Million
Chart 45: Glance at 2012, 2017 and 2022 North American Fluorinated Ethylene Propylene (FEP) Value Market Share (%) by Geographic Region – United States, Canada and Mexico
Chart 46: North American Fluorinated Ethylene Propylene (FEP) Market Analysis (2012-2022) by End-use Sector – Chemical Processing, Electrical & Electronics, Mechanical/Industrial, Automotive & Transportation and Others in Metric Tons
Chart 47: Glance at 2012, 2017 and 2022 North American Fluorinated Ethylene Propylene (FEP) Volume Market Share (%) by End-use Sector – Chemical Processing, Electrical & Electronics, Mechanical/Industrial, Automotive & Transportation and Others
Chart 48: North American Fluorinated Ethylene Propylene (FEP) Market Analysis (2012-2022) by End-use Sector – Chemical Processing, Electrical & Electronics, Mechanical/Industrial, Automotive & Transportation and Others in USD Million
Chart 49: Glance at 2012, 2017 and 2022 North American Fluorinated Ethylene Propylene (FEP) Value Market Share (%) by End-use Sector – Chemical Processing, Electrical & Electronics, Mechanical/Industrial, Automotive & Transportation and Others
The United States
Chart 50: United States Fluorinated Ethylene Propylene (FEP) Market Analysis (2012-2022) in Volume (Metric Tons) and Value (USD Million)
Chart 51: United States Fluorinated Ethylene Propylene (FEP) Market Analysis (2012-2022) by End-use Sector – Chemical Processing, Electrical & Electronics, Mechanical/Industrial, Automotive & Transportation and Others in Metric Tons
Chart 52: Glance at 2012, 2017 and 2022 United States Fluorinated Ethylene Propylene (FEP) Volume Market Share (%) by End-use Sector – Chemical Processing, Electrical & Electronics, Mechanical/Industrial, Automotive & Transportation and Others
Chart 53: United States Fluorinated Ethylene Propylene (FEP) Market Analysis (2012-2022) by End-use Sector – Chemical Processing, Electrical & Electronics, Mechanical/Industrial, Automotive & Transportation and Others in USD Million
Chart 54: Glance at 2012, 2017 and 2022 United States Fluorinated Ethylene Propylene (FEP) Value Market Share (%) by End-use Sector – Chemical Processing, Electrical & Electronics, Mechanical/Industrial, Automotive & Transportation and Others
Canada
Chart 55: Canadian Fluorinated Ethylene Propylene (FEP) Market Analysis (2012-2022) in Volume (Metric Tons) and Value (USD Million)
Chart 56: Canadian Fluorinated Ethylene Propylene (FEP) Market Analysis (2012-2022) by End-use Sector – Chemical Processing, Electrical & Electronics and Others in Metric Tons
Chart 57: Glance at 2012, 2017 and 2022 Canadian Fluorinated Ethylene Propylene (FEP) Volume Market Share (%) by End-use Sector – Chemical Processing, Electrical & Electronics and Others
Chart 58: Canadian Fluorinated Ethylene Propylene (FEP) Market Analysis (2012-2022) by End-use Sector – Chemical Processing, Electrical & Electronics and Others in USD Million
Chart 59: Glance at 2012, 2017 and 2022 Canadian Fluorinated Ethylene Propylene (FEP) Value Market Share (%) by End-use Sector – Chemical Processing, Electrical & Electronics and Others
Mexico
Chart 60: Mexican Fluorinated Ethylene Propylene (FEP) Market Analysis (2012-2022) in Volume (Metric Tons) and Value (USD Million)
Chart 61: Mexican Fluorinated Ethylene Propylene (FEP) Market Analysis (2012-2022) by End-use Sector – Chemical Processing, Electrical & Electronics and Others in Metric Tons
Chart 62: Glance at 2012, 2017 and 2022 Mexican Fluorinated Ethylene Propylene (FEP) Volume Market Share (%) by End-use Sector – Chemical Processing, Electrical & Electronics and Others
Chart 63: Mexican Fluorinated Ethylene Propylene (FEP) Market Analysis (2012-2022) by End-use Sector – Chemical Processing, Electrical & Electronics and Others in USD Million
Chart 64: Glance at 2012, 2017 and 2022 Mexican Fluorinated Ethylene Propylene (FEP) Value Market Share (%) by End-use Sector – Chemical Processing, Electrical & Electronics and Others
EUROPE
Chart 65: European Fluorinated Ethylene Propylene (FEP) Market Analysis (2012-2022) in Volume (Metric Tons) and Value (USD Million)
Chart 66: European Fluorinated Ethylene Propylene (FEP) Market Analysis (2012-2022) by Geographic Region – France, Germany, Italy, Russia, The United Kingdom and Rest of Europe in Metric Tons
Chart 67: Glance at 2012, 2017 and 2022 European Fluorinated Ethylene Propylene (FEP) Volume Market Share (%) by Geographic Region – France, Germany, Italy, Russia, The United Kingdom and Rest of Europe
Chart 68: European Fluorinated Ethylene Propylene (FEP) Market Analysis (2012-2022) by Geographic Region – France, Germany, Italy, Russia, The United Kingdom and Rest of Europe in USD Million
Chart 69: Glance at 2012, 2017 and 2022 European Fluorinated Ethylene Propylene (FEP) Value Market Share (%) by Geographic Region – France, Germany, Italy, Russia, The United Kingdom and Rest of Europe
Chart 70: European Fluorinated Ethylene Propylene (FEP) Market Analysis (2012-2022) by End-use Sector – Chemical Processing, Electrical & Electronics, Mechanical/Industrial, Automotive & Transportation and Others in Metric Tons
Chart 71: Glance at 2012, 2017 and 2022 European Fluorinated Ethylene Propylene (FEP) Volume Market Share (%) by End-use Sector – Chemical Processing, Electrical & Electronics, Mechanical/Industrial, Automotive & Transportation and Others
Chart 72: European Fluorinated Ethylene Propylene (FEP) Market Analysis (2012-2022) by End-use Sector – Chemical Processing, Electrical & Electronics, Mechanical/Industrial, Automotive & Transportation and Others in USD Million
Chart 73: Glance at 2012, 2017 and 2022 European Fluorinated Ethylene Propylene (FEP) Value Market Share (%) by End-use Sector – Chemical Processing, Electrical & Electronics, Mechanical/Industrial, Automotive & Transportation and Others
France
Chart 74: French Fluorinated Ethylene Propylene (FEP) Market Analysis (2012-2022) in Volume (Metric Tons) and Value (USD Million)
Chart 75: French Fluorinated Ethylene Propylene (FEP) Market Analysis (2012-2022) by End-use Sector – Chemical Processing, Electrical & Electronics, Mechanical/Industrial, Automotive & Transportation and Others in Metric Tons
Chart 76: Glance at 2012, 2017 and 2022 French Fluorinated Ethylene Propylene (FEP) Volume Market Share (%) by End-use Sector – Chemical Processing, Electrical & Electronics, Mechanical/Industrial, Automotive & Transportation and Others
Chart 77: French Fluorinated Ethylene Propylene (FEP) Market Analysis (2012-2022) by End-use Sector – Chemical Processing, Electrical & Electronics, Mechanical/Industrial, Automotive & Transportation and Others in USD Million
Chart 78: Glance at 2012, 2017 and 2022 French Fluorinated Ethylene Propylene (FEP) Value Market Share (%) by End-use Sector – Chemical Processing, Electrical & Electronics, Mechanical/Industrial, Automotive & Transportation and Others
Germany
Chart 79: German Fluorinated Ethylene Propylene (FEP) Market Analysis (2012-2022) in Volume (Metric Tons) and Value (USD Million)
Chart 80: German Fluorinated Ethylene Propylene (FEP) Market Analysis (2012-2022) by End-use Sector – Chemical Processing, Electrical & Electronics, Mechanical/Industrial, Automotive & Transportation and Others in Metric Tons
Chart 81: Glance at 2012, 2017 and 2022 German Fluorinated Ethylene Propylene (FEP) Volume Market Share (%) by End-use Sector – Chemical Processing, Electrical & Electronics, Mechanical/Industrial, Automotive & Transportation and Others
Chart 82: German Fluorinated Ethylene Propylene (FEP) Market Analysis (2012-2022) by End-use Sector – Chemical Processing, Electrical & Electronics, Mechanical/Industrial, Automotive & Transportation and Others in USD Million
Chart 83: Glance at 2012, 2017 and 2022 German Fluorinated Ethylene Propylene (FEP) Value Market Share (%) by End-use Sector – Chemical Processing, Electrical & Electronics, Mechanical/Industrial, Automotive & Transportation and Others
Italy
Chart 84: Italian Fluorinated Ethylene Propylene (FEP) Market Analysis (2012-2022) in Volume (Metric Tons) and Value (USD Million)
Chart 85: Italian Fluorinated Ethylene Propylene (FEP) Market Analysis (2012-2022) by End-use Sector – Chemical Processing, Electrical & Electronics, Mechanical/Industrial, Automotive & Transportation and Others in Metric Tons
Chart 86: Glance at 2012, 2017 and 2022 Italian Fluorinated Ethylene Propylene (FEP) Volume Market Share (%) by End-use Sector – Chemical Processing, Electrical & Electronics, Mechanical/Industrial, Automotive & Transportation and Others
Chart 87: Italian Fluorinated Ethylene Propylene (FEP) Market Analysis (2012-2022) by End-use Sector – Chemical Processing, Electrical & Electronics, Mechanical/Industrial, Automotive & Transportation and Others in USD Million
Chart 88: Glance at 2012, 2017 and 2022 Italian Fluorinated Ethylene Propylene (FEP) Value Market Share (%) by End-use Sector – Chemical Processing, Electrical & Electronics, Mechanical/Industrial, Automotive & Transportation and Others
Russia
Chart 89: Russian Fluorinated Ethylene Propylene (FEP) Market Analysis (2012-2022) in Volume (Metric Tons) and Value (USD Million)
Chart 90: Russian Fluorinated Ethylene Propylene (FEP) Market Analysis (2012-2022) by End-use Sector – Chemical Processing, Electrical & Electronics, Mechanical/Industrial and Others in Metric Tons
Chart 91: Glance at 2012, 2017 and 2022 Russian Fluorinated Ethylene Propylene (FEP) Volume Market Share (%) by End-use Sector – Chemical Processing, Electrical & Electronics, Mechanical/Industrial and Others
Chart 92: Russian Fluorinated Ethylene Propylene (FEP) Market Analysis (2012-2022) by End-use Sector – Chemical Processing, Electrical & Electronics, Mechanical/Industrial and Others in USD Million
Chart 93: Glance at 2012, 2017 and 2022 Russian Fluorinated Ethylene Propylene (FEP) Value Market Share (%) by End-use Sector – Chemical Processing, Electrical & Electronics, Mechanical/Industrial and Others
The United Kingdom
Chart 94: UK Fluorinated Ethylene Propylene (FEP) Market Analysis (2012-2022) in Volume (Metric Tons) and Value (USD Million)
Chart 95: UK Fluorinated Ethylene Propylene (FEP) Market Analysis (2012-2022) by End-use Sector – Chemical Processing, Electrical & Electronics, Mechanical/Industrial, Automotive & Transportation and Others in Metric Tons
Chart 96: Glance at 2012, 2017 and 2022 UK Fluorinated Ethylene Propylene (FEP) Volume Market Share (%) by End-use Sector – Chemical Processing, Electrical & Electronics, Mechanical/Industrial, Automotive & Transportation and Others
Chart 97: UK Fluorinated Ethylene Propylene (FEP) Market Analysis (2012-2022) by End-use Sector – Chemical Processing, Electrical & Electronics, Mechanical/Industrial, Automotive & Transportation and Others in USD Million
Chart 98: Glance at 2012, 2017 and 2022 UK Fluorinated Ethylene Propylene (FEP) Value Market Share (%) by End-use Sector – Chemical Processing, Electrical & Electronics, Mechanical/Industrial, Automotive & Transportation and Others
Rest of Europe
Chart 99: Rest of Europe Fluorinated Ethylene Propylene (FEP) Market Analysis (2012-2022) in Volume (Metric Tons) and Value (USD Million)
Chart 100: Rest of Europe Fluorinated Ethylene Propylene (FEP) Market Analysis (2012-2022) by End-use Sector – Chemical Processing, Electrical & Electronics, Mechanical/Industrial, Automotive & Transportation and Others in Metric Tons
Chart 101: Glance at 2012, 2017 and 2022 Rest of Europe Fluorinated Ethylene Propylene (FEP) Volume Market Share (%) by End-use Sector – Chemical Processing, Electrical & Electronics, Mechanical/Industrial, Automotive & Transportation and Others
Chart 102: Rest of Europe Fluorinated Ethylene Propylene (FEP) Market Analysis (2012-2022) by End-use Sector – Chemical Processing, Electrical & Electronics, Mechanical/Industrial, Automotive & Transportation and Others in USD Million
Chart 103: Glance at 2012, 2017 and 2022 Rest of Europe Fluorinated Ethylene Propylene (FEP) Value Market Share (%) by End-use Sector – Chemical Processing, Electrical & Electronics, Mechanical/Industrial, Automotive & Transportation and Others
ASIA-PACIFIC
Chart 104: Asia-Pacific Fluorinated Ethylene Propylene (FEP) Market Analysis (2012-2022) in Volume (Metric Tons) and Value (USD Million)
Chart 105: Asia-Pacific Fluorinated Ethylene Propylene (FEP) Market Analysis (2012-2022) by Geographic Region – China, Japan, India, South Korea and Rest of Asia-Pacific in Metric Tons
Chart 106: Glance at 2012, 2017 and 2022 Asia-Pacific Fluorinated Ethylene Propylene (FEP) Volume Market Share (%) by Geographic Region – China, Japan, India, South Korea and Rest of Asia-Pacific
Chart 107: Asia-Pacific Fluorinated Ethylene Propylene (FEP) Market Analysis (2012-2022) by Geographic Region – China, Japan, India, South Korea and Rest of Asia-Pacific in USD Million
Chart 108: Glance at 2012, 2017 and 2022 Asia-Pacific Fluorinated Ethylene Propylene (FEP) Value Market Share (%) by Geographic Region – China, Japan, India, South Korea and Rest of Asia-Pacific
Chart 109: Asia-Pacific Fluorinated Ethylene Propylene (FEP) Market Analysis (2012-2022) by End-use Sector – Chemical Processing, Electrical & Electronics, Mechanical/Industrial, Automotive & Transportation and Others in Metric Tons
Chart 110: Glance at 2012, 2017 and 2022 Asia-Pacific Fluorinated Ethylene Propylene (FEP) Volume Market Share (%) by End-use Sector – Chemical Processing, Electrical & Electronics, Mechanical/Industrial, Automotive & Transportation and Others
Chart 111: Asia-Pacific Fluorinated Ethylene Propylene (FEP) Market Analysis (2012-2022) by End-use Sector – Chemical Processing, Electrical & Electronics, Mechanical/Industrial, Automotive & Transportation and Others in USD Million
Chart 112: Glance at 2012, 2017 and 2022 Asia-Pacific Fluorinated Ethylene Propylene (FEP) Value Market Share (%) by End-use Sector – Chemical Processing, Electrical & Electronics, Mechanical/Industrial, Automotive & Transportation and Others
China
Chart 113: Chinese Fluorinated Ethylene Propylene (FEP) Market Analysis (2012-2022) in Volume (Metric Tons) and Value (USD Million)
Chart 114: Chinese Fluorinated Ethylene Propylene (FEP) Market Analysis (2012-2022) by End-use Sector – Chemical Processing, Electrical & Electronics, Mechanical/Industrial, Automotive & Transportation and Others in Metric Tons
Chart 115: Glance at 2012, 2017 and 2022 Chinese Fluorinated Ethylene Propylene (FEP) Volume Market Share (%) by End-use Sector – Chemical Processing, Electrical & Electronics, Mechanical/Industrial, Automotive & Transportation and Others
Chart 116: Chinese Fluorinated Ethylene Propylene (FEP) Market Analysis (2012-2022) by End-use Sector – Chemical Processing, Electrical & Electronics, Mechanical/Industrial, Automotive & Transportation and Others in USD Million
Chart 117: Glance at 2012, 2017 and 2022 Chinese Fluorinated Ethylene Propylene (FEP) Value Market Share (%) by End-use Sector – Chemical Processing, Electrical & Electronics, Mechanical/Industrial, Automotive & Transportation and Others
Japan
Chart 118: Japanese Fluorinated Ethylene Propylene (FEP) Market Analysis (2012-2022) in Volume (Metric Tons) and Value (USD Million)
Chart 119: Japanese Fluorinated Ethylene Propylene (FEP) Market Analysis (2012-2022) by End-use Sector – Chemical Processing, Electrical & Electronics, Mechanical/Industrial, Automotive & Transportation and Others in Metric Tons
Chart 120: Glance at 2012, 2017 and 2022 Japanese Fluorinated Ethylene Propylene (FEP) Volume Market Share (%) by End-use Sector – Chemical Processing, Electrical & Electronics, Mechanical/Industrial, Automotive & Transportation and Others
Chart 121: Japanese Fluorinated Ethylene Propylene (FEP) Market Analysis (2012-2022) by End-use Sector – Chemical Processing, Electrical & Electronics, Mechanical/Industrial, Automotive & Transportation and Others in USD Million
Chart 122: Glance at 2012, 2017 and 2022 Japanese Fluorinated Ethylene Propylene (FEP) Value Market Share (%) by End-use Sector – Chemical Processing, Electrical & Electronics, Mechanical/Industrial, Automotive & Transportation and Others
India
Chart 123: Indian Fluorinated Ethylene Propylene (FEP) Market Analysis (2012-2022) in Volume (Metric Tons) and Value (USD Million)
Chart 124: Indian Fluorinated Ethylene Propylene (FEP) Market Analysis (2012-2022) by End-use Sector – Chemical Processing, Electrical & Electronics and Others in Metric Tons
Chart 125: Glance at 2012, 2017 and 2022 Indian Fluorinated Ethylene Propylene (FEP) Volume Market Share (%) by End-use Sector – Chemical Processing, Electrical & Electronics and Others
Chart 126: Indian Fluorinated Ethylene Propylene (FEP) Market Analysis (2012-2022) by End-use Sector – Chemical Processing, Electrical & Electronics and Others in USD Million
Chart 127: Glance at 2012, 2017 and 2022 Indian Fluorinated Ethylene Propylene (FEP) Value Market Share (%) by End-use Sector – Chemical Processing, Electrical & Electronics and Others
South Korea
Chart 128: South Korean Fluorinated Ethylene Propylene (FEP) Market Analysis (2012-2022) in Volume (Metric Tons) and Value (USD Million)
Chart 129: South Korean Fluorinated Ethylene Propylene (FEP) Market Analysis (2012-2022) by End-use Sector – Chemical Processing, Electrical & Electronics, Mechanical/Industrial, Automotive & Transportation and Others in Metric Tons
Chart 130: Glance at 2012, 2017 and 2022 South Korean Fluorinated Ethylene Propylene (FEP) Volume Market Share (%) by End-use Sector – Chemical Processing, Electrical & Electronics, Mechanical/Industrial, Automotive & Transportation and Others
Chart 131: South Korean Fluorinated Ethylene Propylene (FEP) Market Analysis (2012-2022) by End-use Sector – Chemical Processing, Electrical & Electronics, Mechanical/Industrial, Automotive & Transportation and Others in USD Million
Chart 132: Glance at 2012, 2017 and 2022 South Korean Fluorinated Ethylene Propylene (FEP) Value Market Share (%) by End-use Sector – Chemical Processing, Electrical & Electronics, Mechanical/Industrial, Automotive & Transportation and Others
Rest of Asia-Pacific
Chart 133: Rest of Asia-Pacific Fluorinated Ethylene Propylene (FEP) Market Analysis (2012-2022) in Volume (Metric Tons) and Value (USD Million)
Chart 134: Rest of Asia-Pacific Fluorinated Ethylene Propylene (FEP) Market Analysis (2012-2022) by End-use Sector – Chemical Processing, Electrical & Electronics, Mechanical/Industrial, Automotive & Transportation and Others in Metric Tons
Chart 135: Glance at 2012, 2017 and 2022 Rest of Asia-Pacific Fluorinated Ethylene Propylene (FEP) Volume Market Share (%) by End-use Sector – Chemical Processing, Electrical & Electronics, Mechanical/Industrial, Automotive & Transportation and Others
Chart 136: Rest of Asia-Pacific Fluorinated Ethylene Propylene (FEP) Market Analysis (2012-2022) by End-use Sector – Chemical Processing, Electrical & Electronics, Mechanical/Industrial, Automotive & Transportation and Others in USD Million
Chart 137: Glance at 2012, 2017 and 2022 Rest of Asia-Pacific Fluorinated Ethylene Propylene (FEP) Value Market Share (%) by End-use Sector – Chemical Processing, Electrical & Electronics, Mechanical/Industrial, Automotive & Transportation and Others
REST OF WORLD
Chart 138: Rest of World Fluorinated Ethylene Propylene (FEP) Market Analysis (2012-2022) in Volume (Metric Tons) and Value (USD Million)
Chart 139: Rest of World Fluorinated Ethylene Propylene (FEP) Market Analysis (2012-2022) by Geographic Region – South America and Middle East & Africa in Metric Tons
Chart 140: Glance at 2012, 2017 and 2022 Rest of World Fluorinated Ethylene Propylene (FEP) Volume Market Share (%) by Geographic Region – South America and Middle East & Africa
Chart 141: Rest of World Fluorinated Ethylene Propylene (FEP) Market Analysis (2012-2022) by Geographic Region – South America and Middle East & Africa in USD Million
Chart 142: Glance at 2012, 2017 and 2022 Rest of World Fluorinated Ethylene Propylene (FEP) Value Market Share (%) by Geographic Region – South America and Middle East & Africa
Chart 143: Rest of World Fluorinated Ethylene Propylene (FEP) Market Analysis (2012-2022) by End-use Sector – Chemical Processing, Electrical & Electronics, Mechanical/Industrial and Others in Metric Tons
Chart 144: Glance at 2012, 2017 and 2022 Rest of World Fluorinated Ethylene Propylene (FEP) Volume Market Share (%) by End-use Sector – Chemical Processing, Electrical & Electronics, Mechanical/Industrial and Others
Chart 145: Rest of World Fluorinated Ethylene Propylene (FEP) Market Analysis (2012-2022) by End-use Sector – Chemical Processing, Electrical & Electronics, Mechanical/Industrial and Others in USD Million
Chart 146: Glance at 2012, 2017 and 2022 Rest of World Fluorinated Ethylene Propylene (FEP) Value Market Share (%) by End-use Sector – Chemical Processing, Electrical & Electronics, Mechanical/Industrial and Others
Tables & Figures
Table 1: Types of Fluoropolymers
Table 2: Properties and Applications of Different Fluoropolymers
Figure 1: Preparation of FEP
3M Company
Daikin Industries Ltd
Dongyue Group Limited
Shanghai 3F New Material Co Ltd
The Chemours Company
Zhejiang Juhua Co Ltd
SINGLE USER/ENTERPRISE LICENSE
Electronic (PDF)
Latest Version Available!
Latest version of this report is available. Click below to view report.
Latest Publication
avialable for this report
OTHER ARCHIVED REPORTS

Natural Source Vitamin E (Tocopherols and Tocotrienols) – A Global Market Overview
Report Code: PH002ARCH | Pages: 278 | Price: $2700
Published
Oct 2021

Vacuum Insulation Panels (VIPs) – A Global Market Overview-2021
Report Code: MG023ARCH | Pages: 272 | Price: $1800
Published
Jan 2021
Powder Metallurgy – A Global Market Overview
Report Code: CP057ARCH | Pages: 567 | Price: $2187
Published
Oct 2020

Hydraulic Components – A Global Market Overview
Report Code: MG014ARCH | Pages: 464 | Price: $2475
Published
Aug 2020

Global Zeolites Market – Products and Applications | Covid-19 Impact
Report Code: CP091ARCH | Pages: 450 | Price: $2475
Published
Jul 2020