Report Synopsis
Over the long term, consumer awareness regarding improved health and the increase in ageing population worldwide are anticipated to create robust demand for nutraceutical products including natural source vitamin E supplements. Dietary supplements enriched with natural vitamin E are finding wider acceptance among consumers for improving energy and endurance and reducing muscle damage after exercising. Also, a few alpha tocopherol-containing health supplements have been found to decrease the risk of bone fracture for the geriatric population, in addition to improving overall muscular strength. This is another factor that is likely to impact natural vitamin E market growth in a positive manner.
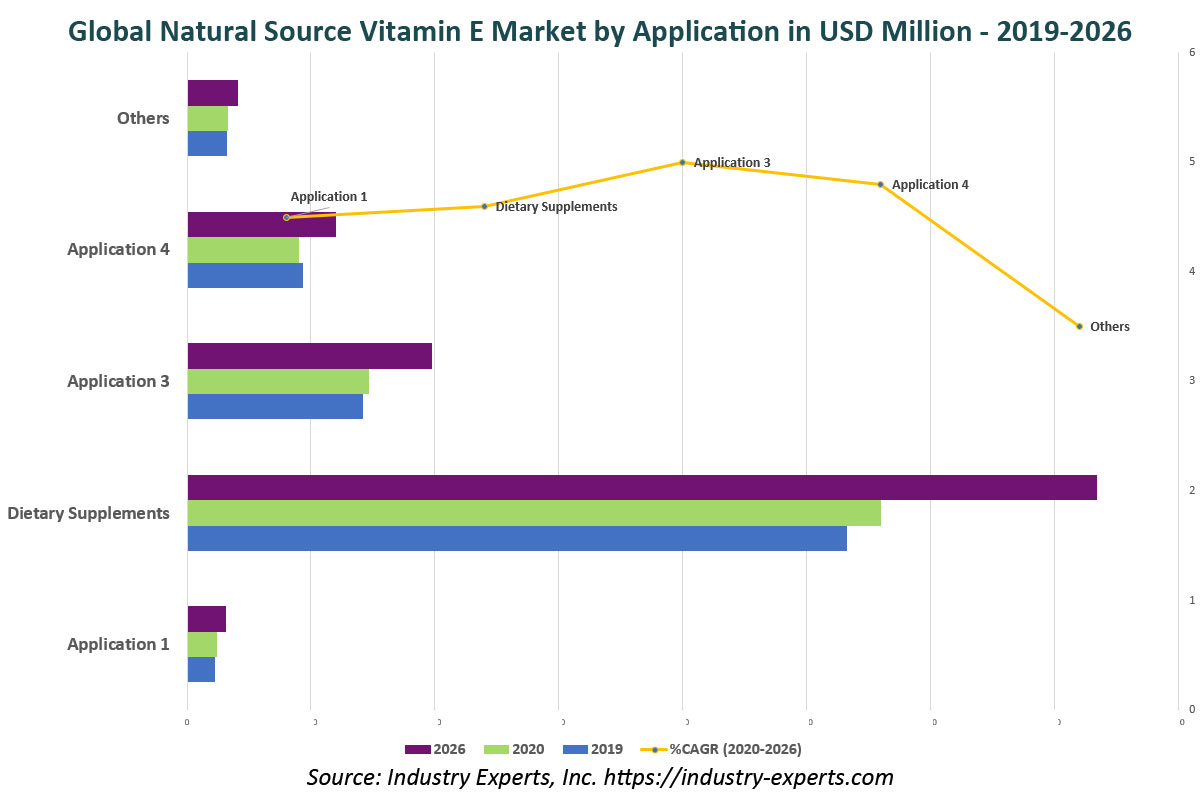
While most of the application areas of Natural Vitamin E shown positive growth during the COVID-19 pandemic such as Animal Feed, Dietary Supplements, Food & Beverages globally, Cosmetics & Personal Care witnessed a negative impact in 2020 compared to 2019. The market for Natural Vitamin E in Food & Beverages experienced a slightly slower growth during 2019-2019 but sector is projected to record the fastest growth with a CAGR of 4.7% in terms of volumes to reach 4k metric tons by 2026.
Research Findings & Coverage
- Global Natural Source Vitamin E market is analyzed in this report with respect to key product types and major end-use sectors
- The study exclusively analyzes the market size of each product type and end-use sectors of Vitamin E by a major geographic region
- COVID-19 Pandemic Impact Analysis on Global Natural Vitamin E Market
- Analysis of Market Drivers, Restraints and Opportunities
- Key business trends focusing on product innovations/developments, M&As, JVs and other recent industry developments
- Major companies profiled – 43
- The industry guide includes the contact details for 217 companies
Product Outline
The report analyzes the market for the following key product types of Natural Vitamin E:
- Tocopherols
- Tocotrienols
End-Use sectors of Natural Vitamin E analyzed comprise the following:
- Animal Feed
- Dietary Supplements
- Food & Beverages
- Cosmetics & Personal Care
- Other sectors
Analysis Period, Units and Growth Rates
- The report reviews, analyzes and projects the global Natural Vitamin E market for the period 2017-2026 in terms of volumes in Metric Tons and market value in US$ and the compound annual growth rates (CAGRs) projected from 2020 through 2026 with a special focus on y-o-y growth analysis for 2019-2020
Geographic Coverage
- North America (The United States, Canada and Mexico)
- Europe (Germany, France, Italy, Spain, The United Kingdom, The Netherlands and Rest of World)
- Asia-Pacific (China, India, Japan and Rest of Asia-Pacific)
- South America (Brazil, Argentina and Rest of South America)
- Rest of World
PART A: GLOBAL MARKET PERSPECTIVE
1. INTRODUCTION
1.1 Market Drivers and Opportunities
1.2 Overall Vitamin E Market At-a-Glance
1.3 Product Outline
1.3.1 What is Vitamin E?
1.3.2 Forms of Vitamin E
1.3.2.1 Synthetic Vitamin E
1.3.2.2 Natural Source Vitamin E
1.3.2.2.1 Tocopherols
1.3.2.2.2 Tocotrienols
1.3.2.2.3 Vitamin E TPGS (d-Alpha Tocopheryl Polyethylene Glycol 1000 Succinate)
1.3.3 Manufacturing Processes of Vitamin E
1.3.3.1 Synthetic Vitamin E
1.3.3.2 Natural Source Vitamin E
1.3.3.2.1 Tocopherols
1.3.3.2.2 Tocotrienols
1.3.4 Sources of Vitamin E
1.3.4.1 Food Sources
1.3.4.2 Dietary Supplements
1.3.5 Vitamin E Health Claims
1.3.5.1 Coronary Heart Disease
1.3.5.2 Cancer
1.3.5.3 Disorders of the Eyes
1.3.5.4 Cognitive Decline
1.3.6 End-Use Applications of Vitamin E
1.3.6.1 Animal Nutrition
1.3.6.2 Human Nutritional/Dietary Supplements
1.3.6.3 Functional Food and Beverages
1.3.6.4 Cosmetics
1.3.6.5 Other Applications
2. REGULATIONS FOR DIETARY SUPPLEMENTS AND INGREDIENTS
2.1 Regulations for Dietary Supplements and Ingredients as per the US Food and Drug Administration (FDA)
2.1.1 How the Safety of Dietary Supplements is Ensured
2.1.2 Registration of Food Facilities
2.1.3 Notification Process for New Dietary Ingredients
2.2 FDA Changes Nutrition Facts Label on Food Packaging
2.2.1 FDA Guidance for Industry on Converting Units of Measure for Vitamin E
2.3 European Union: Traceability and Labeling of GMOs
3. INDUSTRY LANDSCAPE
3.1 Global Vitamin E Production Capacities
3.1.1 Global Natural Vitamin E Tocopherols Capacity
3.1.2 Global Natural Vitamin E Tocotrienols Capacity
3.2 Natural Vitamin E Tocopherols Manufacturers
Advanced Organic Materials S.A. (Argentina)
Archer Daniels Midland Company (United States)
BTSA Biotecnologias Aplicadas Sl (Spain)
COFCO Tech Bioengineering (Tianjin) Co., Ltd. (China)
DSM Nutritional Products (Royal DSM NV) (Netherlands)
Cargill, Inc (United States)
Fenchem Biotek Ltd. (China)
Fujian Glanny Bio-Engineering Co., Ltd. (China)
Kensing, LLC. (United States)
Mitsubishi-Chemical Foods Corporation (Japan)
Tama Biochemical Co., Ltd. (Japan)
Riken Vitamin Co., Ltd. (Japan)
Vitae Naturals (Vitae Caps, S.A.) (Spain)
Wilmar Spring Fruit Nutrition Products (Jiangsu) Co., Ltd. (China)
Xi'an Healthful Biotechnology Co Ltd (HSF) (China)
Zhejiang Medicine Co., Ltd. (China)
Zhejiang Worldbestve Biotechnology Co., Ltd. (China)
3.3 Natural Vitamin E Tocotrienols Manufacturers
American River Nutrition, Inc. (United States)
Beijing Gingko Group (China)
ExcelVite Sdn. Bhd. (Malaysia)
KLK Oleo (Davos Life Science) (Singapore)
Musim Mas Group (Singapore)
Sime Darby Oils Nutrition (Malaysia)
Vance Group Ltd. (Singapore)
4. KEY BUSINESS TRENDS
One Rock Capital Partners Acquires BASF's Kankakee, Illinois Natural Vitamin E Plant
Antares Introduces Pharmaceutical and Food Grade Non-GMO Sunflower TPGS
Sime Darby Oils and Universiti Kebangsaan Malaysia Collaborated on Tocotrienols for the Treatment of Non-Alcoholic Fatty Liver Disease Clinical Trail
IIT Madras Researchers Engineered High Vitamin E Producing Sunflower Plant Cells
American River Nutrition and Beijing Ginkgo Group Locked in a Patent Infringement Battle
Designs for Health's New Vitamin E Tocotrienol Product Unveiled
Advanced Organic Materials Plans to Establish Manufacturing Plant in Spain
BTSA Inaugurates New USA-Based Branch
ExcelVite's Vitamin E Tocotrienol Ingredient Launched
Vitae Naturals' Vitasterol Range Completes REACH Registration Process
Advanced Organic Materials Granted FSSC 22000 Certification
5. GLOBAL MARKET OVERVIEW
5.1 Global Natural Vitamin E Market Overview by End-Use Application
5.2 Global Natural Vitamin E Market Overview by Type
5.2.1 Natural Vitamin E – Tocopherols
5.2.1.1 Global Natural Vitamin E Tocopherols Market Overview by End-Use Application
5.2.2 Natural Vitamin E – Tocotrienols
5.2.2.1 Global Natural Vitamin E Tocotrienols Market Overview by End-Use Application
PART B: REGIONAL MARKET PERSPECTIVE
Overall Natural Vitamin E Market Overview by Geographic Region
Global Natural Vitamin E Tocopherols Market Overview by Geographic Region
Global Natural Vitamin E Tocotrienols Market Overview by Geographic Region
REGIONAL MARKET OVERVIEW
6. NORTH AMERICA
6.1 North American Natural Vitamin E Market Overview by End-Use Application
6.2 North American Natural Vitamin E Market Overview by Geographic Region
6.3 North American Natural Vitamin E Market Overview by Type
6.3.1 Natural Vitamin E – Tocopherols
6.3.1.1 North American Natural Vitamin E Tocopherols Market Overview by End-Use Application
6.3.1.2 North American Natural Vitamin E Tocopherols Market Overview by Geographic Region
6.3.2 Natural Vitamin E – Tocotrienols
6.3.2.1 North American Natural Vitamin E Tocotrienols Market Overview by End-Use Application
6.3.2.2 North American Natural Vitamin E Tocotrienols Market Overview by Geographic Region
6.4 Major Market Players
American River Nutrition, Inc. (United States)
Antares Health Products, Inc. (United States)
Archer Daniels Midland Company (United States)
DSM Nutritional Products, LLC (United States)
Cargill, Inc. (United States)
Kensing, LLC. (United States)
6.5 Country-wise Analysis of North American Natural Vitamin E Market
6.5.1 The United States
6.5.1.1 United States Natural Vitamin E Market Overview by End-Use Application
6.5.1.1.1 United States Natural Vitamin E Tocopherols Market Overview by End-Use Application
6.5.1.1.2 United States Natural Vitamin E Tocotrienols Market Overview by End-Use Application
6.5.2 Mexico
6.5.2.1 Mexico Natural Vitamin E Market Overview by End-use Application
6.5.2.1.1 Mexico Natural Vitamin E Tocopherols Market Overview by End-use Application
6.5.2.1.2 Mexico Natural Vitamin E Tocotrienols Market Overview by End-use Application
6.5.3 Canada
6.5.3.1 Canada Natural Vitamin E Market Overview by End-use Application
6.5.3.1.1 Canada Natural Vitamin E Tocopherols Market Overview by End-use Application
6.5.3.1.2 Canada Natural Vitamin E Tocotrienols Market Overview by End-use Application
7. EUROPE
7.1 European Natural Vitamin E Market Overview by End-use Application
7.2 European Natural Vitamin E Market Overview by Type
7.2.1 Natural Vitamin E – Tocopherols
7.2.1.1 European Natural Vitamin E Tocopherols Market Overview by End-use Application
7.2.1.2 European Natural Vitamin E Tocopherols Market Overview by Geographic Region
7.2.2 Natural Vitamin E – Tocotrienols
7.2.2.1 European Natural Vitamin E Tocotrienols Market Overview by End-use Application
7.3 Major Market Players
BTSA Biotecnologias Aplicadas Sl (Spain)
PMC Isochem (France)
Recordati Rare Diseases SARL (France)
Royal DSM NV (DSM Nutritional Products) (The Netherlands)
Vitablend Nederland B.V. (The Netherlands)
Vitae Naturals (Vitae Caps, S.A.) (Spain)
7.4 Country-wise Analysis of European Natural Vitamin E Market
7.4.1 Germany
7.4.1.1 Germany Natural Vitamin E Tocopherols Market Overview by End-use Application
7.4.2 France
7.4.2.1 France Natural Vitamin E Tocopherols Market Overview by End-use Application
7.4.3 The Netherlands
7.4.3.1 Netherlands Natural Vitamin E Tocopherols Market Overview by End-use Application
7.4.4 Spain
7.4.4.1 Spain Natural Vitamin E Tocopherols Market Overview by End-use Application
7.4.5 Italy
7.4.5.1 Italy Natural Vitamin E Tocopherols Market Overview by End-use Application
7.4.6 The United Kingdom
7.4.6.1 United Kingdom Natural Vitamin E Tocopherols Market Overview by End-use Application
7.4.7 Rest of Europe
7.4.7.1 Rest of Europe Natural Vitamin E Tocopherols Market Overview by End-use Application
8. ASIA-PACIFIC
8.1 Asia-Pacific Natural Vitamin E Market Overview by End-use Application
8.2 Asia-Pacific Natural Vitamin E Market Overview by Geographic Region
8.3 Asia-Pacific Natural Vitamin E Market Overview by Type
8.3.1 Natural Vitamin E – Tocopherols
8.3.1.1 Asia-Pacific Natural Vitamin E Tocopherols Market Overview by End-use Application
8.3.1.2 Asia-Pacific Natural Vitamin E Tocopherols Market Overview by Geographic Region
8.3.2 Natural Vitamin E – Tocotrienols
8.3.2.1 Asia-Pacific Natural Vitamin E Tocotrienols Market Overview by End-use Application
8.3.2.2 Asia-Pacific Natural Vitamin E Tocotrienols Market Overview by Geographic Region
8.4 Major Market Players
Beijing Gingko Group (China)
Carotino Sdn. Bhd. (Malaysia)
COFCO Tech Bioengineering (Tianjin) Co., Ltd. (China)
ECA Healthcare Inc.
ExcelVite Sdn. Bhd. (Malaysia)
Fairchem Organics Limited (India)
Fenchem Biotek Ltd. (China)
Fujian Glanny Bio-Engineering Co., Ltd. (China)
Jiangsu Conat Biological Products Co., Ltd. (China)
Jiangsu Xixin Vitamin Co., Ltd. (China)
Jiangsu Yuehong Bio-Tec Co., Ltd. (China)
Jiangxi Aturex Co., Ltd. (China)
KLK Oleo (Davos Life Science) (Singapore)
Matrix Fine Sciences Pvt. Ltd. (India)
Mitsubishi-Chemical Foods Corporation (Japan)
Musim Mas Group (Singapore)
Ningbo Dahongying Bio-Engineering Co., Ltd. (China)
Oryza Oil & Fat Chemical Co., Ltd. (Japan)
Riken Vitamin Co., Ltd. (Japan)
Shandong New Element Biotechnology Co., Ltd. (China)
Sime Darby Oils Nutrition (Malaysia)
SOP Nutraceuticals Sdn. Bhd. (Malaysia)
Supervitamins Sdn. Bhd. (Malaysia)
Tama Biochemical Co., Ltd. (Japan)
Vance Group Ltd. (Singapore)
Vita-Solar Biotechnology Co., Ltd. (China)
Wilmar Nutrition (Jiangsu) Co., Ltd. (China)
Xi'an Healthful Biotechnology Co., Ltd. (HSF) (China)
Zhejiang Medicine Co., Ltd. (China)
Zhejiang Worldbestve Biotechnology Co., Ltd. (China)
8.5 Country-wise Analysis of Asia-Pacific Natural Vitamin E Market
8.5.1 China
8.5.1.1 China Natural Vitamin E Market Overview by End-use Application
8.5.1.1.1 China Natural Vitamin E Tocopherols Market Overview by End-use Application
8.5.1.1.2 China Natural Vitamin E Tocotrienols Market Overview by End-use Application
8.5.2 India
8.5.2.1 India Natural Vitamin E Market Overview by End-use Application
8.5.2.1.1 India Natural Vitamin E Tocopherols Market Overview by End-use Application
8.5.2.1.2 India Natural Vitamin E Tocotrienols Market Overview by End-use Application
8.5.3 Japan
8.5.3.1 Japan Natural Vitamin E Market Overview by End-use Application
8.5.3.1.1 Japan Natural Vitamin E Tocopherols Market Overview by End-use Application
8.5.3.1.2 Japan Natural Vitamin E Tocotrienols Market Overview by End-use Application
8.5.4 Rest of Asia-Pacific
8.5.4.1 Rest of Asia-Pacific Natural Vitamin E Market Overview by End-use Application
8.5.4.1.1 Rest of Asia-Pacific Natural Vitamin E Tocopherols Market Overview by End-use Application
8.5.4.1.2 Rest of Asia-Pacific Natural Vitamin E Tocotrienols Market Overview by End-use Application
9. SOUTH AMERICA
9.1 South American Natural Vitamin E Tocopherols Market Overview by End-use Application
9.2 South American Natural Vitamin E Tocopherols Market Overview by Geographic Region
9.3 Major Market Player
Advanced Organic Materials S.A. (Argentina)
9.4 Country-wise Analysis of South American Natural Vitamin E Market
9.4.1 Brazil
9.4.1.1 Brazil Natural Vitamin E Tocopherols Market Overview by End-use Application
9.4.2 Argentina
9.4.2.1 Argentina Natural Vitamin E Tocopherols Market Overview by End-use Application
9.4.3 Rest of South America
9.4.3.1 Rest of South America Natural Vitamin E Tocopherols Market Overview by End-use Application
10. REST OF WORLD
10.1 Rest of World Natural Vitamin E Market Overview by End-use Application
10.2 Rest of World Natural Vitamin E Market Overview by Type
10.2.1 Natural Vitamin E – Tocopherols
10.2.1.1 Rest of World Natural Vitamin E Tocopherols Market Overview by End-use Application
10.2.2 Natural Vitamin E – Tocotrienols
10.2.2.1 Rest of World Natural Vitamin E Tocotrienols Market Overview by End-use Application
PART C: GUIDE TO THE INDUSTRY
1. Major Manufacturers and Suppliers of Vitamin E
Manufacturers of Natural Vitamin E Tocopherols
Manufacturers of Natural Vitamin E Tocotrienols
Vitamins and Other Ingredients Distributors
2. Major Companies in the End-use Application Industries for Vitamin E
Nutritional Supplements Companies
Direct Selling Companies - Supplements and Personal Care
Contract Manufacturers – Supplements
Animal Feed/Nutrition Companies
Vitamins and Other Ingredients Distributors and Formulators
PART D: ANNEXURE
1. RESEARCH METHODOLOGY
2. FEEDBACK
Charts & Graphs
PART A: GLOBAL MARKET PERSPECTIVE
Chart 1: Global Natural Vitamin E Market (2019, 2020 & 2026)
Chart 2: Global Natural Vitamin E Market (2019, 2020 & 2026) by End-use Application
Chart 3: Global Natural Vitamin E Market (2019, 2020 & 2026) by Product Type
Chart 4: Global Natural Vitamin E Market (2019, 2020 & 2026) by Geographic Region
Chart 5: Global Vitamin E Market Analysis (2019, 2020 and 2026) by Category - Synthetic Vitamin E and Natural Vitamin E (Volume in Metric Tons and Value in USD Million)
Chart 6: Glance at 2019, 2020 and 2026 Global Vitamin E Volume & Value Market Share by Category - Synthetic Vitamin E and Natural Vitamin E
Chart 7: 2020 Global Vitamin E Capacity by Vitamin E Type
Chart 8: 2020 Global Natural Vitamin E Tocopherols Capacity by Manufacturer in Metric Tons
Chart 9: 2020 Global Natural Vitamin E Tocotrienols Capacity by Major Players in Metric Tons
Chart 10: Global Natural Vitamin E Market Analysis (2017-2026) by Volume in Metric Tons and Value in USD Million
Chart 11: Global Natural Vitamin E Market Analysis (2017-2026) by End-use Application - Animal Feed, Dietary Supplements, Food & Beverages, Cosmetics & Personal Care and Others in Metric Tons
Chart 12: Glance at 2017, 2020 and 2026 Global Natural Vitamin E Volume Market Share by End-use Application - Animal Feed, Dietary Supplements, Food & Beverages, Cosmetics & Personal Care and Others
Chart 13: Global Natural Vitamin E Market Analysis (2017-2026) by End-use Application - Animal Feed, Dietary Supplements, Food & Beverages, Cosmetics & Personal Care and Others in USD Million
Chart 14: Glance at 2017, 2020 and 2026 Global Natural Vitamin E Value Market Share by End-use Application - Animal Feed, Dietary Supplements, Food & Beverages, Cosmetics & Personal Care and Others
Chart 15: Global Natural Vitamin E Market Analysis (2017-2026) by Type - Tocopherols and Tocotrienols in Metric Tons
Chart 16: Glance at 2017, 2020 and 2026 Global Natural Vitamin E Volume Market Share by Type - Tocopherols and Tocotrienols
Chart 17: Global Natural Vitamin E Market Analysis (2017-2026) by Type - Tocopherols and Tocotrienols in USD Million
Chart 18: Glance at 2017, 2020 and 2026 Global Natural Vitamin E Value Market Share by Type - Tocopherols and Tocotrienols
Chart 19: Global Natural Vitamin E Tocopherols Market Analysis (2017-2026) by Volume in Metric Tons and Value in USD Million
Chart 20: Global Natural Vitamin E Tocopherols Market Analysis (2017-2026) by End-use Application - Animal Feed, Dietary Supplements, Food & Beverages, Cosmetics & Personal Care and Others in Metric Tons
Chart 21: Glance at 2017, 2020 and 2026 Global Natural Vitamin E Tocopherols Volume Market Share by End-use Application - Animal Feed, Dietary Supplements, Food & Beverages, Cosmetics & Personal Care and Others
Chart 22: Global Natural Vitamin E Tocopherols Market Analysis (2017-2026) by End-use Application - Animal Feed, Dietary Supplements, Food & Beverages, Cosmetics & Personal Care and Others in USD Million
Chart 23: Glance at 2017, 2020 and 2026 Global Natural Vitamin E Tocopherols Value Market Share by End-use Application - Animal Feed, Dietary Supplements, Food & Beverages, Cosmetics & Personal Care and Others
Chart 24: Global Natural Vitamin E Tocotrienols Market Analysis (2017-2026) by Volume in Metric Tons and Value in USD Million
Chart 25: Global Natural Vitamin E Tocotrienols Market Analysis (2017-2026) by End-use Application - Dietary Supplements, Food & Beverages and Cosmetics & Personal Care in Metric Tons
Chart 26: Glance at 2017, 2020 and 2026 Global Natural Vitamin E Tocotrienols Volume Market Share by End-use Application - Dietary Supplements, Food & Beverages and Cosmetics & Personal Care
Chart 27: Global Natural Vitamin E Tocotrienols Market Analysis (2017-2026) by End-use Application - Dietary Supplements, Food & Beverages and Cosmetics & Personal Care in USD Million
Chart 28: Glance at 2017, 2020 and 2026 Global Natural Vitamin E Tocotrienols Value Market Share by End-use Application - Dietary Supplements, Food & Beverages and Cosmetics & Personal Care
PART B: REGIONAL MARKET PERSPECTIVE
Chart 29: Global Natural Vitamin E Market Analysis (2017-2026) by Geographic Region- North America, Europe, Asia-Pacific, South America and Rest of World in Metric Tons
Chart 30: Glance at 2017, 2020 and 2026 Global Natural Vitamin E Volume Market Share by Geographic Region - North America, Europe, Asia-Pacific, South America and Rest of World
Chart 31: Global Natural Vitamin E Market Analysis (2017-2026) by Geographic Region - North America, Europe, Asia-Pacific, South America and Rest of World in USD Million
Chart 32: Glance at 2017, 2020 and 2026 Global Natural Vitamin E Value Market Share by Geographic Region - North America, Europe, Asia-Pacific, South America and Rest of World
Chart 33: Global Natural Vitamin E Tocopherols Market Analysis (2017-2026) by Geographic Region- North America, Europe, Asia-Pacific, South America and Rest of World in Metric Tons
Chart 34: Glance at 2017, 2020 and 2026 Global Natural Vitamin E Tocopherols Volume Market Share by Geographic Region - North America, Europe, Asia-Pacific, South America and Rest of World
Chart 35: Global Natural Vitamin E Tocopherols Market Analysis (2017-2026) by Geographic Region - North America, Europe, Asia-Pacific, South America and Rest of World in USD Million
Chart 36: Glance at 2017, 2020 and 2026 Global Natural Vitamin E Tocopherols Value Market Share by Geographic Region - North America, Europe, Asia-Pacific, South America and Rest of World
Chart 37: Global Natural Vitamin E Tocotrienols Market Analysis (2017-2026) by Geographic Region- North America, Europe, Asia-Pacific and Rest of World in Metric Tons
Chart 38: Glance at 2017, 2020 and 2026 Global Natural Vitamin E Tocotrienols Volume Market Share by Geographic Region - North America, Europe, Asia-Pacific and Rest of World
Chart 39: Global Natural Vitamin E Tocotrienols Market Analysis (2017-2026) by Geographic Region - North America, Europe, Asia-Pacific and Rest of World in USD Million
Chart 40: Glance at 2017, 2020 and 2026 Global Natural Vitamin E Tocotrienols Value Market Share by Geographic Region - North America, Europe, Asia-Pacific and Rest of World
REGIONAL MARKET OVERVIEW
NORTH AMERICA
Chart 41: North American Natural Vitamin E Market Analysis (2017-2026) by Volume in Metric Tons and Value in USD Million
Chart 42: North American Natural Vitamin E Market Analysis (2017-2026) by End-use Application - Animal Feed, Dietary Supplements, Food & Beverages, Cosmetics & Personal Care and Others in Metric Tons
Chart 43: Glance at 2017, 2020 and 2026 North American Natural Vitamin E Volume Market Share by End-use Application - Animal Feed, Dietary Supplements, Food & Beverages, Cosmetics & Personal Care and Others
Chart 44: North American Natural Vitamin E Market Analysis (2017-2026) by End-use Application - Animal Feed, Dietary Supplements, Food & Beverages, Cosmetics & Personal Care and Others in USD Million
Chart 45: Glance at 2017, 2020 and 2026 North American Natural Vitamin E Value Market Share by End-use Application - Animal Feed, Dietary Supplements, Food & Beverages, Cosmetics & Personal Care and Others
Chart 46: North American Natural Vitamin E Market Analysis (2017-2026) by Geographic Region - United States, Mexico and Canada in Metric Tons
Chart 47: Glance at 2017, 2020 and 2026 North American Natural Vitamin E Volume Market Share by Geographic Region - United States, Mexico and Canada
Chart 48: North American Natural Vitamin E Market Analysis (2017-2026) by Geographic Region - United States, Mexico and Canada in USD Million
Chart 49: Glance at 2017, 2020 and 2026 North American Natural Vitamin E Value Market Share by Geographic Region - United States, Mexico and Canada
Chart 50: North American Natural Vitamin E Market Analysis (2017-2026) by Type - Tocopherols and Tocotrienols in Metric Tons
Chart 51: Glance at 2017, 2020 and 2026 North American Natural Vitamin E Volume Market Share by Type - Tocopherols and Tocotrienols
Chart 52: North American Natural Vitamin E Market Analysis (2017-2026) by Type - Tocopherols and Tocotrienols in USD Million
Chart 53: Glance at 2017, 2020 and 2026 North American Natural Vitamin E Value Market Share by Type - Tocopherols and Tocotrienols
Chart 54: North American Natural Vitamin E Tocopherols Market Analysis (2017-2026) by Volume in Metric Tons and Value in USD Million
Chart 55: North American Natural Vitamin E Tocopherols Market Analysis (2017-2026) by End-use Application - Animal Feed, Dietary Supplements, Food & Beverages, Cosmetics & Personal Care and Others in Metric Tons
Chart 56: Glance at 2017, 2020 and 2026 North American Natural Vitamin E Tocopherols Volume Market Share by End-use Application - Animal Feed, Dietary Supplements, Food & Beverages, Cosmetics & Personal Care and Others
Chart 57: North American Natural Vitamin E Tocopherols Market Analysis (2017-2026) by End-use Application - Animal Feed, Dietary Supplements, Food & Beverages, Cosmetics & Personal Care and Others in USD Million
Chart 58: Glance at 2017, 2020 and 2026 North American Natural Vitamin E Tocopherols Value Market Share by End-use Application - Animal Feed, Dietary Supplements, Food & Beverages, Cosmetics & Personal Care and Others
Chart 59: North American Natural Vitamin E Tocopherols Market Analysis (2017-2026) by Geographic Region - United States, Mexico and Canada in Metric Tons
Chart 60: Glance at 2017, 2020 and 2026 North American Natural Vitamin E Tocopherols Volume Market Share by Geographic Region - United States, Mexico and Canada
Chart 61: North American Natural Vitamin E Tocopherols Market Analysis (2017-2026) by Geographic Region - United States, Mexico and Canada in USD Million
Chart 62: Glance at 2017, 2020 and 2026 North American Natural Vitamin E Tocopherols Value Market Share by Geographic Region - United States, Mexico and Canada
Chart 63: North American Natural Vitamin E Tocotrienols Market Analysis (2017-2026) by Volume in Metric Tons and Value in USD Million
Chart 64: North American Natural Vitamin E Tocotrienols Market Analysis (2017-2026) by End-use Application - Dietary Supplements, Food & Beverages and Cosmetics & Personal Care in Metric Tons
Chart 65: Glance at 2017, 2020 and 2026 North American Natural Vitamin E Tocotrienols Volume Market Share by End-use Application - Dietary Supplements, Food & Beverages and Cosmetics & Personal Care
Chart 66: North American Natural Vitamin E Tocotrienols Market Analysis (2017-2026) by End-use Application - Dietary Supplements, Food & Beverages and Cosmetics & Personal Care in USD Million
Chart 67: Glance at 2017, 2020 and 2026 North American Natural Vitamin E Tocotrienols Value Market Share by End-use Application - Dietary Supplements, Food & Beverages and Cosmetics & Personal Care
Chart 68: North American Natural Vitamin E Tocotrienols Market Analysis (2017-2026) by Geographic Region - United States, Mexico and Canada in Metric Tons
Chart 69: Glance at 2017, 2020 and 2026 North American Natural Vitamin E Tocotrienols Volume Market Share by Geographic Region - United States, Mexico and Canada
Chart 70: North American Natural Vitamin E Tocotrienols Market Analysis (2017-2026) by Geographic Region - United States, Mexico and Canada in USD Million
Chart 71: Glance at 2017, 2020 and 2026 North American Natural Vitamin E Tocotrienols Value Market Share by Geographic Region - United States, Mexico and Canada
The United States
Chart 72: United States Natural Vitamin E Market Analysis (2017-2026) by End-use Application - Animal Feed, Dietary Supplements, Food & Beverages, Cosmetics & Personal Care and Others in Metric Tons
Chart 73: Glance at 2017, 2020 and 2026 United States Natural Vitamin E Volume Market Share by End-use Application - Animal Feed, Dietary Supplements, Food & Beverages, Cosmetics & Personal Care and Others
Chart 74: United States Natural Vitamin E Market Analysis (2017-2026) by End-use Application - Animal Feed, Dietary Supplements, Food & Beverages, Cosmetics & Personal Care and Others in USD Million
Chart 75: Glance at 2017, 2020 and 2026 United States Natural Vitamin E Value Market Share by End-use Application - Animal Feed, Dietary Supplements, Food & Beverages, Cosmetics & Personal Care and Others
Chart 76: United States Natural Vitamin E Tocopherols Market Analysis (2017-2026) by End-use Application - Animal Feed, Dietary Supplements, Food & Beverages, Cosmetics & Personal Care and Others in Metric Tons
Chart 77: Glance at 2017, 2020 and 2026 United States Natural Vitamin E Tocopherols Volume Market Share by End-use Application - Animal Feed, Dietary Supplements, Food & Beverages, Cosmetics & Personal Care and Others
Chart 78: United States Natural Vitamin E Tocopherols Market Analysis (2017-2026) by End-use Application - Animal Feed, Dietary Supplements, Food & Beverages, Cosmetics & Personal Care and Others in USD Million
Chart 79: Glance at 2017, 2020 and 2026 United States Natural Vitamin E Tocopherols Value Market Share by End-use Application - Animal Feed, Dietary Supplements, Food & Beverages, Cosmetics & Personal Care and Others
Chart 80: United States Natural Vitamin E Tocotrienols Market Analysis (2017-2026) by End-use Application - Dietary Supplements, Food & Beverages and Cosmetics & Personal Care in Metric Tons
Chart 81: Glance at 2017, 2020 and 2026 United States Natural Vitamin E Tocotrienols Volume Market Share by End-use Application - Dietary Supplements, Food & Beverages and Cosmetics & Personal Care
Chart 82: United States Natural Vitamin E Tocotrienols Market Analysis (2017-2026) by End-use Application - Dietary Supplements, Food & Beverages and Cosmetics & Personal Care in USD Million
Chart 83: Glance at 2017, 2020 and 2026 United States Natural Vitamin E Tocotrienols Value Market Share by End-use Application - Dietary Supplements, Food & Beverages and Cosmetics & Personal Care
Mexico
Chart 84: Mexico Natural Vitamin E Market Analysis (2017-2026) by End-use Application - Animal Feed, Dietary Supplements, Food & Beverages, Cosmetics & Personal Care and Others in Metric Tons
Chart 85: Glance at 2017, 2020 and 2026 Mexican Natural Vitamin E Volume Market Share by End-use Application - Animal Feed, Dietary Supplements, Food & Beverages, Cosmetics & Personal Care and Others
Chart 86: Mexico Natural Vitamin E Market Analysis (2017-2026) by End-use Application - Animal Feed, Dietary Supplements, Food & Beverages, Cosmetics & Personal Care and Others in USD Million
Chart 87: Glance at 2017, 2020 and 2026 Mexican Natural Vitamin E Value Market Share by End-use Application - Animal Feed, Dietary Supplements, Food & Beverages, Cosmetics & Personal Care and Others
Chart 88: Mexico Natural Vitamin E Tocopherols Market Analysis (2017-2026) by End-use Application - Animal Feed, Dietary Supplements, Food & Beverages, Cosmetics & Personal Care and Others in Metric Tons
Chart 89: Glance at 2017, 2020 and 2026 Mexican Natural Vitamin E Tocopherols Volume Market Share by End-use Application - Animal Feed, Dietary Supplements, Food & Beverages, Cosmetics & Personal Care and Others
Chart 90: Mexico Natural Vitamin E Tocopherols Market Analysis (2017-2026) by End-use Application - Animal Feed, Dietary Supplements, Food & Beverages, Cosmetics & Personal Care and Others in USD Million
Chart 91: Glance at 2017, 2020 and 2026 Mexican Natural Vitamin E Tocopherols Value Market Share by End-use Application - Animal Feed, Dietary Supplements, Food & Beverages, Cosmetics & Personal Care and Others
Chart 92: Mexico Natural Vitamin E Tocotrienols Market Analysis (2017-2026) by End-use Application - Dietary Supplements and Others in Metric Tons
Chart 93: Glance at 2017, 2020 and 2026 Mexican Natural Vitamin E Tocotrienols Volume Market Share by End-use Application - Dietary Supplements and Others
Chart 94: Mexico Natural Vitamin E Tocotrienols Market Analysis (2017-2026) by End-use Application - Dietary Supplements and Others in USD Million
Chart 95: Glance at 2017, 2020 and 2026 Mexican Natural Vitamin E Tocotrienols Value Market Share by End-use Application - Dietary Supplements and Others
Canada
Chart 96: Canada Natural Vitamin E Market Analysis (2017-2026) by End-use Application - Animal Feed, Dietary Supplements, Food & Beverages, Cosmetics & Personal Care and Others in Metric Tons
Chart 97: Glance at 2017, 2020 and 2026 Canada Natural Vitamin E Volume Market Share by End-use Application - Animal Feed, Dietary Supplements, Food & Beverages, Cosmetics & Personal Care and Others
Chart 98: Canada Natural Vitamin E Market Analysis (2017-2026) by End-use Application - Animal Feed, Dietary Supplements, Food & Beverages, Cosmetics & Personal Care and Others in USD Million
Chart 99: Glance at 2017, 2020 and 2026 Canada Natural Vitamin E Value Market Share by End-use Application - Animal Feed, Dietary Supplements, Food & Beverages, Cosmetics & Personal Care and Others
Chart 100: Canada Natural Vitamin E Tocopherols Market Analysis (2017-2026) by End-use Application - Animal Feed, Dietary Supplements, Food & Beverages, Cosmetics & Personal Care and Others in Metric Tons
Chart 101: Glance at 2017, 2020 and 2026 Canada Natural Vitamin E Tocopherols Volume Market Share by End-use Application - Animal Feed, Dietary Supplements, Food & Beverages, Cosmetics & Personal Care and Others
Chart 102: Canada Natural Vitamin E Tocopherols Market Analysis (2017-2026) by End-use Application - Animal Feed, Dietary Supplements, Food & Beverages, Cosmetics & Personal Care and Others in USD Million
Chart 103: Glance at 2017, 2020 and 2026 Canada Natural Vitamin E Tocopherols Value Market Share by End-use Application - Animal Feed, Dietary Supplements, Food & Beverages, Cosmetics & Personal Care and Others
Chart 104: Canada Natural Vitamin E Tocotrienols Market Analysis (2017-2026) by End-use Application - Dietary Supplements, Food & Beverages and Cosmetics & Personal Care in Metric Tons
Chart 105: Glance at 2017, 2020 and 2026 Canada Natural Vitamin E Tocotrienols Volume Market Share by End-use Application - Dietary Supplements, Food & Beverages and Cosmetics & Personal Care
Chart 106: Canada Natural Vitamin E Tocotrienols Market Analysis (2017-2026) by End-use Application - Dietary Supplements, Food & Beverages and Cosmetics & Personal Care in USD Million
Chart 107: Glance at 2017, 2020 and 2026 Canada Natural Vitamin E Tocotrienols Value Market Share by End-use Application - Dietary Supplements, Food & Beverages and Cosmetics & Personal Care
EUROPE
Chart 108: European Natural Vitamin E Market Analysis (2017-2026) by Volume in Metric Tons and Value in USD Million
Chart 109: European Natural Vitamin E Market Analysis (2017-2026) by End-use Application - Animal Feed, Dietary Supplements, Food & Beverages, Cosmetics & Personal Care and Others in Metric Tons
Chart 110: Glance at 2017, 2020 and 2026 European Natural Vitamin E Volume Market Share by End-use Application - Animal Feed, Dietary Supplements, Food & Beverages, Cosmetics & Personal Care and Others
Chart 111: European Natural Vitamin E Market Analysis (2017-2026) by End-use Application - Animal Feed, Dietary Supplements, Food & Beverages, Cosmetics & Personal Care and Others in USD Million
Chart 112: Glance at 2017, 2020 and 2026 European Natural Vitamin E Value Market Share by End-use Application - Animal Feed, Dietary Supplements, Food & Beverages, Cosmetics & Personal Care and Others
Chart 113: European Natural Vitamin E Market Analysis (2017-2026) by Type - Tocopherols and Tocotrienols in Metric Tons
Chart 114: Glance at 2017, 2020 and 2026 European Natural Vitamin E Volume Market Share by Type - Tocopherols and Tocotrienols
Chart 115: European Natural Vitamin E Market Analysis (2017-2026) by Type - Tocopherols and Tocotrienols in USD Million
Chart 116: Glance at 2017, 2020 and 2026 European Natural Vitamin E Value Market Share by Type - Tocopherols and Tocotrienols
Chart 117: European Natural Vitamin E Tocopherols Market Analysis (2017-2026) by Volume in Metric Tons and Value in USD Million
Chart 118: European Natural Vitamin E Tocopherols Market Analysis (2017-2026) by End-use Application - Animal Feed, Dietary Supplements, Food & Beverages, Cosmetics & Personal Care and Others in Metric Tons
Chart 119: Glance at 2017, 2020 and 2026 European Natural Vitamin E Tocopherols Volume Market Share by End-use Application - Animal Feed, Dietary Supplements, Food & Beverages, Cosmetics & Personal Care and Others
Chart 120: European Natural Vitamin E Tocopherols Market Analysis (2017-2026) by End-use Application - Animal Feed, Dietary Supplements, Food & Beverages, Cosmetics & Personal Care and Others in USD Million
Chart 121: Glance at 2017, 2020 and 2026 European Natural Vitamin E Tocopherols Value Market Share by End-use Application - Animal Feed, Dietary Supplements, Food & Beverages, Cosmetics & Personal Care and Others
Chart 122: European Natural Vitamin E Tocopherols Market Analysis (2017-2026) by Geographic Region - Germany, France, Netherlands, Spain, Italy, UK and Rest of Europe in Metric Tons
Chart 123: Glance at 2017, 2020 and 2026 European Natural Vitamin E Tocopherols Volume Market Share by Geographic Region - Germany, France, Netherlands, Spain, Italy, UK and Rest of Europe
Chart 124: European Natural Vitamin E Tocopherols Market Analysis (2017-2026) by Geographic Region - Germany, France, Netherlands, Spain, Italy, UK and Rest of Europe in USD Million
Chart 125: Glance at 2017, 2020 and 2026 European Natural Vitamin E Tocopherols Value Market Share by Geographic Region - Germany, France, Netherlands, Spain, Italy, UK and Rest of Europe
Chart 126: European Natural Vitamin E Tocotrienols Market Analysis (2017-2026) by Volume in Metric Tons and Value in USD Million
Chart 127: European Natural Vitamin E Tocotrienols Market Analysis (2017-2026) by End-use Application - Dietary Supplements and Cosmetics & Personal Care in Metric Tons
Chart 128: Glance at 2017, 2020 and 2026 European Natural Vitamin E Tocotrienols Volume Market Share by End-use Application - Dietary Supplements and Cosmetics & Personal Care
Chart 129: European Natural Vitamin E Tocotrienols Market Analysis (2017-2026) by End-use Application - Dietary Supplements and Cosmetics & Personal Care in USD Million
Chart 130: Glance at 2017, 2020 and 2026 European Natural Vitamin E Tocotrienols Value Market Share by End-use Application - Dietary Supplements and Cosmetics & Personal Care
Germany
Chart 131: Germany Natural Vitamin E Tocopherols Market Analysis (2017-2026) by End-use Application - Animal Feed, Dietary Supplements, Food & Beverages, Cosmetics & Personal Care and Others in Metric Tons
Chart 132: Glance at 2017, 2020 and 2026 Germany Natural Vitamin E Tocopherols Volume Market Share by End-use Application - Animal Feed, Dietary Supplements, Food & Beverages, Cosmetics & Personal Care and Others
Chart 133: Germany Natural Vitamin E Tocopherols Market Analysis (2017-2026) by End-use Application - Animal Feed, Dietary Supplements, Food & Beverages, Cosmetics & Personal Care and Others in USD Million
Chart 134: Glance at 2017, 2020 and 2026 Germany Natural Vitamin E Tocopherols Value Market Share by End-use Application - Animal Feed, Dietary Supplements, Food & Beverages, Cosmetics & Personal Care and Others
France
Chart 135: France Natural Vitamin E Tocopherols Market Analysis (2017-2026) by End-use Application - Animal Feed, Dietary Supplements, Food & Beverages, Cosmetics & Personal Care and Others in Metric Tons
Chart 136: Glance at 2017, 2020 and 2026 France Natural Vitamin E Tocopherols Volume Market Share by End-use Application - Animal Feed, Dietary Supplements, Food & Beverages, Cosmetics & Personal Care and Others
Chart 137: France Natural Vitamin E Tocopherols Market Analysis (2017-2026) by End-use Application - Animal Feed, Dietary Supplements, Food & Beverages, Cosmetics & Personal Care and Others in USD Million
Chart 138: Glance at 2017, 2020 and 2026 France Natural Vitamin E Tocopherols Value Market Share by End-use Application - Animal Feed, Dietary Supplements, Food & Beverages, Cosmetics & Personal Care and Others
The Netherlands
Chart 139: Netherlands Natural Vitamin E Tocopherols Market Analysis (2017-2026) by End-use Application - Animal Feed, Dietary Supplements, Food & Beverages, Cosmetics & Personal Care and Others in Metric Tons
Chart 140: Glance at 2017, 2020 and 2026 Netherlands Natural Vitamin E Tocopherols Volume Market Share by End-use Application - Animal Feed, Dietary Supplements, Food & Beverages, Cosmetics & Personal Care and Others
Chart 141: Netherlands Natural Vitamin E Tocopherols Market Analysis (2017-2026) by End-use Application - Animal Feed, Dietary Supplements, Food & Beverages, Cosmetics & Personal Care and Others in USD Million
Chart 142: Glance at 2017, 2020 and 2026 Netherlands Natural Vitamin E Tocopherols Value Market Share by End-use Application - Animal Feed, Dietary Supplements, Food & Beverages, Cosmetics & Personal Care and Others
Spain
Chart 143: Spain Natural Vitamin E Tocopherols Market Analysis (2017-2026) by End-use Application - Animal Feed, Dietary Supplements, Food & Beverages, Cosmetics & Personal Care and Others in Metric Tons
Chart 144: Glance at 2017, 2020 and 2026 Spain Natural Vitamin E Tocopherols Volume Market Share by End-use Application - Animal Feed, Dietary Supplements, Food & Beverages, Cosmetics & Personal Care and Others
Chart 145: Spain Natural Vitamin E Tocopherols Market Analysis (2017-2026) by End-use Application - Animal Feed, Dietary Supplements, Food & Beverages, Cosmetics & Personal Care and Others in USD Million
Chart 146: Glance at 2017, 2020 and 2026 Spain Natural Vitamin E Tocopherols Value Market Share by End-use Application - Animal Feed, Dietary Supplements, Food & Beverages, Cosmetics & Personal Care and Others
Italy
Chart 147: Italy Natural Vitamin E Tocopherols Market Analysis (2017-2026) by End-use Application - Animal Feed, Dietary Supplements, Food & Beverages, Cosmetics & Personal Care and Others in Metric Tons
Chart 148: Glance at 2017, 2020 and 2026 Italy Natural Vitamin E Tocopherols Volume Market Share by End-use Application - Animal Feed, Dietary Supplements, Food & Beverages, Cosmetics & Personal Care and Others
Chart 149: Italy Natural Vitamin E Tocopherols Market Analysis (2017-2026) by End-use Application - Animal Feed, Dietary Supplements, Food & Beverages, Cosmetics & Personal Care and Others in USD Million
Chart 150: Glance at 2017, 2020 and 2026 Italy Natural Vitamin E Tocopherols Value Market Share by End-use Application - Animal Feed, Dietary Supplements, Food & Beverages, Cosmetics & Personal Care and Others
The United Kingdom
Chart 151: United Kingdom Natural Vitamin E Tocopherols Market Analysis (2017-2026) by End-use Application - Animal Feed, Dietary Supplements, Food & Beverages, Cosmetics & Personal Care and Others in Metric Tons
Chart 152: Glance at 2017, 2020 and 2026 United Kingdom Natural Vitamin E Tocopherols Volume Market Share by End-use Application - Animal Feed, Dietary Supplements, Food & Beverages, Cosmetics & Personal Care and Others
Chart 153: United Kingdom Natural Vitamin E Tocopherols Market Analysis (2017-2026) by End-use Application - Animal Feed, Dietary Supplements, Food & Beverages, Cosmetics & Personal Care and Others in USD Million
Chart 154: Glance at 2017, 2020 and 2026 United Kingdom Natural Vitamin E Tocopherols Value Market Share by End-use Application - Animal Feed, Dietary Supplements, Food & Beverages, Cosmetics & Personal Care and Others
Rest of Europe
Chart 155: Rest of Europe Natural Vitamin E Tocopherols Market Analysis (2017-2026) by End-use Application - Animal Feed, Dietary Supplements, Food & Beverages, Cosmetics & Personal Care and Others in Metric Tons
Chart 156: Glance at 2017, 2020 and 2026 Rest of Europe Natural Vitamin E Tocopherols Volume Market Share by End-use Application - Animal Feed, Dietary Supplements, Food & Beverages, Cosmetics & Personal Care and Others
Chart 157: Rest of Europe Natural Vitamin E Tocopherols Market Analysis (2017-2026) by End-use Application - Animal Feed, Dietary Supplements, Food & Beverages, Cosmetics & Personal Care and Others in USD Million
Chart 158: Glance at 2017, 2020 and 2026 Rest of Europe Natural Vitamin E Tocopherols Value Market Share by End-use Application - Animal Feed, Dietary Supplements, Food & Beverages, Cosmetics & Personal Care and Others
ASIA-PACIFIC
Chart 159: Asia-Pacific Natural Vitamin E Market Analysis (2017-2026) by Volume in Metric Tons and Value in USD Million
Chart 160: Asia-Pacific Natural Vitamin E Market Analysis (2017-2026) by End-use Application - Animal Feed, Dietary Supplements, Food & Beverages, Cosmetics & Personal Care and Others in Metric Tons
Chart 161: Glance at 2017, 2020 and 2026 Asia-Pacific Natural Vitamin E Volume Market Share by End-use Application - Animal Feed, Dietary Supplements, Food & Beverages, Cosmetics & Personal Care and Others
Chart 162: Asia-Pacific Natural Vitamin E Market Analysis (2017-2026) by End-use Application - Animal Feed, Dietary Supplements, Food & Beverages, Cosmetics & Personal Care and Others in USD Million
Chart 163: Glance at 2017, 2020 and 2026 Asia-Pacific Natural Vitamin E Value Market Share by End-use Application - Animal Feed, Dietary Supplements, Food & Beverages, Cosmetics & Personal Care and Others
Chart 164: Asia-Pacific Natural Vitamin E Market Analysis (2017-2026) by Geographic Region - China, India, Japan and Rest of APAC in Metric Tons
Chart 165: Glance at 2017, 2020 and 2026 Asia-Pacific Natural Vitamin E Volume Market Share by Geographic Region - China, India, Japan and Rest of APAC
Chart 166: Asia-Pacific Natural Vitamin E Market Analysis (2017-2026) by Geographic Region - China, India, Japan and Rest of APAC in USD Million
Chart 167: Glance at 2017, 2020 and 2026 Asia-Pacific Natural Vitamin E Value Market Share by Geographic Region - China, India, Japan and Rest of APAC
Chart 168: Asia-Pacific Natural Vitamin E Market Analysis (2017-2026) by Type - Tocopherols and Tocotrienols in Metric Tons
Chart 169: Glance at 2017, 2020 and 2026 Asia-Pacific Natural Vitamin E Volume Market Share by Type - Tocopherols and Tocotrienols
Chart 170: Asia-Pacific Natural Vitamin E Market Analysis (2017-2026) by Type - Tocopherols and Tocotrienols in USD Million
Chart 171: Glance at 2017, 2020 and 2026 Asia-Pacific Natural Vitamin E Value Market Share by Type - Tocopherols and Tocotrienols
Chart 172: Asia-Pacific Natural Vitamin E Tocopherols Market Analysis (2017-2026) by Volume in Metric Tons and Value in USD Million
Chart 173: Asia-Pacific Natural Vitamin E Tocopherols Market Analysis (2017-2026) by End-use Application - Animal Feed, Dietary Supplements, Food & Beverages, Cosmetics & Personal Care and Others in Metric Tons
Chart 174: Glance at 2017, 2020 and 2026 Asia-Pacific Natural Vitamin E Tocopherols Volume Market Share by End-use Application - Animal Feed, Dietary Supplements, Food & Beverages, Cosmetics & Personal Care and Others
Chart 175: Asia-Pacific Natural Vitamin E Tocopherols Market Analysis (2017-2026) by End-use Application - Animal Feed, Dietary Supplements, Food & Beverages, Cosmetics & Personal Care and Others in USD Million
Chart 176: Glance at 2017, 2020 and 2026 Asia-Pacific Natural Vitamin E Tocopherols Value Market Share by End-use Application - Animal Feed, Dietary Supplements, Food & Beverages, Cosmetics & Personal Care and Others
Chart 177: Asia-Pacific Natural Vitamin E Tocopherols Market Analysis (2017-2026) by Geographic Region - China, India, Japan and Rest of APAC in Metric Tons
Chart 178: Glance at 2017, 2020 and 2026 Asia-Pacific Natural Vitamin E Tocopherols Volume Market Share by Geographic Region - China, India, Japan and Rest of APAC
Chart 179: Asia-Pacific Natural Vitamin E Tocopherols Market Analysis (2017-2026) by Geographic Region - China, India, Japan and Rest of APAC in USD Million
Chart 180: Glance at 2017, 2020 and 2026 Asia-Pacific Natural Vitamin E Tocopherols Value Market Share by Geographic Region - China, India, Japan and Rest of APAC
Chart 181: Asia-Pacific Natural Vitamin E Tocotrienols Market Analysis (2017-2026) by Volume in Metric Tons and Value in USD Million
Chart 182: Asia-Pacific Natural Vitamin E Tocotrienols Market Analysis (2017-2026) by End-use Application - Dietary Supplements, Food & Beverages and Cosmetics & Personal Care in Metric Tons
Chart 183: Glance at 2017, 2020 and 2026 Asia-Pacific Natural Vitamin E Tocotrienols Volume Market Share by End-use Application - Dietary Supplements, Food & Beverages and Cosmetics & Personal Care
Chart 184: Asia-Pacific Natural Vitamin E Tocotrienols Market Analysis (2017-2026) by End-use Application - Dietary Supplements, Food & Beverages and Cosmetics & Personal Care in USD Million
Chart 185: Glance at 2017, 2020 and 2026 Asia-Pacific Natural Vitamin E Tocotrienols Value Market Share by End-use Application - Dietary Supplements, Food & Beverages and Cosmetics & Personal Care
Chart 186: Asia-Pacific Natural Vitamin E Tocotrienols Market Analysis (2017-2026) by Geographic Region - China, India, Japan and Rest of APAC in Metric Tons
Chart 187: Glance at 2017, 2020 and 2026 Asia-Pacific Natural Vitamin E Tocotrienols Volume Market Share by Geographic Region - China, India, Japan and Rest of APAC
Chart 188: Asia-Pacific Natural Vitamin E Tocotrienols Market Analysis (2017-2026) by Geographic Region - China, India, Japan and Rest of APAC in USD Million
Chart 189: Glance at 2017, 2020 and 2026 Asia-Pacific Natural Vitamin E Tocotrienols Value Market Share by Geographic Region - China, India, Japan and Rest of APAC
China
Chart 190: China Natural Vitamin E Market Analysis (2017-2026) by End-use Application - Animal Feed, Dietary Supplements, Food & Beverages, Cosmetics & Personal Care and Others in Metric Tons
Chart 191: Glance at 2017, 2020 and 2026 China Natural Vitamin E Volume Market Share by End-use Application - Animal Feed, Dietary Supplements, Food & Beverages, Cosmetics & Personal Care and Others
Chart 192: China Natural Vitamin E Market Analysis (2017-2026) by End-use Application - Animal Feed, Dietary Supplements, Food & Beverages, Cosmetics & Personal Care and Others in USD Million
Chart 193: Glance at 2017, 2020 and 2026 China Natural Vitamin E Value Market Share by End-use Application - Animal Feed, Dietary Supplements, Food & Beverages, Cosmetics & Personal Care and Others
Chart 194: China Natural Vitamin E Tocopherols Market Analysis (2017-2026) by End-use Application - Animal Feed, Dietary Supplements, Food & Beverages, Cosmetics & Personal Care and Others in Metric Tons
Chart 195: Glance at 2017, 2020 and 2026 China Natural Vitamin E Tocopherols Volume Market Share by End-use Application - Animal Feed, Dietary Supplements, Food & Beverages, Cosmetics & Personal Care and Others
Chart 196: China Natural Vitamin E Tocopherols Market Analysis (2017-2026) by End-use Application - Animal Feed, Dietary Supplements, Food & Beverages, Cosmetics & Personal Care and Others in USD Million
Chart 197: Glance at 2017, 2020 and 2026 China Natural Vitamin E Tocopherols Value Market Share by End-use Application - Animal Feed, Dietary Supplements, Food & Beverages, Cosmetics & Personal Care and Others
Chart 198: China Natural Vitamin E Tocotrienols Market Analysis (2017-2026) by End-use Application - Dietary Supplements, Food & Beverages and Cosmetics & Personal Care in Metric Tons
Chart 199: Glance at 2017, 2020 and 2026 China Natural Vitamin E Tocotrienols Volume Market Share by End-use Application - Dietary Supplements, Food & Beverages and Cosmetics & Personal Care
Chart 200: China Natural Vitamin E Tocotrienols Market Analysis (2017-2026) by End-use Application - Dietary Supplements, Food & Beverages and Cosmetics & Personal Care in USD Million
Chart 201: Glance at 2017, 2020 and 2026 China Natural Vitamin E Tocotrienols Value Market Share by End-use Application - Dietary Supplements, Food & Beverages and Cosmetics & Personal Care
India
Chart 202: India Natural Vitamin E Market Analysis (2017-2026) by End-use Application - Animal Feed, Dietary Supplements, Food & Beverages, Cosmetics & Personal Care and Others in Metric Tons
Chart 203: Glance at 2017, 2020 and 2026 India Natural Vitamin E Volume Market Share by End-use Application - Animal Feed, Dietary Supplements, Food & Beverages, Cosmetics & Personal Care and Others
Chart 204: India Natural Vitamin E Market Analysis (2017-2026) by End-use Application - Animal Feed, Dietary Supplements, Food & Beverages, Cosmetics & Personal Care and Others in USD Million
Chart 205: Glance at 2017, 2020 and 2026 India Natural Vitamin E Value Market Share by End-use Application - Animal Feed, Dietary Supplements, Food & Beverages, Cosmetics & Personal Care and Others
Chart 206: India Natural Vitamin E Tocopherols Market Analysis (2017-2026) by End-use Application - Animal Feed, Dietary Supplements, Food & Beverages, Cosmetics & Personal Care and Others in Metric Tons
Chart 207: Glance at 2017, 2020 and 2026 India Natural Vitamin E Tocopherols Volume Market Share by End-use Application - Animal Feed, Dietary Supplements, Food & Beverages, Cosmetics & Personal Care and Others
Chart 208: India Natural Vitamin E Tocopherols Market Analysis (2017-2026) by End-use Application - Animal Feed, Dietary Supplements, Food & Beverages, Cosmetics & Personal Care and Others in USD Million
Chart 209: Glance at 2017, 2020 and 2026 India Natural Vitamin E Tocopherols Value Market Share by End-use Application - Animal Feed, Dietary Supplements, Food & Beverages, Cosmetics & Personal Care and Others
Chart 210: India Natural Vitamin E Tocotrienols Market Analysis (2017-2026) by End-use Application - Dietary Supplements and Others in Metric Tons
Chart 211: Glance at 2017, 2020 and 2026 India Natural Vitamin E Tocotrienols Volume Market Share by End-use Application - Dietary Supplements and Others
Chart 212: India Natural Vitamin E Tocotrienols Market Analysis (2017-2026) by End-use Application - Dietary Supplements and Others in USD Million
Chart 213: Glance at 2017, 2020 and 2026 India Natural Vitamin E Tocotrienols Value Market Share by End-use Application - Dietary Supplements and Others
Japan
Chart 214: Japan Natural Vitamin E Market Analysis (2017-2026) by End-use Application - Animal Feed, Dietary Supplements, Food & Beverages, Cosmetics & Personal Care and Others in Metric Tons
Chart 215: Glance at 2017, 2020 and 2026 Japan Natural Vitamin E Volume Market Share by End-use Application - Animal Feed, Dietary Supplements, Food & Beverages, Cosmetics & Personal Care and Others
Chart 216: Japan Natural Vitamin E Market Analysis (2017-2026) by End-use Application - Animal Feed, Dietary Supplements, Food & Beverages, Cosmetics & Personal Care and Others in USD Million
Chart 217: Glance at 2017, 2020 and 2026 Japan Natural Vitamin E Value Market Share by End-use Application - Animal Feed, Dietary Supplements, Food & Beverages, Cosmetics & Personal Care and Others
Chart 218: Japan Natural Vitamin E Tocopherols Market Analysis (2017-2026) by End-use Application - Animal Feed, Dietary Supplements, Food & Beverages, Cosmetics & Personal Care and Others in Metric Tons
Chart 219: Glance at 2017, 2020 and 2026 Japan Natural Vitamin E Tocopherols Volume Market Share by End-use Application - Animal Feed, Dietary Supplements, Food & Beverages, Cosmetics & Personal Care and Others
Chart 220: Japan Natural Vitamin E Tocopherols Market Analysis (2017-2026) by End-use Application - Animal Feed, Dietary Supplements, Food & Beverages, Cosmetics & Personal Care and Others in USD Million
Chart 221: Glance at 2017, 2020 and 2026 Japan Natural Vitamin E Tocopherols Value Market Share by End-use Application - Animal Feed, Dietary Supplements, Food & Beverages, Cosmetics & Personal Care and Others
Chart 222: Japan Natural Vitamin E Tocotrienols Market Analysis (2017-2026) by End-use Application - Dietary Supplements, Food & Beverages and Cosmetics & Personal Care in Metric Tons
Chart 223: Glance at 2017, 2020 and 2026 Japan Natural Vitamin E Tocotrienols Volume Market Share by End-use Application - Dietary Supplements, Food & Beverages and Cosmetics & Personal Care
Chart 224: Japan Natural Vitamin E Tocotrienols Market Analysis (2017-2026) by End-use Application - Dietary Supplements, Food & Beverages and Cosmetics & Personal Care in USD Million
Chart 225: Glance at 2017, 2020 and 2026 Japan Natural Vitamin E Tocotrienols Value Market Share by End-use Application - Dietary Supplements, Food & Beverages and Cosmetics & Personal Care
Rest of Asia-Pacific
Chart 226: Rest of Asia-Pacific Natural Vitamin E Market Analysis (2017-2026) by End-use Application - Animal Feed, Dietary Supplements, Food & Beverages, Cosmetics & Personal Care and Others in Metric Tons
Chart 227: Glance at 2017, 2020 and 2026 Rest of Asia-Pacific Natural Vitamin E Volume Market Share by End-use Application - Animal Feed, Dietary Supplements, Food & Beverages, Cosmetics & Personal Care and Others
Chart 228: Rest of Asia-Pacific Natural Vitamin E Market Analysis (2017-2026) by End-use Application - Animal Feed, Dietary Supplements, Food & Beverages, Cosmetics & Personal Care and Others in USD Million
Chart 229: Glance at 2017, 2020 and 2026 Rest of Asia-Pacific Natural Vitamin E Value Market Share by End-use Application - Animal Feed, Dietary Supplements, Food & Beverages, Cosmetics & Personal Care and Others
Chart 230: Rest of Asia-Pacific Natural Vitamin E Tocopherols Market Analysis (2017-2026) by End-use Application - Animal Feed, Dietary Supplements, Food & Beverages, Cosmetics & Personal Care and Others in Metric Tons
Chart 231: Glance at 2017, 2020 and 2026 Rest of Asia-Pacific Natural Vitamin E Tocopherols Volume Market Share by End-use Application - Animal Feed, Dietary Supplements, Food & Beverages, Cosmetics & Personal Care and Others
Chart 232: Rest of Asia-Pacific Natural Vitamin E Tocopherols Market Analysis (2017-2026) by End-use Application - Animal Feed, Dietary Supplements, Food & Beverages, Cosmetics & Personal Care and Others in USD Million
Chart 233: Glance at 2017, 2020 and 2026 Rest of Asia-Pacific Natural Vitamin E Tocopherols Value Market Share by End-use Application - Animal Feed, Dietary Supplements, Food & Beverages, Cosmetics & Personal Care and Others
Chart 234: Rest of Asia-Pacific Natural Vitamin E Tocotrienols Market Analysis (2017-2026) by End-use Application - Dietary Supplements, Food & Beverages and Cosmetics & Personal Care in Metric Tons
Chart 235: Glance at 2017, 2020 and 2026 Rest of Asia-Pacific Natural Vitamin E Tocotrienols Volume Market Share by End-use Application - Dietary Supplements, Food & Beverages and Cosmetics & Personal Care
Chart 236: Rest of Asia-Pacific Natural Vitamin E Tocotrienols Market Analysis (2017-2026) by End-use Application - Dietary Supplements, Food & Beverages and Cosmetics & Personal Care in USD Million
Chart 237: Glance at 2017, 2020 and 2026 Rest of Asia-Pacific Natural Vitamin E Tocotrienols Value Market Share by End-use Application - Dietary Supplements, Food & Beverages and Cosmetics & Personal Care
SOUTH AMERICA
Chart 238: South American Natural Vitamin E Tocopherols Market Analysis (2017-2026) by Volume in Metric Tons and Value in USD Million
Chart 239: South American Natural Vitamin E Tocopherols Market Analysis (2017-2026) by End-use Application - Animal Feed, Dietary Supplements, Food & Beverages, Cosmetics & Personal Care and Others in Metric Tons
Chart 240: Glance at 2017, 2020 and 2026 South American Natural Vitamin E Tocopherols Volume Market Share by End-use Application - Animal Feed, Dietary Supplements, Food & Beverages, Cosmetics & Personal Care and Others
Chart 241: South American Natural Vitamin E Tocopherols Market Analysis (2017-2026) by End-use Application - Animal Feed, Dietary Supplements, Food & Beverages, Cosmetics & Personal Care and Others in USD Million
Chart 242: Glance at 2017, 2020 and 2026 South American Natural Vitamin E Tocopherols Value Market Share by End-use Application - Animal Feed, Dietary Supplements, Food & Beverages, Cosmetics & Personal Care and Others
Chart 243: South American Natural Vitamin E Tocopherols Market Analysis (2017-2026) by Geographic Region - Brazil, Argentina and Rest of South America in Metric tons
Chart 244: Glance at 2017, 2020 and 2026 South American Natural Vitamin E Tocopherols Volume Market Share by Geographic Region - Brazil, Argentina and Rest of South America
Chart 245: South American Natural Vitamin E Tocopherols Market Analysis (2017-2026) by Geographic Region - Brazil, Argentina and Rest of South America in USD Million
Chart 246: Glance at 2017, 2020 and 2026 South American Natural Vitamin E Tocopherols Value Market Share by Geographic Region - Brazil, Argentina and Rest of South America
Brazil
Chart 247: Brazil Natural Vitamin E Tocopherols Market Analysis (2017-2026) by End-use Application - Animal Feed, Dietary Supplements, Food & Beverages, Cosmetics & Personal Care and Others in Metric Tons
Chart 248: Glance at 2017, 2020 and 2026 Brazil Natural Vitamin E Tocopherols Volume Market Share by End-use Application - Animal Feed, Dietary Supplements, Food & Beverages, Cosmetics & Personal Care and Others
Chart 249: Brazil Natural Vitamin E Tocopherols Market Analysis (2017-2026) by End-use Application - Animal Feed, Dietary Supplements, Food & Beverages, Cosmetics & Personal Care and Others in USD Million
Chart 250: Glance at 2017, 2020 and 2026 Brazil Natural Vitamin E Tocopherols Value Market Share by End-use Application - Animal Feed, Dietary Supplements, Food & Beverages, Cosmetics & Personal Care and Others
Argentina
Chart 251: Argentina Natural Vitamin E Tocopherols Market Analysis (2017-2026) by End-use Application - Animal Feed, Dietary Supplements, Food & Beverages and Others in Metric Tons
Chart 252: Glance at 2017, 2020 and 2026 Argentina Natural Vitamin E Tocopherols Volume Market Share by End-use Application - Animal Feed, Dietary Supplements, Food & Beverages and Others
Chart 253: Argentina Natural Vitamin E Tocopherols Market Analysis (2017-2026) by End-use Application - Animal Feed, Dietary Supplements, Food & Beverages and Others in USD Million
Chart 254: Glance at 2017, 2020 and 2026 Argentina Natural Vitamin E Tocopherols Value Market Share by End-use Application - Animal Feed, Dietary Supplements, Food & Beverages and Others
Rest of South America
Chart 255: Rest of South America Natural Vitamin E Tocopherols Market Analysis (2017-2026) by End-use Application - Animal Feed, Dietary Supplements, Food & Beverages, Cosmetics & Personal Care and Others in Metric Tons
Chart 256: Glance at 2017, 2020 and 2026 Rest of South America Natural Vitamin E Tocopherols Volume Market Share by End-use Application - Animal Feed, Dietary Supplements, Food & Beverages, Cosmetics & Personal Care and Others
Chart 257: Rest of South America Natural Vitamin E Tocopherols Market Analysis (2017-2026) by End-use Application - Animal Feed, Dietary Supplements, Food & Beverages, Cosmetics & Personal Care and Others in USD Million
Chart 258: Glance at 2017, 2020 and 2026 Rest of South America Natural Vitamin E Tocopherols Value Market Share by End-use Application - Animal Feed, Dietary Supplements, Food & Beverages, Cosmetics & Personal Care and Others
REST OF WORLD
Chart 259: Rest of World Natural Vitamin E Market Analysis (2017-2026) by Volume in Metric Tons and Value in USD Million
Chart 260: Rest of World Natural Vitamin E Market Analysis (2017-2026) by End-use Application - Animal Feed, Dietary Supplements, Food & Beverages, Cosmetics & Personal Care and Others in Metric Tons
Chart 261: Glance at 2017, 2020 and 2026 Rest of World Natural Vitamin E Volume Market Share by End-use Application - Animal Feed, Dietary Supplements, Food & Beverages, Cosmetics & Personal Care and Others
Chart 262: Rest of World Natural Vitamin E Market Analysis (2017-2026) by End-use Application - Animal Feed, Dietary Supplements, Food & Beverages, Cosmetics & Personal Care and Others in USD Million
Chart 263: Glance at 2017, 2020 and 2026 Rest of World Natural Vitamin E Value Market Share by End-use Application - Animal Feed, Dietary Supplements, Food & Beverages, Cosmetics & Personal Care and Others
Chart 264: Rest of World Natural Vitamin E Market Analysis (2017-2026) by Type - Tocopherols and Tocotrienols in Metric Tons
Chart 265: Glance at 2017, 2020 and 2026 Rest of World Natural Vitamin E Volume Market Share by Type - Tocopherols and Tocotrienols
Chart 266: Rest of World Natural Vitamin E Market Analysis (2017-2026) by Type - Tocopherols and Tocotrienols in USD Million
Chart 267: Glance at 2017, 2020 and 2026 Rest of World Natural Vitamin E Value Market Share by Type - Tocopherols and Tocotrienols
Chart 268: Rest of World Natural Vitamin E Tocopherols Market Analysis (2017-2026) by Volume in Metric Tons and Value in USD Million
Chart 269: Rest of World Natural Vitamin E Tocopherols Market Analysis (2017-2026) by End-use Application - Animal Feed, Dietary Supplements, Food & Beverages, Cosmetics & Personal Care and Others in Metric Tons
Chart 270: Glance at 2017, 2020 and 2026 Rest of World Natural Vitamin E Tocopherols Volume Market Share by End-use Application - Animal Feed, Dietary Supplements, Food & Beverages, Cosmetics & Personal Care and Others
Chart 271: Rest of World Natural Vitamin E Tocopherols Market Analysis (2017-2026) by End-use Application - Animal Feed, Dietary Supplements, Food & Beverages, Cosmetics & Personal Care and Others in USD Million
Chart 272: Glance at 2017, 2020 and 2026 Rest of World Natural Vitamin E Tocopherols Value Market Share by End-use Application - Animal Feed, Dietary Supplements, Food & Beverages, Cosmetics & Personal Care and Others
Chart 273: Rest of World Natural Vitamin E Tocotrienols Market Analysis (2017-2026) by Volume in Metric Tons and Value in USD Million
Chart 274: Rest of World Natural Vitamin E Tocotrienols Market Analysis (2017-2026) by End-use Application - Dietary Supplements and Others in Metric Tons
Chart 275: Glance at 2017, 2020 and 2026 Rest of World Natural Vitamin E Tocotrienols Volume Market Share by End-use Application - Dietary Supplements and Others
Chart 276: Rest of World Natural Vitamin E Tocotrienols Market Analysis (2017-2026) by End-use Application - Dietary Supplements and Others in USD Million
Chart 277: Glance at 2017, 2020 and 2026 Rest of World Natural Vitamin E Tocotrienols Value Market Share by End-use Application - Dietary Supplements and Others
Advanced Organic Materials S.A.
American River Nutrition, Inc.
Archer Daniels Midland Company
Beijing Gingko Group
BTSA Biotecnologias Aplicadas Sl
COFCO Tech Bioengineering (Tianjin) Co., Ltd.
DSM Nutritional Products (Royal DSM NV)
ExcelVite Sdn. Bhd.
Fenchem Biotek Ltd.
Fujian Glanny Bio-Engineering Co., Ltd.
Kensing, LLC.
KLK Oleo (Davos Life Science)
Mitsubishi-Chemical Foods Corporation
Musim Mas Group
Riken Vitamin Co., Ltd.
Sime Darby Oils Nutrition
Vance Group Ltd.
Vitae Naturals (Vitae Caps, S.A.)
Wilmar Spring Fruit Nutrition Products (Jiangsu) Co., Ltd.
Xi'an Healthful Biotechnology Co Ltd (HSF)
Zhejiang Medicine Co., Ltd.
Zhejiang Worldbestve Biotechnology Co., Ltd.
SINGLE USER/ENTERPRISE LICENSE
Electronic (PDF)
Latest Version Available!
Latest version of this report is available. Click below to view report.
Latest Publication
avialable for this report
OTHER ARCHIVED REPORTS

Vacuum Insulation Panels (VIPs) – A Global Market Overview-2021
Report Code: MG023ARCH | Pages: 272 | Price: $1800
Published
Jan 2021

Powder Metallurgy – A Global Market Overview
Report Code: CP057ARCH | Pages: 567 | Price: $2187
Published
Oct 2020

Hydraulic Components – A Global Market Overview
Report Code: MG014ARCH | Pages: 464 | Price: $2475
Published
Aug 2020

Global Zeolites Market – Products and Applications | Covid-19 Impact
Report Code: CP091ARCH | Pages: 450 | Price: $2475
Published
Jul 2020