
Vitamin E plant closures, such as those of BASF in Germany and others in China, have tightened the supply of vitamin E since the last quarter of 2017. As a consequence of this, the supply of vitamin E will constrict in the first half of 2018 and cause considerable price hikes. Being a major consumer of vitamin E will adversely affect the animal feed industry, since spikes in prices are likely to increase costs of livestock feed supplements. Already, feed manufacturers and formulators are seeking out alternative ways, such as reducing vitamin E levels in feed or replacing with other ingredients, to alleviate the situation. Industry experts suggesting a challenging outlook for the global vitamin E market till at least the second half of 2018, which would gradually ease off after that.
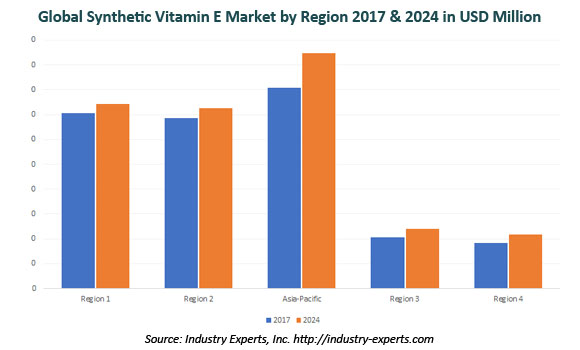
Asia-Pacific is the largest consumer of synthetic vitamin E globally with a volume share of 35.4% (37 thousand metric tons) in 2017 valued at US$403.3 million. Asia-Pacific is also slated to register the fastest volume CAGR of 2.3% during 2017 to 2024 period reaching 44.6 thousand metric tons in 2024 valued at US$474.2 million.
Research Findings & Coverage
- Synthetic Vitamin E market is analyzed in this report with respect to major end-use sectors and key countries across the world
- The study exclusively analyzes the market of each end-use sectors of Synthetic Vitamin E by a major geographic region
- Installed capacities of synthetic vitamin e manufacturers
- Supply Shortage of Vitamin E Spikes Prices Forcing Feed Manufacturers to Reduce the Usage
- Synthetic Vitamin E Growth to be Propelled by Animal Feed Demand in Developing Economies
- Key business trends focusing on product innovations/developments, M&As, JVs and other recent industry developments
- Major companies profiled – 14
- The industry guide includes the contact details for 109 companies
End-Use Sectors of Synthetic Vitamin E
- Animal Feed
- Dietary Supplements
- Food & Beverages
- Cosmetics & Personal Care
Analysis Period, Units and Growth Rates
- The report reviews, analyzes and projects the global Synthetic Vitamin E market for the period 2014-2024 in terms of volumes in Tons and market value in US$ and the compound annual growth rates (CAGRs) projected from 2017 through 2024
Geographic Coverage
- North America (The United States, Canada and Mexico)
- Europe (Germany, France, Italy, Spain, The United Kingdom, The Netherlands and Rest of World)
- Asia-Pacific (China, India, Japan and Rest of Asia-Pacific)
- South America (Brazil, Argentina and Rest of South America)
- Rest of World
PART A: GLOBAL MARKET PERSPECTIVE
1. INTRODUCTION
1.1 Glance at Overall Vitamin E Market
1.2 Market Trends and Outlook
1.2.1 Supply Shortage of Vitamin E Spikes Prices Forcing Feed Manufacturers to Reduce the Usage
1.2.2 Synthetic Vitamin E Growth to be Propelled by Animal Feed Demand in Developing Economies
1.3 Product Outline
1.3.1 Vitamin E
1.3.2 Types of Vitamin E
1.3.2.1 Synthetic Vitamin E
1.3.2.2 Natural Source Vitamin E
1.3.2.2.1 Tocopherols
1.3.2.2.2 Tocotrienols
1.3.2.2.3 Vitamin E TPGS (d-Alpha Tocopheryl Polyethylene Glycol 1000 Succinate)
1.3.3 Raw Materials and Manufacturing Processes of Vitamin E
1.3.3.1 Synthetic Vitamin E
1.3.3.2 Natural Source Vitamin E
1.3.3.2.1 Tocopherols
1.3.3.2.2 Tocotrienols
1.3.4 End-Use Applications of Vitamin E
1.3.4.1 Animal Nutrition
1.3.4.2 Human Nutritional/Dietary Supplements
1.3.4.3 Functional Food and Beverages
1.3.4.4 Cosmetics & Personal Care
2. INDUSTRY LANDSCAPE
2.1 Global Synthetic Vitamin E Installed Capacities
2.2 Key Global Players
BASF SE (Germany)
Chongqing Southwest Synthetic Pharmaceuticals Corp Ltd (China)
DSM Nutritional Products (Royal DSM NV) (The Netherlands)
Jilin Beisha Pharmaceutical Co., Ltd. (China)
Mitsubishi-Chemical Foods Corporation (Japan)
Zhejiang Medicine Co Ltd (China)
Zhejiang NHU Company Ltd (China)
3. KEY BUSINESS TRENDS
BASF Announces Force Majeure for Vitamin A and E Plants
Nenter & Co., Inc Starts Construction of 20 Thousand Metric Tons per Year Vitamin E Plant
Mitsubishi Chemical Acquires Eisai Food & Chemical Co Ltd
4. GLOBAL MARKET OVERVIEW
4.1 Global Synthetic Vitamin E Market Overview by End-Use Application
4.1.1 End-Use Application Market Overview by Geographic Region
4.1.1.1 Animal Feed
4.1.1.2 Dietary Supplements
4.1.1.3 Food & Beverages
4.1.1.4 Cosmetics & Personal Care
PART B: REGIONAL MARKET PERSPECTIVE
Global Synthetic Vitamin E Market Overview by Geographic Region
REGIONAL MARKET OVERVIEW
1. NORTH AMERICA
1.1 North American Synthetic Vitamin E Market Overview by End-Use Application
1.2 North American Synthetic Vitamin E Market Overview by Geographic Region
1.3 Synthetic Vitamin E Market Overview by North American Region
1.3.1 The United States
1.3.1.1 United States Synthetic Vitamin E Market Overview by End-Use Application
1.3.2 Canada
1.3.2.1 Canada Synthetic Vitamin E Market Overview by End-Use Application
1.3.3 Mexico
1.3.3.1 Mexico Synthetic Vitamin E Market Overview by End-Use Application
2. EUROPE
2.1 European Synthetic Vitamin E Market Overview by End-Use Application
2.2 European Synthetic Vitamin E Market Overview by Geographic Region
2.3 Major Market Players
BASF SE (Germany)
DSM Nutritional Products (Royal DSM NV) (The Netherlands)
Sintofarm SpA (Italy)
2.4 Synthetic Vitamin E Market Overview by European Region
2.4.1 Germany
2.4.1.1 Germany Synthetic Vitamin E Market Overview by End-Use Application
2.4.2 France
2.4.2.1 France Synthetic Vitamin E Market Overview by End-Use Application
2.4.3 The Netherlands
2.4.3.1 Netherlands Synthetic Vitamin E Market Overview by End-Use Application
2.4.4 Spain
2.4.4.1 Spain Synthetic Vitamin E Market Overview by End-Use Application
2.4.5 Italy
2.4.5.1 Italy Synthetic Vitamin E Market Overview by End-Use Application
2.4.6 The United Kingdom
2.4.6.1 United Kingdom Synthetic Vitamin E Market Overview by End-Use Application
2.4.7 Rest of Europe
2.4.7.1 Rest of Europe Synthetic Vitamin E Market Overview by End-Use Application
3. ASIA-PACIFIC
3.1 Asia-Pacific Synthetic Vitamin E Market Overview by End-Use Application
3.2 Asia-Pacific Synthetic Vitamin E Market Overview by Geographic Region
3.3 Major Market Players
Chongqing Southwest Synthetic Pharmaceuticals Corp Ltd (China)
Hangzhou Gosun Biotechnologies Co Ltd (China)
Jilin Beisha Pharmaceutical Co., Ltd. (China)
Merck Limited (India)
Mitsubishi-Chemical Foods Corporation (Japan)
Soham Organics Pvt. Ltd. (India)
Wuhu Huahai Biology Engineering Co Ltd (China)
Zhejiang Donggong Pharmaceutical Co Ltd (China)
Zhejiang Medicine Co Ltd (China)
Zhejiang NHU Company Ltd (China)
3.4 Synthetic Vitamin E Market Overview by Asia-Pacific Region
3.4.1 China
3.4.1.1 China Synthetic Vitamin E Market Overview by End-Use Application
3.4.2 India
3.4.2.1 India Synthetic Vitamin E Market Overview by End-Use Application
3.4.3 Japan
3.4.3.1 Japan Synthetic Vitamin E Market Overview by End-Use Application
3.4.4 Rest of Asia-Pacific
3.4.4.1 Rest of Asia-Pacific Synthetic Vitamin E Market Overview by End-Use Application
4. SOUTH AMERICA
4.1 South American Synthetic Vitamin E Market Overview by End-use Application
4.2 South America Synthetic Vitamin E Market Overview by Geographic Region
4.3 Synthetic Vitamin E Market Overview by South American Region
4.3.1 Brazil
4.3.1.1 Brazil Synthetic Vitamin E Market Overview by End-use Application
4.3.2 Argentina
4.3.2.1 Argentina Synthetic Vitamin E Market Overview by End-use Application
4.3.3 Rest of South America
4.3.3.1 Rest of South America Synthetic Vitamin E Market Overview by End-use Application
5. REST OF WORLD
5.1 Rest of World Synthetic Vitamin E Market Overview by End-Use Application
5.2 Major Market Player
Yerevan Vitamin Plant (Republic Of Armenia)
PART C: GUIDE TO THE INDUSTRY
1. Synthetic Vitamin E Manufacturers
2. Major Companies in the End-use Application Industries for Vitamin E
Nutritional Supplements Companies
Direct Selling Companies – Supplements and Personal Care
Contract Manufcturers – Supplements
Animal Nutrition Companies
PART D: ANNEXURE
1. RESEARCH METHODOLOGY
2. FEEDBACK
Charts & Graphs
PART A: GLOBAL MARKET PERSPECTIVE
Chart 1: Global Synthetic Vitamin E Market 2014, 2017, 2018 and 2024
Chart 2: Global Synthetic Vitamin E Market 2017 and 2024 by End-use Application
Chart 3: Global Synthetic Vitamin E Market 2017 and 2024 by Geographic Region
Chart 4: Global Vitamin E Market Analysis 2014, 2017 and 2024 by Category – Synthetic Vitamin E and Natural Vitamin E (Volume in Metric Tons and Value in USD Million)
Chart 5: Glance at 2014, 2017 and 2024 Global Vitamin E Market Share by Category – Synthetic Vitamin E and Natural Vitamin E
Chart 6: 2012 and 2017 Global Synthetic Vitamin E Capacity by Major Player in Metric Tons
Chart 7: Global Synthetic Vitamin E Market Analysis (2014-2024) – Volume in Metric Tons and Value in USD Million
Chart 8: Global Synthetic Vitamin E Market Analysis by End-use Application – Animal Feed, Dietary Supplements, Food & Beverages and Cosmetics & Personal Care in Metric Tons
Chart 9: Glance at 2014, 2018 and 2024 Global Synthetic Vitamin E Volume Market Share by End-use Application – Animal Feed, Dietary Supplements, Food & Beverages and Cosmetics & Personal Care
Chart 10: Global Synthetic Vitamin E Market Analysis by End-use Application – Animal Feed, Dietary Supplements, Food & Beverages and Cosmetics & Personal Care in USD Million
Chart 11: Glance at 2014, 2018 and 2024 Global Synthetic Vitamin E Value Market Share by End-use Application – Animal Feed, Dietary Supplements, Food & Beverages and Cosmetics & Personal Care
Chart 12: Global Synthetic Vitamin E Market in Animal Feed (2014-2024) by Geographic Region – North America, Europe, Asia-Pacific, South America and Rest of World in Metric Tons
Chart 13: Glance at 2014, 2018 and 2024 Global Synthetic Vitamin E Volume Market Share in Animal Feed by Geographic Region – North America, Europe, Asia-Pacific, South America and Rest of World
Chart 14: Global Synthetic Vitamin E Market in Animal Feed (2014-2024) by Geographic Region – North America, Europe, Asia-Pacific, South America and Rest of World in USD Million
Chart 15: Glance at 2014, 2018 and 2024 Global Synthetic Vitamin E Value Market Share in Animal Feed by Geographic Region – North America, Europe, Asia-Pacific, South America and Rest of World
Chart 16: Global Synthetic Vitamin E Market in Dietary Supplements (2014-2024) by Geographic Region – North America, Europe, Asia-Pacific, South America and Rest of World in Metric Tons
Chart 17: Glance at 2014, 2018 and 2024 Global Synthetic Vitamin E Volume Market Share in Dietary Supplements by Geographic Region – North America, Europe, Asia-Pacific, South America and Rest of World
Chart 18: Global Synthetic Vitamin E Market in Dietary Supplements (2014-2024) by Geographic Region – North America, Europe, Asia-Pacific, South America and Rest of World in USD Million
Chart 19: Glance at 2014, 2018 and 2024 Global Synthetic Vitamin E Value Market Share in Dietary Supplements by Geographic Region – North America, Europe, Asia-Pacific, South America and Rest of World
Chart 20: Global Synthetic Vitamin E Market in Food & Beverages (2014-2024) by Geographic Region – North America, Europe, Asia-Pacific, South America and Rest of World in Metric Tons
Chart 21: Glance at 2014, 2018 and 2024 Global Synthetic Vitamin E Volume Market Share in Food & Beverages by Geographic Region – North America, Europe, Asia-Pacific, South America and Rest of World
Chart 22: Global Synthetic Vitamin E Market in Food & Beverages (2014-2024) by Geographic Region – North America, Europe, Asia-Pacific, South America and Rest of World in USD Million
Chart 23: Glance at 2014, 2018 and 2024 Global Synthetic Vitamin E Value Market Share in Food & Beverages by Geographic Region – North America, Europe, Asia-Pacific, South America and Rest of World
Chart 24: Global Synthetic Vitamin E Market in Cosmetics & Personal Care (2014-2024) by Geographic Region – North America, Europe, Asia-Pacific, South America and Rest of World in Metric Tons
Chart 25: Glance at 2014, 2018 and 2024 Global Synthetic Vitamin E Volume Market Share in Cosmetics & Personal Care by Geographic Region – North America, Europe, Asia-Pacific, South America and Rest of World
Chart 26: Global Synthetic Vitamin E Market in Cosmetics & Personal Care (2014-2024) by Geographic Region – North America, Europe, Asia-Pacific, South America and Rest of World in USD Million
Chart 27: Glance at 2014, 2018 and 2024 Global Synthetic Vitamin E Value Market Share in Cosmetics & Personal Care by Geographic Region – North America, Europe, Asia-Pacific, South America and Rest of World
PART B: REGIONAL MARKET PERSPECTIVE
Chart 28: Global Synthetic Vitamin E Market Analysis (2014-2024) by Geographic Region – North America, Europe, Asia-Pacific, South America and Rest of World in Metric Tons
Chart 29: Glance at 2014, 2018 and 2024 Global Synthetic Vitamin E Volume Market Share by Geographic Region – North America, Europe, Asia-Pacific, South America and Rest of World
Chart 30: Global Synthetic Vitamin E Market Analysis (2014-2024) by Geographic Region – North America, Europe, Asia-Pacific, South America and Rest of World in USD Million
Chart 31: Glance at 2014, 2018 and 2024 Global Synthetic Vitamin E Value Market Share by Geographic Region – North America, Europe, Asia-Pacific, South America and Rest of World
REGIONAL MARKET OVERVIEW
NORTH AMERICA
Chart 32: North American Synthetic Vitamin E Market (2014-2024) – Volume in Metric Tons and Value in USD Million
Chart 33: North American Synthetic Vitamin E Market Analysis (2014-2024) by End-use Application – Animal Feed, Dietary Supplements, Food & Beverages and Cosmetics & Personal Care in Metric Tons
Chart 34: Glance at 2014, 2018 and 2024 North American Synthetic Vitamin E Volume Market Share by End-use Application – Animal Feed, Dietary Supplements, Food & Beverages and Cosmetics & Personal Care
Chart 35: North American Synthetic Vitamin E Market Analysis (2014-2024) by End-use Application – Animal Feed, Dietary Supplements, Food & Beverages and Cosmetics & Personal Care in USD Million
Chart 36: Glance at 2014, 2018 and 2024 North American Synthetic Vitamin E Value Market Share by End-use Application – Animal Feed, Dietary Supplements, Food & Beverages and Cosmetics & Personal Care
Chart 37: North American Synthetic Vitamin E Market Analysis (2014-2024) by Geographic Region – United States, Mexico and Canada in Metric Tons
Chart 38: Glance at 2014, 2018 and 2024 North American Synthetic Vitamin E Volume Market Share by Geographic Region – United States, Mexico and Canada
Chart 39: North American Synthetic Vitamin E Market Analysis (2014-2024) by Geographic Region – United States, Mexico and Canada in USD Million
Chart 40: Glance at 2014, 2018 and 2024 North American Synthetic Vitamin E Value Market Share by Geographic Region – United States, Mexico and Canada
The United States
Chart 41: United States Synthetic Vitamin E Market Analysis (2014-2024) by End-use Application – Animal Feed, Dietary Supplements, Food & Beverages and Cosmetics & Personal Care in Metric Tons
Chart 42: Glance at 2014, 2018 and 2024 United States Synthetic Vitamin E Volume Market Share by End-use Application – Animal Feed, Dietary Supplements, Food & Beverages and Cosmetics & Personal Care
Chart 43: United States Synthetic Vitamin E Market Analysis (2014-2024) by End-use Application – Animal Feed, Dietary Supplements, Food & Beverages and Cosmetics & Personal Care in USD Million
Chart 44: Glance at 2014, 2018 and 2024 United States Synthetic Vitamin E Value Market Share by End-use Application – Animal Feed, Dietary Supplements, Food & Beverages and Cosmetics & Personal Care
Canada
Chart 45: Canada Synthetic Vitamin E Market Analysis (2014-2024) by End-use Application – Animal Feed, Dietary Supplements, Food & Beverages and Cosmetics & Personal Care in Metric Tons
Chart 46: Glance at 2014, 2018 and 2024 Canada Synthetic Vitamin E Volume Market Share by End-use Application – Animal Feed, Dietary Supplements, Food & Beverages and Cosmetics & Personal Care
Chart 47: Canada Synthetic Vitamin E Market Analysis (2014-2024) by End-use Application – Animal Feed, Dietary Supplements, Food & Beverages and Cosmetics & Personal Care in USD Million
Chart 48: Glance at 2014, 2018 and 2024 Canada Synthetic Vitamin E Value Market Share by End-use Application – Animal Feed, Dietary Supplements, Food & Beverages and Cosmetics & Personal Care
Mexico
Chart 49: Mexico Synthetic Vitamin E Market Analysis (2014-2024) by End-use Application – Animal Feed, Dietary Supplements, Food & Beverages and Cosmetics & Personal Care in Metric Tons
Chart 50: Glance at 2014, 2018 and 2024 Mexican Synthetic Vitamin E Volume Market Share by End-use Application – Animal Feed, Dietary Supplements, Food & Beverages and Cosmetics & Personal Care
Chart 51: Mexico Synthetic Vitamin E Market Analysis (2014-2024) by End-use Application – Animal Feed, Dietary Supplements, Food & Beverages and Cosmetics & Personal Care in USD Million
Chart 52: Glance at 2014, 2018 and 2024 Mexican Synthetic Vitamin E Value Market Share by End-use Application – Animal Feed, Dietary Supplements, Food & Beverages and Cosmetics & Personal Care
EUROPE
Chart 53: European Synthetic Vitamin E Market (2014-2024) – Volume in Metric Tons and Value in USD Million
Chart 54: European Synthetic Vitamin E Market Analysis (2014-2024) by End-use Application – Animal Feed, Dietary Supplements, Food & Beverages and Cosmetics & Personal Care in Metric Tons
Chart 55: Glance at 2014, 2018 and 2024 European Synthetic Vitamin E Volume Market Share by End-use Application – Animal Feed, Dietary Supplements, Food & Beverages and Cosmetics & Personal Care
Chart 56: European Synthetic Vitamin E Market Analysis (2014-2024) by End-use Application – Animal Feed, Dietary Supplements, Food & Beverages and Cosmetics & Personal Care in USD Million
Chart 57: Glance at 2014, 2018 and 2024 European Synthetic Vitamin E Value Market Share by End-use Application – Animal Feed, Dietary Supplements, Food & Beverages and Cosmetics & Personal Care
Chart 58: European Synthetic Vitamin E Market Analysis (2014-2024) by Geographic Region – Germany, France, Netherlands, Spain, Italy, UK and Rest of Europe in Metric Tons
Chart 59: Glance at 2014, 2018 and 2024 European Synthetic Vitamin E Volume Market Share by Geographic Region – Germany, France, Netherlands, Spain, Italy, UK and Rest of Europe
Chart 60: European Synthetic Vitamin E Market Analysis (2014-2024) by Geographic Region – Germany, France, Netherlands, Spain, Italy, UK and Rest of Europe in USD Million
Chart 61: Glance at 2014, 2018 and 2024 European Synthetic Vitamin E Value Market Share by Geographic Region – Germany, France, Netherlands, Spain, Italy, UK and Rest of Europe
Germany
Chart 62: Germany Synthetic Vitamin E Market Analysis (2014-2024) by End-use Application – Animal Feed, Dietary Supplements, Food & Beverages and Cosmetics & Personal Care in Metric Tons
Chart 63: Glance at 2014, 2018 and 2024 Germany Synthetic Vitamin E Volume Market Share by End-use Application – Animal Feed, Dietary Supplements, Food & Beverages and Cosmetics & Personal Care
Chart 64: Germany Synthetic Vitamin E Market Analysis (2014-2024) by End-use Application – Animal Feed, Dietary Supplements, Food & Beverages and Cosmetics & Personal Care in USD Million
Chart 65: Glance at 2014, 2018 and 2024 Germany Synthetic Vitamin E Value Market Share by End-use Application – Animal Feed, Dietary Supplements, Food & Beverages and Cosmetics & Personal Care
France
Chart 66: France Synthetic Vitamin E Market Analysis (2014-2024) by End-use Application – Animal Feed, Dietary Supplements, Food & Beverages and Cosmetics & Personal Care in Metric Tons
Chart 67: Glance at 2014, 2018 and 2024 France Synthetic Vitamin E Volume Market Share by End-use Application – Animal Feed, Dietary Supplements, Food & Beverages and Cosmetics & Personal Care
Chart 68: France Synthetic Vitamin E Market Analysis (2014-2024) by End-use Application – Animal Feed, Dietary Supplements, Food & Beverages and Cosmetics & Personal Care in USD Million
Chart 69: Glance at 2014, 2018 and 2024 France Synthetic Vitamin E Value Market Share by End-use Application – Animal Feed, Dietary Supplements, Food & Beverages and Cosmetics & Personal Care
The Netherlands
Chart 70: Netherlands Synthetic Vitamin E Market Analysis (2014-2024) by End-use Application – Animal Feed, Dietary Supplements, Food & Beverages and Cosmetics & Personal Care in Metric Tons
Chart 71: Glance at 2014, 2018 and 2024 Netherlands Synthetic Vitamin E Volume Market Share by End-use Application – Animal Feed, Dietary Supplements, Food & Beverages and Cosmetics & Personal Care
Chart 72: Netherlands Synthetic Vitamin E Market Analysis (2014-2024) by End-use Application – Animal Feed, Dietary Supplements, Food & Beverages and Cosmetics & Personal Care in USD Million
Chart 73: Glance at 2014, 2018 and 2024 Netherlands Synthetic Vitamin E Value Market Share by End-use Application – Animal Feed, Dietary Supplements, Food & Beverages and Cosmetics & Personal Care
Spain
Chart 74: Spain Synthetic Vitamin E Market Analysis (2014-2024) by End-use Application – Animal Feed, Dietary Supplements, Food & Beverages and Cosmetics & Personal Care in Metric Tons
Chart 75: Glance at 2014, 2018 and 2024 Spain Synthetic Vitamin E Volume Market Share by End-use Application – Animal Feed, Dietary Supplements, Food & Beverages and Cosmetics & Personal Care
Chart 76: Spain Synthetic Vitamin E Market Analysis (2014-2024) by End-use Application – Animal Feed, Dietary Supplements, Food & Beverages and Cosmetics & Personal Care in USD Million
Chart 77: Glance at 2014, 2018 and 2024 Spain Synthetic Vitamin E Value Market Share by End-use Application – Animal Feed, Dietary Supplements, Food & Beverages and Cosmetics & Personal Care
Italy
Chart 78: Italy Synthetic Vitamin E Market Analysis (2014-2024) by End-use Application – Animal Feed, Dietary Supplements, Food & Beverages and Cosmetics & Personal Care in Metric Tons
Chart 79: Glance at 2014, 2018 and 2024 Italy Synthetic Vitamin E Volume Market Share by End-use Application – Animal Feed, Dietary Supplements, Food & Beverages and Cosmetics & Personal Care
Chart 80: Italy Synthetic Vitamin E Market Analysis (2014-2024) by End-use Application – Animal Feed, Dietary Supplements, Food & Beverages and Cosmetics & Personal Care in USD Million
Chart 81: Glance at 2014, 2018 and 2024 Italy Synthetic Vitamin E Value Market Share by End-use Application – Animal Feed, Dietary Supplements, Food & Beverages and Cosmetics & Personal Care
The United Kingdom
Chart 82: United Kingdom Synthetic Vitamin E Market Analysis (2014-2024) by End-use Application – Animal Feed, Dietary Supplements, Food & Beverages and Cosmetics & Personal Care in Metric Tons
Chart 83: Glance at 2014, 2018 and 2024 United Kingdom Synthetic Vitamin E Volume Market Share by End-use Application – Animal Feed, Dietary Supplements, Food & Beverages and Cosmetics & Personal Care
Chart 84: United Kingdom Synthetic Vitamin E Market Analysis (2014-2024) by End-use Application – Animal Feed, Dietary Supplements, Food & Beverages and Cosmetics & Personal Care in USD Million
Chart 85: Glance at 2014, 2018 and 2024 United Kingdom Synthetic Vitamin E Value Market Share by End-use Application – Animal Feed, Dietary Supplements, Food & Beverages and Cosmetics & Personal Care
Rest of Europe
Chart 86: Rest of Europe Synthetic Vitamin E Market Analysis (2014-2024) by End-use Application – Animal Feed, Dietary Supplements, Food & Beverages and Cosmetics & Personal Care in Metric Tons
Chart 87: Glance at 2014, 2018 and 2024 Rest of Europe Synthetic Vitamin E Volume Market Share by End-use Application – Animal Feed, Dietary Supplements, Food & Beverages and Cosmetics & Personal Care
Chart 88: Rest of Europe Synthetic Vitamin E Market Analysis (2014-2024) by End-use Application – Animal Feed, Dietary Supplements, Food & Beverages and Cosmetics & Personal Care in USD Million
Chart 89: Glance at 2014, 2018 and 2024 Rest of Europe Synthetic Vitamin E Value Market Share by End-use Application – Animal Feed, Dietary Supplements, Food & Beverages and Cosmetics & Personal Care
ASIA-PACIFIC
Chart 90: Asia-Pacific Synthetic Vitamin E Market (2014-2024) – Volume in Metric Tons and Value in USD Million
Chart 91: Asia-Pacific Synthetic Vitamin E Market Analysis (2014-2024) by End-use Application – Animal Feed, Dietary Supplements, Food & Beverages and Cosmetics & Personal Care in Metric Tons
Chart 92: Glance at 2014, 2018 and 2024 Asia-Pacific Synthetic Vitamin E Volume Market Share by End-use Application – Animal Feed, Dietary Supplements, Food & Beverages and Cosmetics & Personal Care
Chart 93: Asia-Pacific Synthetic Vitamin E Market Analysis (2014-2024) by End-use Application – Animal Feed, Dietary Supplements, Food & Beverages and Cosmetics & Personal Care in USD Million
Chart 94: Glance at 2014, 2018 and 2024 Asia-Pacific Synthetic Vitamin E Value Market Share by End-use Application – Animal Feed, Dietary Supplements, Food & Beverages and Cosmetics & Personal Care
Chart 95: Asia-Pacific Synthetic Vitamin E Market Analysis (2014-2024) by Geographic Region – China, India, Japan and Rest of APAC in Metric Tons
Chart 96: Glance at 2014, 2018 and 2024 Asia-Pacific Synthetic Vitamin E Volume Market Share by Geographic Region – China, India, Japan and Rest of APAC
Chart 97: Asia-Pacific Synthetic Vitamin E Market Analysis (2014-2024) by Geographic Region – China, India, Japan and Rest of APAC in USD Million
Chart 98: Glance at 2014, 2018 and 2024 Asia-Pacific Synthetic Vitamin E Value Market Share by Geographic Region – China, India, Japan and Rest of APAC
China
Chart 99: China Synthetic Vitamin E Market Analysis (2014-2024) by End-use Application – Animal Feed, Dietary Supplements, Food & Beverages and Cosmetics & Personal Care in Metric Tons
Chart 100: Glance at 2014, 2018 and 2024 China Synthetic Vitamin E Volume Market Share by End-use Application – Animal Feed, Dietary Supplements, Food & Beverages and Cosmetics & Personal Care
Chart 101: China Synthetic Vitamin E Market Analysis (2014-2024) by End-use Application – Animal Feed, Dietary Supplements, Food & Beverages and Cosmetics & Personal Care in USD Million
Chart 102: Glance at 2014, 2018 and 2024 China Synthetic Vitamin E Value Market Share by End-use Application – Animal Feed, Dietary Supplements, Food & Beverages and Cosmetics & Personal Care
India
Chart 103: India Synthetic Vitamin E Market Analysis (2014-2024) by End-use Application – Animal Feed, Dietary Supplements, Food & Beverages and Cosmetics & Personal Care in Metric Tons
Chart 104: Glance at 2014, 2018 and 2024 India Synthetic Vitamin E Volume Market Share by End-use Application – Animal Feed, Dietary Supplements, Food & Beverages and Cosmetics & Personal Care
Chart 105: India Synthetic Vitamin E Market Analysis (2014-2024) by End-use Application – Animal Feed, Dietary Supplements, Food & Beverages and Cosmetics & Personal Care in USD Million
Chart 106: Glance at 2014, 2018 and 2024 India Synthetic Vitamin E Value Market Share by End-use Application – Animal Feed, Dietary Supplements, Food & Beverages and Cosmetics & Personal Care
Japan
Chart 107: Japan Synthetic Vitamin E Market Analysis (2014-2024) by End-use Application – Animal Feed, Dietary Supplements, Food & Beverages and Cosmetics & Personal Care in Metric Tons
Chart 108: Glance at 2014, 2018 and 2024 Japan Synthetic Vitamin E Volume Market Share by End-use Application – Animal Feed, Dietary Supplements, Food & Beverages and Cosmetics & Personal Care
Chart 109 Japan Synthetic Vitamin E Market Analysis (2014-2024) by End-use Application – Animal Feed, Dietary Supplements, Food & Beverages and Cosmetics & Personal Care in USD Million
Chart 110: Glance at 2014, 2018 and 2024 Japan Synthetic Vitamin E Value Market Share by End-use Application – Animal Feed, Dietary Supplements, Food & Beverages and Cosmetics & Personal Care
Rest of Asia-Pacific
Chart 111: Rest of Asia-Pacific Synthetic Vitamin E Market Analysis (2014-2024) by End-use Application – Animal Feed, Dietary Supplements, Food & Beverages and Cosmetics & Personal Care in Metric Tons
Chart 112: Glance at 2014, 2018 and 2024 Rest of Asia-Pacific Synthetic Vitamin E Volume Market Share by End-use Application – Animal Feed, Dietary Supplements, Food & Beverages and Cosmetics & Personal Care
Chart 113: Rest of Asia-Pacific Synthetic Vitamin E Market Analysis (2014-2024) by End-use Application – Animal Feed, Dietary Supplements, Food & Beverages and Cosmetics & Personal Care in USD Million
Chart 114: Glance at 2014, 2018 and 2024 Rest of Asia-Pacific Synthetic Vitamin E Value Market Share by End-use Application – Animal Feed, Dietary Supplements, Food & Beverages and Cosmetics & Personal Care
SOUTH AMERICA
Chart 115: South American Synthetic Vitamin E Market (2014-2024) – Volume in Metric Tons and Value in USD Million
Chart 116: South American Synthetic Vitamin E Market Analysis (2014-2024) by End-use Application – Animal Feed, Dietary Supplements, Food & Beverages and Cosmetics & Personal Care in Metric Tons
Chart 117: Glance at 2014, 2018 and 2024 South American Synthetic Vitamin E Volume Market Share by End-use Application – Animal Feed, Dietary Supplements, Food & Beverages and Cosmetics & Personal Care
Chart 118: South American Synthetic Vitamin E Market Analysis (2014-2024) by End-use Application – Animal Feed, Dietary Supplements, Food & Beverages and Cosmetics & Personal Care in USD Million
Chart 119: Glance at 2014, 2018 and 2024 South American Synthetic Vitamin E Value Market Share by End-use Application – Animal Feed, Dietary Supplements, Food & Beverages and Cosmetics & Personal Care
Chart 120: South America Synthetic Vitamin E Market Analysis (2014-2024) by Geographic Region – Brazil, Argentina and Rest of SA in Metric Tons
Chart 121: Glance at 2014, 2018 and 2024 South American Synthetic Vitamin E Volume Market Share by Geographic Region – Brazil, Argentina and Rest of SA
Chart 122: South America Synthetic Vitamin E Market Analysis (2014-2024) by Geographic Region – Brazil, Argentina and Rest of SA in USD Million
Chart 123: Glance at 2014, 2018 and 2024 South American Synthetic Vitamin E Value Market Share by Geographic Region – Brazil, Argentina and Rest of SA
Brazil
Chart 124: Brazil Synthetic Vitamin E Market Analysis (2014-2024) by End-use Application – Animal Feed, Dietary Supplements, Food & Beverages and Cosmetics & Personal Care in Metric Tons
Chart 125: Glance at 2014, 2018 and 2024 Brazil Synthetic Vitamin E Volume Market Share by End-use Application – Animal Feed, Dietary Supplements, Food & Beverages and Cosmetics & Personal Care
Chart 126: Brazil Synthetic Vitamin E Market Analysis (2014-2024) by End-use Application – Animal Feed, Dietary Supplements, Food & Beverages and Cosmetics & Personal Care in USD Million
Chart 127: Glance at 2014, 2018 and 2024 Brazil Synthetic Vitamin E Value Market Share by End-use Application – Animal Feed, Dietary Supplements, Food & Beverages and Cosmetics & Personal Care
Argentina
Chart 128: Argentina Synthetic Vitamin E Market Analysis (2014-2024) by End-use Application – Animal Feed, Dietary Supplements, Food & Beverages and Cosmetics & Personal Care in Metric Tons
Chart 129: Glance at 2014, 2018 and 2024 Argentina Synthetic Vitamin E Volume Market Share by End-use Application – Animal Feed, Dietary Supplements, Food & Beverages and Cosmetics & Personal Care
Chart 130: Argentina Synthetic Vitamin E Market Analysis (2014-2024) by End-use Application – Animal Feed, Dietary Supplements, Food & Beverages and Cosmetics & Personal Care in USD Million
Chart 131: Glance at 2014, 2018 and 2024 Argentina Synthetic Vitamin E Value Market Share by End-use Application – Animal Feed, Dietary Supplements, Food & Beverages and Cosmetics & Personal Care
Rest of South America
Chart 132: Rest of South America Synthetic Vitamin E Market Analysis (2014-2024) by End-use Application – Animal Feed, Dietary Supplements, Food & Beverages and Cosmetics & Personal Care in Metric Tons
Chart 133: Glance at 2014, 2018 and 2024 Rest of South America Synthetic Vitamin E Volume Market Share by End-use Application – Animal Feed, Dietary Supplements, Food & Beverages and Cosmetics & Personal Care
Chart 134: Rest of South America Synthetic Vitamin E Market Analysis (2014-2024) by End-use Application – Animal Feed, Dietary Supplements, Food & Beverages and Cosmetics & Personal Care in USD Million
Chart 135: Glance at 2014, 2018 and 2024 Rest of South America Synthetic Vitamin E Value Market Share by End-use Application – Animal Feed, Dietary Supplements, Food & Beverages and Cosmetics & Personal Care
REST OF WORLD
Chart 136: Rest of World Synthetic Vitamin E Market (2014-2024) – Volume in Metric Tons and Value in USD Million
Chart 137: Rest of World Synthetic Vitamin E Market Analysis (2014-2024) by End-use Application – Animal Feed, Dietary Supplements, Food & Beverages and Cosmetics & Personal Care in Metric Tons
Chart 138: Glance at 2014, 2018 and 2024 Rest of World Synthetic Vitamin E Volume Market Share by End-use Application – Animal Feed, Dietary Supplements, Food & Beverages and Cosmetics & Personal Care
Chart 139: Rest of World Synthetic Vitamin E Market Analysis (2014-2024) by End-use Application – Animal Feed, Dietary Supplements, Food & Beverages and Cosmetics & Personal Care in USD Million
Chart 140: Glance at 2014, 2018 and 2024 Rest of World Synthetic Vitamin E Value Market Share by End-use Application – Animal Feed, Dietary Supplements, Food & Beverages and Cosmetics & Personal Care
BASF SE
Chongqing Southwest Synthetic Pharmaceuticals Corp Ltd
DSM Nutritional Products (Royal DSM NV)
Jilin Beisha Pharmaceutical Co., Ltd.
Mitsubishi-Chemical Foods Corporation
Zhejiang Medicine Co Ltd
Zhejiang NHU Company Ltd
SINGLE USER/ENTERPRISE LICENSE
Electronic (PDF)
Latest Version Available!
Latest version of this report is available. Click below to view report.
Latest Publication
avialable for this report
OTHER ARCHIVED REPORTS
Natural Source Vitamin E (Tocopherols and Tocotrienols) – A Global Market Overview
Report Code: PH002ARCH | Pages: 278 | Price: $2700
Published
Oct 2021

Vacuum Insulation Panels (VIPs) – A Global Market Overview-2021
Report Code: MG023ARCH | Pages: 272 | Price: $1800
Published
Jan 2021

Powder Metallurgy – A Global Market Overview
Report Code: CP057ARCH | Pages: 567 | Price: $2187
Published
Oct 2020

Hydraulic Components – A Global Market Overview
Report Code: MG014ARCH | Pages: 464 | Price: $2475
Published
Aug 2020

Global Zeolites Market – Products and Applications | Covid-19 Impact
Report Code: CP091ARCH | Pages: 450 | Price: $2475
Published
Jul 2020