Report Synopsis
Cost effectiveness, increasing geriatric population, rising incidences and prevalence of chronic ailments such as Cancer, Autoimmune Disorders and Diabetes and supportive government regulations and guidelines are some of the factors fueling the biosimilars market. Patent expiry of most of the monoclonal antibody based biologics drives the biosimilar monoclonal antibody market. Oncology biosimilar market leads the biosimilars market and is primarily driven by the rising prevalence and incidence of cancer and patent expiry of the expensive biologics. On the other hand, the growth of the biosimilars market is retarded due to insufficient regulatory guidelines, expensive research and development procedures and preference of patented products by the patients, etc.
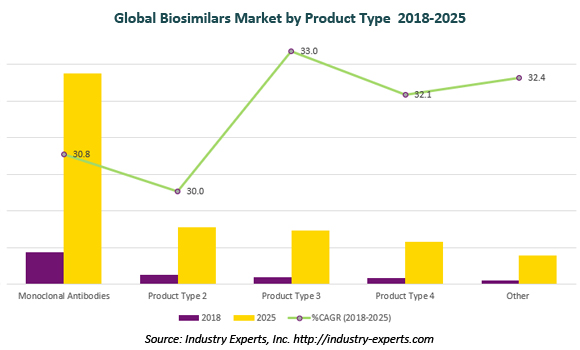
Monoclonal Antibodies constitute the single largest product type in the global Biosimilars market, demand for which is estimated at US$4.4 billion in 2018 and is projected to reach US$28.8 billion by 2025. The overall Biosimilars market in 2019 is expected to reach US$10.4 billion.
Research Findings & Coverage
- Global Biosimilars market is analyzed in this report with respect to key product types and major therapeutic areas
- The study exclusively analyzes the market for each product type and therapeutic area of Biosimilars by all major geographic regions/countries globally
- mAbs - All the Rage in Biosimilars’ New Wave
- Biosimilars Slashes the Cancer Treatment Cost
- Novel mAb’s Purification Approach to Maximize the Biosimilar Production
- Asia: A Preferred Manufacturing Hub for Biosimilars
- Key business trends focusing on product innovations/developments, M&As, JVs and other recent industry developments
- Major companies profiled – 42
- The industry guide includes the contact details for 151 companies
Product Outline
The report analyzes the market for the following key product types of Biosimilars:
- Monoclonal Antibodies (mAB)
- Erythropoietin (EPO)
- Granulocyte Colony-Stimulating Factor (G-CSF)
- Insulin
- Others (includes Interferons, Follitropins, Recombinant Proteins etc.)
Therapeutic areas of Biosimilars analyzed in this study comprise the following:
- Oncology
- Autoimmune Disorders
- Blood Disorders
- Growth Hormone Deficiency
- Others (includes Chronic Diseases, Infectious Diseases, Cardiovascular Disorders etc.)
Analysis Period, Units and Growth Rates
- The report reviews, analyzes and projects the global Biosimilars market for the period 2016-2025 in terms of US$ and the compound annual growth rates (CAGRs) projected from 2018 through 2025
Geographic Coverage
- North America (The United States, Canada and Mexico)
- Europe (Germany, the United Kingdom, France, Spain, Italy and Rest of Europe)
- Asia-Pacific (China, India, Japan, South Korea and Rest of Asia-Pacific)
- Rest of World (Brazil, Israel and Other Rest of World)
PART A: GLOBAL MARKET PERSPECTIVE
1. INTRODUCTION
1.1 Product Outline
1.1.1 Biosimilars Defined
1.1.2 Backdrop
1.1.3 The Biologics Price Competition and Innovation Act (BPCI Act)
1.1.3.1 Data Exclusivity
1.1.4 Steps Involved in Biosimilar Synthesis
1.1.5 Key Regulatory Authorization Pathway – Synopsis
1.1.6 Biosimilars Types
1.1.6.1 Monoclonal Antibodies (mAB or moAB)
1.1.6.1.1 Production Process
1.1.6.1.1.1 Hybridoma Cell Production
1.1.6.1.2 Therapeutic Applications
1.1.6.2 Erythropoietin (EPO)
1.1.6.2.1 Functions of EPO
1.1.6.2.2 Mechanism of Action
1.1.6.2.3 Synthesis and Regulation
1.1.6.2.4 Uses in Medicine
1.1.6.3 Granulocyte Colony-Stimulating Factor (G-CSF)
1.1.6.3.1 Biological Function
1.1.6.3.2 Genetics
1.1.6.3.3 Use in Therapeutics
1.1.6.4 Insulin
1.1.6.4.1 Biosimilar Insulin
1.1.6.4.2 The Complexity in Producing Biosimilar Insulin
1.1.6.4.3 Biosimilar Insulins and the Regulatory Environment Surrounding Them
1.1.6.4.4 The Market for Biosimilar Insulins
1.1.6.5 Interferons
1.1.6.5.1 Interferon Categorization
1.1.6.5.2 Functions of Interferons
1.1.6.5.3 Interferon Alfa
1.1.6.5.4 Interferon Beta-1a
1.1.6.5.5 Interferon Gamma
1.1.6.6 Human Growth Hormone
1.1.6.6.1 Recombinant Human Growth Hormone
1.1.6.6.2 Managing Growth Disorders Using Recombinant Human Growth Hormone Biosimilars
1.1.6.7 Other Biosimilars
1.1.7 Biosimilars Therapeutic Areas
1.1.7.1 Oncology
1.1.7.1.1 Biosimilar G-CSF
1.1.7.2 Autoimmune Diseases
1.1.7.3 Blood Disorders
1.1.7.4 Growth Hormone Deficiency (GHD)
1.1.7.4.1 Growth Hormone Deficiency in Children
1.1.7.5 Infectious Diseases
1.1.7.5.1 Treatment of Infectious Diseases
2. REGULATORY LANDSCAPE
2.1 The United States Food and Drug Administration (USFDA)
2.1.1 Scientific Considerations in Demonstrating Biosimilarity to a Reference Product
2.1.2 Quality Considerations in Demonstrating Biosimilarity to a Reference Protein Product
2.1.3 Biosimilars: Questions and Answers Regarding Implementation of the Biologics Price Competition and Innovation Act of 2009
2.2 European Medicines Agency (EMA)
2.3 The World Health Organization (WHO)
2.4 Canada
2.5 South Korea
2.6 China
2.7 India
2.8 Japan
2.9 Mexico
2.10 Brazil
2.11 Argentina
3. KEY MARKET TRENDS
3.1 mAbs - All The Rage In Biosimilars’ New Wave
3.1.1 The Buildup to the Biosimilar Industry
3.1.2 Current Players: A Sneak Preview
3.2 Biosimilars Slashes the Cancer Treatment Cost
3.3 Emerging Markets to Drive Biosimilars Growth
3.4 Asia: A Preferred Manufacturing Hub for Biosimilars
3.5 SPC Manufacturing Waiver Initiated by EU Commission
3.6 Novel mAb’s Purification Approach to Maximize the Biosimilar Production
3.7 Biosimilars and �Patent Dance�
4. RECENT BIOSIMILARS APPROVALS
5. KEY GLOBAL PLAYERS
Adello Biologics (United States)
Amgen Inc. (United States)
AXXO GmbH (Germany)
BIOCAD (Russia)
Biogen, Inc. (United States)
CoherusBioSciences (United States)
Creative BioMart (United States)
Dong-A Socio Group (South Korea)
Dr. Reddy's Laboratories Ltd. (India)
Eli Lilly and Company (United States)
Genor Biopharma Co., Ltd. (China)
Hetero Drugs Limited (India)
Insud Pharma SL (Spain)
mAbxience SA (Spain)
Intas Pharmaceuticals Ltd. (India)
LG Chem (South Korea)
Lupin Limited (India)
Mylan, Inc (United States)
Nippon Kayaku Co., Ltd. (Japan)
Pfizer, Inc. (United States)
Reliance Life Sciences Pvt. Ltd. (India)
Sandoz International GmbH (Germany)
Shanghai Henlius Biotech, Inc. (China)
STADA Arzneimittel AG (Germany)
Teva Pharmaceutical Industries Limited (Israel)
Wockhardt Limited (India)
Zydus Cadila (India)
6. KEY BUSINESS AND PRODUCT TRENDS
Samsung Bioepis Signs Biosimilars Development and Marketing Agreement with C-Bridge Capital
Biosimilar Association of Samsung Bioepis and 3SBio
Kashiv Pharma Renamed as KashivBioSciences After Acquiring Adello Biologics
Japanese Release of Trastuzumab and Agalsidase Beta Biosimilar
Epoetin Alfa and Pegfilgrastim Biosimilars Now Accessible In the US at Considerable Concession
Biosimilars of Insulin Glargine Introduced in South Korea and the UK
CNDA Accepted Review of Adalimumab Biosimilar
Filgrastim Biosimilar Application Submitted to the US FDA
European Commercial Release of Amgevita and Imraldi
MHLW of Japan Received Approval Application for Dual Darbepoetin Alfa Copy Biologics
Evaluation of Adalimumab Biosimilar SB5 by USFDA
Acceptance of Approval Application by CFDA for Adalimumab Biosimilar
Review Acceptance for Mabion CD20 by EMA and Rituxan Expanded the Therapeutic Range
Dr Reddy’s Introduces Hervycta, A Trastuzumab Biosimilar in India
Resubmission of Marketing Approval of Biosimilar Rituximab to FDA by Celltrion
Refusal of Trastuzumab and Rituximab Biosimilars Approval Applications by FDA
Rejection of Rituximab and Trastuzumab of Celltrion/Teva by FDA
Ontruzant Trastuzumab Biosimilar Released in the UK
Commercialization of Trastuzumab Biosimilar in South Korea By Daewoong
Commercial Release of Adalimumab Biosimilar in India by Hetero
Production of Denosumab Biosimilar in Australia
Acceptance of Applications for Adalimumab and Trastuzumab by FDA
USV’s Filing for Pegfilgrastim Accepted by EMA
Acceptance of Pegfilgrastim and Trastuzumab Fillings by EMA
Introduction of Krabeva, a Bevacizumab Biosimilar, in India
Pegfilgrastim Filling Acceptance by EMA
Danish Company Appeals FDA for Clinical Studies Data of Victoza Copy Biologics
Postponement of Pegfilgrastim Biosimilar Approval of Biocon/Mylan by FDA
Acceptance of Pegfilgrastim Biosimilar Filling of Cinfa by EMA
The US Commercial Release of Adalimumab Biosimilar of Amgen After January 2023
Submission of Approval Application by JCR for Agalsidase Beta Biosimilar in Japan
Acceptance of Approval Filing of Filgrastim Biosimilar of Adello by FDA
Application Acceptance of Sandoz’s Rituximab Biosimilar by FDA
Successful Submission of Dual Trastuzumab Biosimilar to the US FDA for Review
Biosimilar Business of Merck Taken Over by Fresenius Kabi
Merck Introduces RENFLEXIS in the US Market
Initiation of Phase III Interchangeability Study of Adalimumab Biosimilar by Boehringer
Acceptance of Regulatory Submission for Rituximab Biosimilar of Celltrion/Teva by FDA
Refusal of Approval Application of Epoetin Alfa Biosimilar of Pfizer by FDA
Registration of Biocad’s Rituximab Biosimilars in Honduras and Bolivia
Re-evaluation of Bevacizumab and Trastuzumab by FDA Advisory Board
Rejection of Pegfilgrastim Biosimilar of Coherus by FDA
EMA Acceptance of Sandoz’s Adalimumab and Infliximab Biosimilars for Re-evaluation
Epoetin Alfa of Pfizer Receives Approval Recommendation from FDA Advisors
Approval Application Acceptance of Fujifilm’s Adalimumab Biosimilar by EMA
Australian Commercial Release of Infliximab Biosimilar in Second half of 2017
Submission of Approval Application in Japan for Trastuzumab Biosimilar
Introduction of Basal Analogue Insulin Biosimilar in Indonesia
Acceptance of Pegfilgrastim Filling of Mylan/Biocon by FDA
Japanese Approval Application Filed for Etanercept Biosimilar
Filing of Biosimilar Adalimumab Application by Boehringer to FDA and EMA As Well
Withdrawal of Biosimilar Pegfilgrastim Application by Sandoz
7. GLOBAL MARKET OVERVIEW
7.1 Global Biosimilars Market Overview by Product Type
7.1.1 Global Biosimilars Product Types Market Overview by Geographic Region
7.1.1.1 Monoclonal Antibodies
7.1.1.2 Erythropoietin
7.1.1.3 G-CSF
7.1.1.4 Insulin
7.1.1.5 Other Product Types
7.2 Global Biosimilars Market Overview by Therapeutic Area
7.2.1 Global Biosimilars Therapeutic Area Market Overview by Geographic Region
7.2.1.1 Oncology
7.2.1.2 Autoimmune Disorders
7.2.1.3 Blood Disorders
7.2.1.4 Growth Hormone Deficiency
7.2.1.5 Other Therapeutic Areas
PART B: REGIONAL MARKET PERSPECTIVE
REGIONAL MARKET OVERVIEW
8. EUROPE
8.1 European Biosimilars Market Overview by Geographic Region
8.2 European Biosimilars Market Overview by Product Type
8.2.1 European Biosimilars Product Types Market Overview by Geographic Region
8.2.1.1 Monoclonal Antibodies
8.2.1.2 Erythropoietin
8.2.1.3 G-CSF
8.2.1.4 Insulin
8.2.1.5 Other Product Types
8.3 European Biosimilars Market Overview by Therapeutic Area
8.3.1 European Biosimilars Therapeutic Area Market Overview by Geographic Region
8.3.1.1 Oncology
8.3.1.2 Autoimmune Disorders
8.3.1.3 Blood Disorders
8.3.1.4 Growth Hormone Deficiency
8.3.1.5 Other Therapeutic Areas
8.4 Major Market Players
Alvotech (Iceland)
AXXO GmbH (Germany)
BIOCAD (Russia)
Insud Pharma SL (Spain)
mAbxience SA (Spain)
Sandoz International GmbH (Germany)
STADA Arzneimittel AG (Germany)
UGA Biopharma GmbH (Germany)
8.5 Country-wise analysis of European Biosimilars Market
8.5.1 Germany
8.5.1.1 German Biosimilars Market Overview by Product Type
8.5.1.2 German Biosimilars Market Overview by Therapeutic Area
8.5.2 United Kingdom
8.5.2.1 United Kingdom Biosimilars Market Overview by Product Type
8.5.2.2 United Kingdom Biosimilars Market Overview by Therapeutic Area
8.5.3 France
8.5.3.1 French Biosimilars Market Overview by Product Type
8.5.3.2 French Biosimilars Market Overview by Therapeutic Area
8.5.4 Spain
8.5.4.1 Spanish Biosimilars Market Overview by Product Type
8.5.4.2 Spanish Biosimilars Market Overview by Therapeutic Area
8.5.5 Italy
8.5.5.1 Italian Biosimilars Market Overview by Product Type
8.5.5.2 Italian Biosimilars Market Overview by Therapeutic Area
8.5.6 Rest of Europe
8.5.6.1 Rest of Europe Biosimilars Market Overview by Product Type
8.5.6.2 Rest of Europe Biosimilars Market Overview by Therapeutic Area
9. NORTH AMERICA
9.1 North American Biosimilars Market Overview by Geographic Region
9.2 North American Biosimilars Market Overview by Product Type
9.2.1 North American Biosimilars Product Types Market Overview by Geographic Region
9.2.1.1 Monoclonal Antibodies
9.2.1.2 Erythropoietin
9.2.1.3 G-CSF
9.2.1.4 Insulin
9.2.1.5 Other Product Types
9.3 North American Biosimilars Market Overview by Therapeutic Area
9.3.1 North American Biosimilars Therapeutic Area Market Overview by Geographic Region
9.3.1.1 Oncology
9.3.1.2 Autoimmune Disorders
9.3.1.3 Blood Disorders
9.3.1.4 Growth Hormone Deficiency
9.3.1.5 Other Therapeutic Areas
9.4 Major Market Players
Adello Biologics (United States)
Amgen Inc. (United States)
Biogen, Inc. (United States)
CoherusBioSciences(United States)
Creative BioMart(United States)
Eli Lilly and Company (United States)
Harvest Moon Pharmaceuticals USA, Inc. (United States)
Momenta Pharmaceuticals Inc. (United States)
Mylan, Inc (United States)
Pfizer, Inc. (United States)
9.5 Country-wise Analysis of North American Biosimilars Market
9.5.1 The United States
9.5.1.1 United States Biosimilars Market Overview by Product Type
9.5.1.2 United States Biosimilars Market Overview by Therapeutic Area
9.5.2 Canada
9.5.2.1 Canadian Biosimilars Market Overview by Product Type
9.5.2.2 Canadian Biosimilars Market Overview by Therapeutic Area
9.5.3 Mexico
9.5.3.1 Mexican Biosimilars Market Overview by Product Type
9.5.3.2 Mexican Biosimilars Market Overview by Therapeutic Area
10. ASIA-PACIFIC
10.1 Asia-Pacific Biosimilars Market Overview by Geographic Region
10.2 Asia-Pacific Biosimilars Market Overview by Product Type
10.2.1 Asia-Pacific Biosimilars Product Types Market Overview by Geographic Region
10.2.1.1 Monoclonal Antibodies
10.2.1.2 Erythropoietin
10.2.1.3 G-CSF
10.2.1.4 Insulin
10.2.1.5 Other Product Types
10.3 Asia-Pacific Biosimilars Market Overview by Therapeutic Area
10.3.1 Asia-Pacific Biosimilars Therapeutic Area Market Overview by Geographic Region
10.3.1.1 Oncology
10.3.1.2 Autoimmune Disorders
10.3.1.3 Blood Disorders
10.3.1.4 Growth Hormone Deficiency
10.3.1.5 Other Therapeutic Areas
10.4 Major Market Players
3SBIO, Inc (China)
Biocon Limited (India)
Biogenomics Limited (India)
Bioviz Technologies Pvt. Ltd. (India)
Celltrion, Inc. (South Korea)
Dong-A Socio Group (South Korea)
Dr. Reddy's Laboratories Ltd. (India)
Fujifilm Kyowa Kirin Biologics Co., Ltd. (Japan)
Genor Biopharma Co., Ltd. (China)
Hetero Drugs Limited (India)
Intas Pharmaceuticals Ltd (India)
LG Chem (South Korea)
Lupin Limited (India)
Nippon Kayaku Co., Ltd. (Japan)
Reliance Life Sciences Pvt. Ltd. (India)
Samsung Bioepis Co., Ltd. (South Korea)
SciGen Pte. Ltd. (Singapore)
Shanghai Henlius Biotech, Inc. (China)
Siam Bioscience Co., Ltd. (Thailand)
Wockhardt Limited (India)
YL Biologics Limited (Japan)
Zydus Cadila (India)
10.5 Country-wise Analysis of Asia-Pacific Biosimilars Market
10.5.1 China
10.5.1.1 Chinese Biosimilars Market Overview by Product Type
10.5.1.2 Chinese Biosimilars Market Overview by Therapeutic Area
10.5.2 India
10.5.2.1 Indian Biosimilars Market Overview by Product Type
10.5.2.2 Indian Biosimilars Market Overview by Therapeutic Area
10.5.3 Japan
10.5.3.1 Japanese Biosimilars Market Overview by Product Type
10.5.3.2 Japanese Biosimilars Market Overview by Therapeutic Area
10.5.4 South Korea
10.5.4.1 South Korean Biosimilars Market Overview by Product Type
10.5.4.2 South Korean Biosimilars Market Overview by Therapeutic Area
10.5.5 Rest of Asia-Pacific
10.5.5.1 Rest of Asia-Pacific Biosimilars Market Overview by Product Type
10.5.5.12 Rest of Asia-Pacific Biosimilars Market Overview by Therapeutic Area
11. REST OF WORLD
11.1 Rest of World Biosimilars Market Overview by Geographic Region
11.2 Rest of World Biosimilars Market Overview by Product Type
11.2.1 Rest of World Biosimilars Product Types Market Overview by Geographic Region
11.2.1.1 Monoclonal Antibodies
11.2.1.2 Erythropoietin
11.2.1.3 G-CSF
11.2.1.4 Insulin
11.2.1.5 Other Product Types
11.3 Rest of World Biosimilars Market Overview by Therapeutic Area
11.3.1 Rest of World Biosimilars Therapeutic Area Market Overview by Geographic Region
11.3.1.1 Oncology
11.3.1.2 Autoimmune Disorders
11.3.1.3 Blood Disorders
11.3.1.4 Growth Hormone Deficiency
11.3.1.5 Other Therapeutic Areas
11.4 Major Market Players
AMEGA Biotech (Argentina)
Teva Pharmaceutical Industries Limited (Israel)
11.5 Country-wise Analysis of Rest of World Biosimilars Market
11.5.1 Brazil
11.5.1.1 Brazilian Biosimilars Market Overview by Product Type
11.5.1.2 Brazilian Biosimilars Market Overview by Therapeutic Area
11.5.2 Israel
11.5.2.1 Israeli Biosimilars Market Overview by Product Type
11.5.2.2 Israeli Biosimilars Market Overview by Therapeutic Area
11.5.3 Other Countries
11.5.3.1 Other Countries Biosimilars Market Overview by Product Type
11.5.3.2 Other Countries Biosimilars Market Overview by Therapeutic Area
PART C: GUIDE TO THE INDUSTRY
1. NORTH AMERICA
2. EUROPE
3. ASIA-PACIFIC
4. REST OF WORLD
PART D: ANNEXURE
1. RESEARCH METHODOLOGY
2. FEEDBACK
Charts & Graphs
PART A: GLOBAL MARKET PERSPECTIVE
Chart 1: Global Biosimilars Market (2018 & 2025) by Geographic Region
Chart 2: Global Biosimilars Market (2018 & 2025) by Product Type
Chart 3: Global Biosimilars Market (2018 & 2025) by Therapeutic Areas
Chart 4: Global Biosimilars Market Analysis (2016-2025) in USD Million
Chart 5: Global Biosimilars Market Analysis (2016-2025) by Product Type - Monoclonal Antibodies, Erythropoietin, G-CSF, Insulin and Other in USD Million
Chart 6: Glance at 2016, 2019 and 2025 Global Biosimilars Market Share (%) by Product Type - Monoclonal Antibodies, Erythropoietin, G-CSF, Insulin and Other
Chart 7: Global Biosimilar Monoclonal Antibodies Market Analysis (2016-2025) by Geographic Region - Europe, North America, Asia-Pacific and Rest of World in USD Million
Chart 8: Glance at 2016, 2019 and 2025 Global Biosimilar Monoclonal Antibodies Market Share (%) by Geographic Region - Europe, North America, Asia-Pacific and Rest of World
Chart 9: Global Biosimilar Erythropoietin Market Analysis (2016-2025) by Geographic Region - Europe, North America, Asia-Pacific and Rest of World in US$ Million
Chart 10: Glance at 2016, 2019 and 2025 Global Biosimilar Erythropoietin Market Share (%) by Geographic Region - Europe, North America, Asia-Pacific and Rest of World
Chart 11: Global Biosimilar G-CSF Market Analysis (2016-2025) by Geographic Region - Europe, North America, Asia-Pacific and Rest of World in US$ Million
Chart 12: Glance at 2016, 2019 and 2025 Global Biosimilar G-CSF Market Share (%) by Geographic Region - Europe, North America, Asia-Pacific and Rest of World
Chart 13: Global Biosimilar Insulin Market Analysis (2016-2025) by Geographic Region - Europe, North America, Asia-Pacific and Rest of World in US$ Million
Chart 14: Glance at 2016, 2019 and 2025 Global Biosimilar Insulin Market Share (%) by Geographic Region - Europe, North America, Asia-Pacific and Rest of World
Chart 15: Global Other Biosimilar Product Types Market Analysis (2016-2025) by Geographic Region - Europe, North America, Asia-Pacific and Rest of World in US$ Million
Chart 16: Glance at 2016, 2019 and 2025 Global Other Biosimilar Products Types Market Share (%) by Geographic Region - Europe, North America, Asia-Pacific and Rest of World
Chart 17: Global Biosimilars Market Analysis (2016-2025) by Therapeutic Area - Oncology, Autoimmune Disorders, Blood Disorders, Growth Hormone Deficiency and Other in USD Million
Chart 18: Glance at 2016, 2019 and 2025 Global Biosimilars Market Share (%) by Therapeutic Area - Oncology, Autoimmune Disorders, Blood Disorders, Growth Hormone Deficiency and Other
Chart 19: Global Biosimilars Market Analysis (2016-2025) in Oncology by Geographic Region - Europe, North America, Asia-Pacific and Rest of World in US$ Million
Chart 20: Glance at 2016, 2019 and 2025 Global Biosimilars Market Share (%) in Oncology by Geographic Region - Europe, North America, Asia-Pacific and Rest of World
Chart 21: Global Biosimilars Market Analysis (2016-2025) in Autoimmune Disorders by Geographic Region - Europe, North America, Asia-Pacific and Rest of World in US$ Million
Chart 22: Glance at 2016, 2019 and 2025 Global Biosimilars Market Share (%) in Autoimmune Disorders by Geographic Region - Europe, North America, Asia-Pacific and Rest of World
Chart 23: Global Biosimilars Market Analysis (2016-2025) in Blood Disorders by Geographic Region - Europe, North America, Asia-Pacific and Rest of World in US$ Million
Chart 24: Glance at 2016, 2019 and 2025 Global Biosimilars Market Share (%) in Blood Disorders by Geographic Region - Europe, North America, Asia-Pacific and Rest of World
Chart 25: Global Biosimilars Market Analysis (2016-2025) in Growth Hormone Deficiency by Geographic Region - Europe, North America, Asia-Pacific and Rest of World in US$ Million
Chart 26: Glance at 2016, 2019 and 2025 Global Biosimilars Market Share (%) in Growth Hormone Deficiency by Geographic Region - Europe, North America, Asia-Pacific and Rest of World
Chart 27: Global Biosimilars Market Analysis (2016-2025) in Other Therapeutic Areas by Geographic Region - Europe, North America, Asia-Pacific and Rest of World in US$ Million
Chart 28: Glance at 2016, 2019 and 2025 Global Biosimilars Market Share (%) in Other Therapeutic Areas by Geographic Region - Europe, North America, Asia-Pacific and Rest of World
PART B: REGIONAL MARKET PERSPECTIVE
Chart 29: Global Biosimilars Market Analysis (2016-2025) by Geographic Region - Europe, North America, Asia-Pacific and Rest of World in USD Million
Chart 30: Glance at 2016, 2019 and 2025 Global Biosimilars Market Share (%) by Geographic Region - Europe, North America, Asia-Pacific and Rest of World
REGIONAL MARKET OVERVIEW
EUROPE
Chart 31: European Biosimilars Market Analysis (2016-2025) in USD Million
Chart 32: European Biosimilars Market Analysis (2016-2025) by Geographic Region - Germany, United Kingdom, France, Spain, Italy and Rest of Europe in USD Million
Chart 33: Glance at 2016, 2019 and 2025 European Biosimilars Market Share (%) by Geographic Region - Germany, United Kingdom, France, Spain, Italy and Rest of Europe
Chart 34: European Biosimilars Market Analysis (2016-2025) by Product Type - Monoclonal Antibodies, Erythropoietin, G-CSF, Insulin and Other in USD Million
Chart 35: Glance at 2016, 2019 and 2025 European Biosimilars Market Share (%) by Product Type - Monoclonal Antibodies, Erythropoietin, G-CSF, Insulin and Other
Chart 36: European Biosimilar Monoclonal Antibodies Market Analysis (2016-2025) by Geographic Region - Germany, United Kingdom, France, Spain, Italy and Rest of Europe in USD Million
Chart 37: Glance at 2016, 2019 and 2025 European Biosimilar Monoclonal Antibodies Market Share (%) by Geographic Region - Germany, United Kingdom, France, Spain, Italy and Rest of Europe
Chart 38: European Biosimilar Erythropoietin Market Analysis (2016-2025) by Geographic Region - Germany, United Kingdom, France, Spain, Italy and Rest of Europe in US$ Million
Chart 39: Glance at 2016, 2019 and 2025 European Biosimilar Erythropoietin Market Share (%) by Geographic Region - Germany, United Kingdom, France, Spain, Italy and Rest of Europe
Chart 40: European Biosimilar G-CSF Market Analysis (2016-2025) by Geographic Region - Germany, United Kingdom, France, Spain, Italy and Rest of Europe in US$ Million
Chart 41: Glance at 2016, 2019 and 2025 European Biosimilar G-CSF Market Share (%) by Geographic Region - Germany, United Kingdom, France, Spain, Italy and Rest of Europe
Chart 42: European Biosimilar Insulin Market Analysis (2016-2025) by Geographic Region - Germany, United Kingdom, France, Spain, Italy and Rest of Europe in US$ Million
Chart 43: Glance at 2016, 2019 and 2025 European Biosimilar Insulin Market Share (%) by Geographic Region - Germany, United Kingdom, France, Spain, Italy and Rest of Europe
Chart 44: European Other Biosimilar Product Types Market Analysis (2016-2025) by Geographic Region - Germany, United Kingdom, France, Spain, Italy and Rest of Europe in US$ Million
Chart 45: Glance at 2016, 2019 and 2025 European Other Biosimilar Products Types Market Share (%) by Geographic Region - Germany, United Kingdom, France, Spain, Italy and Rest of Europe
Chart 46: European Biosimilars Market Analysis (2016-2025) by Therapeutic Area - Oncology, Autoimmune Disorders, Blood Disorders, Growth Hormone Deficiency and Other in USD Million
Chart 47: Glance at 2016, 2019 and 2025 European Biosimilars Market Share (%) by Therapeutic Area - Oncology, Autoimmune Disorders, Blood Disorders, Growth Hormone Deficiency and Other
Chart 48: European Biosimilars Market Analysis (2016-2025) in Oncology by Geographic Region - Germany, United Kingdom, France, Spain, Italy and Rest of Europe in US$ Million
Chart 49: Glance at 2016, 2019 and 2025 European Biosimilars Market Share (%) in Oncology by Geographic Region - Germany, United Kingdom, France, Spain, Italy and Rest of Europe
Chart 50: European Biosimilars Market Analysis (2016-2025) in Autoimmune Disorders by Geographic Region - Germany, United Kingdom, France, Spain, Italy and Rest of Europe in US$ Million
Chart 51: Glance at 2016, 2019 and 2025 European Biosimilars Market Share (%) in Autoimmune Disorders by Geographic Region - Germany, United Kingdom, France, Spain, Italy and Rest of Europe
Chart 52: European Biosimilars Market Analysis (2016-2025) in Blood Disorders by Geographic Region - Germany, United Kingdom, France, Spain, Italy and Rest of Europe in US$ Million
Chart 53: Glance at 2016, 2019 and 2025 European Biosimilars Market Share (%) in Blood Disorders by Geographic Region - Germany, United Kingdom, France, Spain, Italy and Rest of Europe
Chart 54: European Biosimilars Market Analysis (2016-2025) in Growth Hormone Deficiency by Geographic Region - Germany, United Kingdom, France, Spain, Italy and Rest of Europe in US$ Million
Chart 55: Glance at 2016, 2019 and 2025 European Biosimilars Market Share (%) in Growth Hormone Deficiency by Geographic Region - Germany, United Kingdom, France, Spain, Italy and Rest of Europe
Chart 56: European Biosimilars Market Analysis (2016-2025) in Other Therapeutic Areas by Geographic Region - Germany, United Kingdom, France, Spain, Italy and Rest of Europe in US$ Million
Chart 57: Glance at 2016, 2019 and 2025 European Biosimilars Market Share (%) in Other Therapeutic Areas by Geographic Region - Germany, United Kingdom, France, Spain, Italy and Rest of Europe
Germany
Chart 58: German Biosimilars Market Analysis (2016-2025) in USD Million
Chart 59: German Biosimilars Market Analysis (2016-2025) by Product Type - Monoclonal Antibodies, Erythropoietin, G-CSF, Insulin and Other in USD Million
Chart 60: Glance at 2016, 2019 and 2025 German Biosimilars Market Share (%) by Product Type - Monoclonal Antibodies, Erythropoietin, G-CSF, Insulin and Other
Chart 61: German Biosimilars Market Analysis (2016-2025) by Therapeutic Area - Oncology, Autoimmune Disorders, Blood Disorders, Growth Hormone Deficiency and Other in USD Million
Chart 62: Glance at 2016, 2019 and 2025 German Biosimilars Market Share (%) by Therapeutic Area - Oncology, Autoimmune Disorders, Blood Disorders, Growth Hormone Deficiency and Other
United Kingdom
Chart 63: United Kingdom Biosimilars Market Analysis (2016-2025) in USD Million
Chart 64: United Kingdom Biosimilars Market Analysis (2016-2025) by Product Type - Monoclonal Antibodies, Erythropoietin, G-CSF, Insulin and Other in USD Million
Chart 65: Glance at 2016, 2019 and 2025 United Kingdom Biosimilars Market Share (%) by Product Type - Monoclonal Antibodies, Erythropoietin, G-CSF, Insulin and Other
Chart 66: United Kingdom Biosimilars Market Analysis (2016-2025) by Therapeutic Area - Oncology, Autoimmune Disorders, Blood Disorders, Growth Hormone Deficiency and Other in USD Million
Chart 67: Glance at 2016, 2019 and 2025 United Kingdom Biosimilars Market Share (%) by Therapeutic Area - Oncology, Autoimmune Disorders, Blood Disorders, Growth Hormone Deficiency and Other
France
Chart 68: French Biosimilars Market Analysis (2016-2025) in USD Million
Chart 69: French Biosimilars Market Analysis (2016-2025) by Product Type - Monoclonal Antibodies, Erythropoietin, G-CSF, Insulin and Other in USD Million
Chart 70: Glance at 2016, 2019 and 2025 French Biosimilars Market Share (%) by Product Type - Monoclonal Antibodies, Erythropoietin, G-CSF, Insulin and Other
Chart 71: French Biosimilars Market Analysis (2016-2025) by Therapeutic Area - Oncology, Autoimmune Disorders, Blood Disorders, Growth Hormone Deficiency and Other in USD Million
Chart 72: Glance at 2016, 2019 and 2025 French Biosimilars Market Share (%) by Therapeutic Area - Oncology, Autoimmune Disorders, Blood Disorders, Growth Hormone Deficiency and Other
Spain
Chart 73: Spanish Biosimilars Market Analysis (2016-2025) in USD Million
Chart 74: Spanish Biosimilars Market Analysis (2016-2025) by Product Type - Monoclonal Antibodies, Erythropoietin, G-CSF, Insulin and Other in USD Million
Chart 75: Glance at 2016, 2019 and 2025 Spanish Biosimilars Market Share (%) by Product Type - Monoclonal Antibodies, Erythropoietin, G-CSF, Insulin and Other
Chart 76: Spanish Biosimilars Market Analysis (2016-2025) by Therapeutic Area - Oncology, Autoimmune Disorders, Blood Disorders, Growth Hormone Deficiency and Other in USD Million
Chart 77: Glance at 2016, 2019 and 2025 Spanish Biosimilars Market Share (%) by Therapeutic Area - Oncology, Autoimmune Disorders, Blood Disorders, Growth Hormone Deficiency and Other
Italy
Chart 78: Italian Biosimilars Market Analysis (2016-2025) in USD Million
Chart 79: Italian Biosimilars Market Analysis (2016-2025) by Product Type - Monoclonal Antibodies, Erythropoietin, G-CSF, Insulin and Other in USD Million
Chart 80: Glance at 2016, 2019 and 2025 Italian Biosimilars Market Share (%) by Product Type - Monoclonal Antibodies, Erythropoietin, G-CSF, Insulin and Other
Chart 81: Italian Biosimilars Market Analysis (2016-2025) by Therapeutic Area - Oncology, Autoimmune Disorders, Blood Disorders, Growth Hormone Deficiency and Other in USD Million
Chart 82: Glance at 2016, 2019 and 2025 Italian Biosimilars Market Share (%) by Therapeutic Area - Oncology, Autoimmune Disorders, Blood Disorders, Growth Hormone Deficiency and Other
Rest of Europe
Chart 83: Rest of Europe Biosimilars Market Analysis (2016-2025) in USD Million
Chart 84: Rest of Europe Biosimilars Market Analysis (2016-2025) by Product Type - Monoclonal Antibodies, Erythropoietin, G-CSF, Insulin and Other in USD Million
Chart 85: Glance at 2016, 2019 and 2025 Rest of Europe Biosimilars Market Share (%) by Product Type - Monoclonal Antibodies, Erythropoietin, G-CSF, Insulin and Other
Chart 86: Rest of Europe Biosimilars Market Analysis (2016-2025) by Therapeutic Area - Oncology, Autoimmune Disorders, Blood Disorders, Growth Hormone Deficiency and Other in USD Million
Chart 87: Glance at 2016, 2019 and 2025 Rest of Europe Biosimilars Market Share (%) by Therapeutic Area - Oncology, Autoimmune Disorders, Blood Disorders, Growth Hormone Deficiency and Other
NORTH AMERICA
Chart 88: North American Biosimilars Market Analysis (2016-2025) in USD Million
Chart 89: North American Biosimilars Market Analysis (2016-2025) by Geographic Region - United States, Canada and Mexico in USD Million
Chart 90: Glance at 2016, 2019 and 2025 North American Biosimilars Market Share (%) by Geographic Region - United States, Canada and Mexico
Chart 91: North American Biosimilars Market Analysis (2016-2025) by Product Type - Monoclonal Antibodies, Erythropoietin, G-CSF, Insulin and Other in USD Million
Chart 92: Glance at 2016, 2019 and 2025 North American Biosimilars Market Share (%) by Product Type - Monoclonal Antibodies, Erythropoietin, G-CSF, Insulin and Other
Chart 93: North American Biosimilar Monoclonal Antibodies Market Analysis (2016-2025) by Geographic Region - United States, Canada and Mexico in USD Million
Chart 94: Glance at 2016, 2019 and 2025 North American Biosimilar Monoclonal Antibodies Market Share (%) by Geographic Region - United States, Canada and Mexico
Chart 95: North American Biosimilar Erythropoietin Market Analysis (2016-2025) by Geographic Region - United States, Canada and Mexico in US$ Million
Chart 96: Glance at 2016, 2019 and 2025 North American Biosimilar Erythropoietin Market Share (%) by Geographic Region - United States, Canada and Mexico
Chart 97: North American Biosimilar G-CSF Market Analysis (2016-2025) by Geographic Region - United States, Canada and Mexico in US$ Million
Chart 98: Glance at 2016, 2019 and 2025 North American Biosimilar G-CSF Market Share (%) by Geographic Region - United States, Canada and Mexico
Chart 99: North American Biosimilar Insulin Market Analysis (2016-2025) by Geographic Region - United States, Canada and Mexico in US$ Million
Chart 100: Glance at 2016, 2019 and 2025 North American Biosimilar Insulin Market Share (%) by Geographic Region - United States, Canada and Mexico
Chart 101: North American Other Biosimilar Product Types Market Analysis (2016-2025) by Geographic Region - United States, Canada and Mexico in US$ Million
Chart 102: Glance at 2016, 2019 and 2025 North American Other Biosimilar Products Types Market Share (%) by Geographic Region - United States, Canada and Mexico
Chart 103: North American Biosimilars Market Analysis (2016-2025) by Therapeutic Area - Oncology, Autoimmune Disorders, Blood Disorders, Growth Hormone Deficiency and Other in USD Million
Chart 104: Glance at 2016, 2019 and 2025 North American Biosimilars Market Share (%) by Therapeutic Area - Oncology, Autoimmune Disorders, Blood Disorders, Growth Hormone Deficiency and Other
Chart 105: North American Biosimilars Market Analysis (2016-2025) in Oncology by Geographic Region - United States, Canada and Mexico in US$ Million
Chart 106: Glance at 2016, 2019 and 2025 North American Biosimilars Market Share (%) in Oncology by Geographic Region - United States, Canada and Mexico
Chart 107: North American Biosimilars Market Analysis (2016-2025) in Autoimmune Disorders by Geographic Region - United States, Canada and Mexico in US$ Million
Chart 108: Glance at 2016, 2019 and 2025 North American Biosimilars Market Share (%) in Autoimmune Disorders by Geographic Region - United States, Canada and Mexico
Chart 109: North American Biosimilars Market Analysis (2016-2025) in Blood Disorders by Geographic Region - United States, Canada and Mexico in US$ Million
Chart 110: Glance at 2016, 2019 and 2025 North American Biosimilars Market Share (%) in Blood Disorders by Geographic Region - United States, Canada and Mexico
Chart 111: North American Biosimilars Market Analysis (2016-2025) in Growth Hormone Deficiency by Geographic Region - United States, Canada and Mexico in US$ Million
Chart 112: Glance at 2016, 2019 and 2025 North American Biosimilars Market Share (%) in Growth Hormone Deficiency by Geographic Region - United States, Canada and Mexico
Chart 113: North American Biosimilars Market Analysis (2016-2025) in Other Therapeutic Areas by Geographic Region - United States, Canada and Mexico in US$ Million
Chart 114: Glance at 2016, 2019 and 2025 North American Biosimilars Market Share (%) in Other Therapeutic Areas by Geographic Region - United States, Canada and Mexico
The United States
Chart 115: United States Biosimilars Market Analysis (2016-2025) in USD Million
Chart 116: United States Biosimilars Market Analysis (2016-2025) by Product Type - Monoclonal Antibodies, Erythropoietin, G-CSF, Insulin and Other in USD Million
Chart 117: Glance at 2016, 2019 and 2025 United States Biosimilars Market Share (%) by Product Type - Monoclonal Antibodies, Erythropoietin, G-CSF, Insulin and Other
Chart 118: United States Biosimilars Market Analysis (2016-2025) by Therapeutic Area - Oncology, Autoimmune Disorders, Blood Disorders, Growth Hormone Deficiency and Other in USD Million
Chart 119: Glance at 2016, 2019 and 2025 United States Biosimilars Market Share (%) by Therapeutic Area - Oncology, Autoimmune Disorders, Blood Disorders, Growth Hormone Deficiency and Other
Canada
Chart 120: Canadian Biosimilars Market Analysis (2016-2025) in USD Million
Chart 121: Canadian Biosimilars Market Analysis (2016-2025) by Product Type - Monoclonal Antibodies, Erythropoietin, G-CSF, Insulin and Other in USD Million
Chart 122: Glance at 2016, 2019 and 2025 Canadian Biosimilars Market Share (%) by Product Type - Monoclonal Antibodies, Erythropoietin, G-CSF, Insulin and Other
Chart 123: Canadian Biosimilars Market Analysis (2016-2025) by Therapeutic Area - Oncology, Autoimmune Disorders, Blood Disorders, Growth Hormone Deficiency and Other in USD Million
Chart 124: Glance at 2016, 2019 and 2025 Canadian Biosimilars Market Share (%) by Therapeutic Area - Oncology, Autoimmune Disorders, Blood Disorders, Growth Hormone Deficiency and Other
Mexico
Chart 125: Mexican Biosimilars Market Analysis (2016-2025) in USD Million
Chart 126: Mexican Biosimilars Market Analysis (2016-2025) by Product Type - Monoclonal Antibodies, Erythropoietin, G-CSF, Insulin and Other in USD Million
Chart 127: Glance at 2016, 2019 and 2025 Mexican Biosimilars Market Share (%) by Product Type - Monoclonal Antibodies, Erythropoietin, G-CSF, Insulin and Other
Chart 128: Mexican Biosimilars Market Analysis (2016-2025) by Therapeutic Area - Oncology, Autoimmune Disorders, Blood Disorders, Growth Hormone Deficiency and Other in USD Million
Chart 129: Glance at 2016, 2019 and 2025 Mexican Biosimilars Market Share (%) by Therapeutic Area - Oncology, Autoimmune Disorders, Blood Disorders, Growth Hormone Deficiency and Other
ASIA-PACIFIC
Chart 130: Asia-Pacific Biosimilars Market Analysis (2016-2025) in USD Million
Chart 131: Asia-Pacific Biosimilars Market Analysis (2016-2025) by Geographic Region - China, India, Japan, South Korea and Rest of Asia-Pacific in USD Million
Chart 132: Glance at 2016, 2019 and 2025 Asia-Pacific Biosimilars Market Share (%) by Geographic Region - China, India, Japan, South Korea and Rest of Asia-Pacific
Chart 133: Asia-Pacific Biosimilars Market Analysis (2016-2025) by Product Type - Monoclonal Antibodies, Erythropoietin, G-CSF, Insulin and Other in USD Million
Chart 134: Glance at 2016, 2019 and 2025 Asia-Pacific Biosimilars Market Share (%) by Product Type - Monoclonal Antibodies, Erythropoietin, G-CSF, Insulin and Other
Chart 135: Asia-Pacific Biosimilar Monoclonal Antibodies Market Analysis (2016-2025) by Geographic Region - China, India, Japan, South Korea and Rest of Asia-Pacific in USD Million
Chart 136: Glance at 2016, 2019 and 2025 Asia-Pacific Biosimilar Monoclonal Antibodies Market Share (%) by Geographic Region - China, India, Japan, South Korea and Rest of Asia-Pacific
Chart 137: Asia-Pacific Biosimilar Erythropoietin Market Analysis (2016-2025) by Geographic Region - China, India, Japan, South Korea and Rest of Asia-Pacific in US$ Million
Chart 138: Glance at 2016, 2019 and 2025 Asia-Pacific Biosimilar Erythropoietin Market Share (%) by Geographic Region - China, India, Japan, South Korea and Rest of Asia-Pacific
Chart 139: Asia-Pacific Biosimilar G-CSF Market Analysis (2016-2025) by Geographic Region - China, India, Japan, South Korea and Rest of Asia-Pacific in US$ Million
Chart 140: Glance at 2016, 2019 and 2025 Asia-Pacific Biosimilar G-CSF Market Share (%) by Geographic Region - China, India, Japan, South Korea and Rest of Asia-Pacific
Chart 141: Asia-Pacific Biosimilar Insulin Market Analysis (2016-2025) by Geographic Region - China, India, Japan, South Korea and Rest of Asia-Pacific in US$ Million
Chart 142: Glance at 2016, 2019 and 2025 Asia-Pacific Biosimilar Insulin Market Share (%) by Geographic Region - China, India, Japan, South Korea and Rest of Asia-Pacific
Chart 143: Asia-Pacific Other Biosimilar Product Types Market Analysis (2016-2025) by Geographic Region - China, India, Japan, South Korea and Rest of Asia-Pacific in US$ Million
Chart 144: Glance at 2016, 2019 and 2025 Asia-Pacific Other Biosimilar Products Types Market Share (%) by Geographic Region - China, India, Japan, South Korea and Rest of Asia-Pacific
Chart 145: Asia-Pacific Biosimilars Market Analysis (2016-2025) by Therapeutic Area - Oncology, Autoimmune Disorders, Blood Disorders, Growth Hormone Deficiency and Other in USD Million
Chart 146: Glance at 2016, 2019 and 2025 Asia-Pacific Biosimilars Market Share (%) by Therapeutic Area - Oncology, Autoimmune Disorders, Blood Disorders, Growth Hormone Deficiency and Other
Chart 147: Asia-Pacific Biosimilars Market Analysis (2016-2025) in Oncology by Geographic Region - China, India, Japan, South Korea and Rest of Asia-Pacific in US$ Million
Chart 148: Glance at 2016, 2019 and 2025 Asia-Pacific Biosimilars Market Share (%) in Oncology by Geographic Region - China, India, Japan, South Korea and Rest of Asia-Pacific
Chart 149: Asia-Pacific Biosimilars Market Analysis (2016-2025) in Autoimmune Disorders by Geographic Region - China, India, Japan, South Korea and Rest of Asia-Pacific in US$ Million
Chart 150: Glance at 2016, 2019 and 2025 Asia-Pacific Biosimilars Market Share (%) in Autoimmune Disorders by Geographic Region - China, India, Japan, South Korea and Rest of Asia-Pacific
Chart 151: Asia-Pacific Biosimilars Market Analysis (2016-2025) in Blood Disorders by Geographic Region - China, India, Japan, South Korea and Rest of Asia-Pacific in US$ Million
Chart 152: Glance at 2016, 2019 and 2025 Asia-Pacific Biosimilars Market Share (%) in Blood Disorders by Geographic Region - China, India, Japan, South Korea and Rest of Asia-Pacific
Chart 153: Asia-Pacific Biosimilars Market Analysis (2016-2025) in Growth Hormone Deficiency by Geographic Region - China, India, Japan, South Korea and Rest of Asia-Pacific in US$ Million
Chart 154: Glance at 2016, 2019 and 2025 Asia-Pacific Biosimilars Market Share (%) in Growth Hormone Deficiency by Geographic Region - China, India, Japan, South Korea and Rest of Asia-Pacific
Chart 155: Asia-Pacific Biosimilars Market Analysis (2016-2025) in Other Therapeutic Areas by Geographic Region - China, India, Japan, South Korea and Rest of Asia-Pacific in US$ Million
Chart 156: Glance at 2016, 2019 and 2025 Asia-Pacific Biosimilars Market Share (%) in Other Therapeutic Areas by Geographic Region - China, India, Japan, South Korea and Rest of Asia-Pacific
China
Chart 157: Chinese Biosimilars Market Analysis (2016-2025) in USD Million
Chart 158: Chinese Biosimilars Market Analysis (2016-2025) by Product Type - Monoclonal Antibodies, Erythropoietin, G-CSF, Insulin and Other in USD Million
Chart 159: Glance at 2016, 2019 and 2025 Chinese Biosimilars Market Share (%) by Product Type - Monoclonal Antibodies, Erythropoietin, G-CSF, Insulin and Other
Chart 160: Chinese Biosimilars Market Analysis (2016-2025) by Therapeutic Area - Oncology, Autoimmune Disorders, Blood Disorders, Growth Hormone Deficiency and Other in USD Million
Chart 161: Glance at 2016, 2019 and 2025 Chinese Biosimilars Market Share (%) by Therapeutic Area - Oncology, Autoimmune Disorders, Blood Disorders, Growth Hormone Deficiency and Other
India
Chart 162: Indian Biosimilars Market Analysis (2016-2025) in USD Million
Chart 163: Indian Biosimilars Market Analysis (2016-2025) by Product Type - Monoclonal Antibodies, Erythropoietin, G-CSF, Insulin and Other in USD Million
Chart 164: Glance at 2016, 2019 and 2025 Indian Biosimilars Market Share (%) by Product Type - Monoclonal Antibodies, Erythropoietin, G-CSF, Insulin and Other
Chart 165: Indian Biosimilars Market Analysis (2016-2025) by Therapeutic Area - Oncology, Autoimmune Disorders, Blood Disorders, Growth Hormone Deficiency and Other in USD Million
Chart 166: Glance at 2016, 2019 and 2025 Indian Biosimilars Market Share (%) by Therapeutic Area - Oncology, Autoimmune Disorders, Blood Disorders, Growth Hormone Deficiency and Other
Japan
Chart 167: Japanese Biosimilars Market Analysis (2016-2025) in USD Million
Chart 168: Japanese Biosimilars Market Analysis (2016-2025) by Product Type - Monoclonal Antibodies, Erythropoietin, G-CSF, Insulin and Other in USD Million
Chart 169: Glance at 2016, 2019 and 2025 Japanese Biosimilars Market Share (%) by Product Type - Monoclonal Antibodies, Erythropoietin, G-CSF, Insulin and Other
Chart 170: Japanese Biosimilars Market Analysis (2016-2025) by Therapeutic Area - Oncology, Autoimmune Disorders, Blood Disorders, Growth Hormone Deficiency and Other in USD Million
Chart 171: Glance at 2016, 2019 and 2025 Japanese Biosimilars Market Share (%) by Therapeutic Area - Oncology, Autoimmune Disorders, Blood Disorders, Growth Hormone Deficiency and Other
South Korea
Chart 172: South Korean Biosimilars Market Analysis (2016-2025) in USD Million
Chart 173: South Korean Biosimilars Market Analysis (2016-2025) by Product Type - Monoclonal Antibodies, Erythropoietin, G-CSF, Insulin and Other in USD Million
Chart 174: Glance at 2016, 2019 and 2025 South Korean Biosimilars Market Share (%) by Product Type - Monoclonal Antibodies, Erythropoietin, G-CSF, Insulin and Other
Chart 175: South Korean Biosimilars Market Analysis (2016-2025) by Therapeutic Area - Oncology, Autoimmune Disorders, Blood Disorders, Growth Hormone Deficiency and Other in USD Million
Chart 176: Glance at 2016, 2019 and 2025 South Korean Biosimilars Market Share (%) by Therapeutic Area - Oncology, Autoimmune Disorders, Blood Disorders, Growth Hormone Deficiency and Other
Rest of Asia-Pacific
Chart 177: Rest of Asia-Pacific Biosimilars Market Analysis (2016-2025) in USD Million
Chart 178: Rest of Asia-Pacific Biosimilars Market Analysis (2016-2025) by Product Type - Monoclonal Antibodies, Erythropoietin, G-CSF, Insulin and Other in USD Million
Chart 179: Glance at 2016, 2019 and 2025 Rest of Asia-Pacific Biosimilars Market Share (%) by Product Type - Monoclonal Antibodies, Erythropoietin, G-CSF, Insulin and Other
Chart 180: Rest of Asia-Pacific Biosimilars Market Analysis (2016-2025) by Therapeutic Area - Oncology, Autoimmune Disorders, Blood Disorders, Growth Hormone Deficiency and Other in USD Million
Chart 181: Glance at 2016, 2019 and 2025 Rest of Asia-Pacific Biosimilars Market Share (%) by Therapeutic Area - Oncology, Autoimmune Disorders, Blood Disorders, Growth Hormone Deficiency and Other
REST OF WORLD
Chart 182: Rest of World Biosimilars Market Analysis (2016-2025) in USD Million
Chart 183: Rest of World Biosimilars Market Analysis (2016-2025) by Geographic Region - Brazil, Israel and Other Countries in USD Million
Chart 184: Glance at 2016, 2019 and 2025 Rest of World Biosimilars Market Share (%) by Geographic Region - Brazil, Israel and Other Countries
Chart 185: Rest of World Biosimilars Market Analysis (2016-2025) by Product Type - Monoclonal Antibodies, Erythropoietin, G-CSF, Insulin and Other in USD Million
Chart 186: Glance at 2016, 2019 and 2025 Rest of World Biosimilars Market Share (%) by Product Type - Monoclonal Antibodies, Erythropoietin, G-CSF, Insulin and Other
Chart 187: Rest of World Biosimilar Monoclonal Antibodies Market Analysis (2016-2025) by Geographic Region - Brazil, Israel and Other Countries in USD Million
Chart 188: Glance at 2016, 2019 and 2025 Rest of World Biosimilar Monoclonal Antibodies Market Share (%) by Geographic Region - Brazil, Israel and Other Countries
Chart 189: Rest of World Biosimilar Erythropoietin Market Analysis (2016-2025) by Geographic Region - Brazil, Israel and Other Countries in US$ Million
Chart 190: Glance at 2016, 2019 and 2025 Rest of World Biosimilar Erythropoietin Market Share (%) by Geographic Region - Brazil, Israel and Other Countries
Chart 191: Rest of World Biosimilar G-CSF Market Analysis (2016-2025) by Geographic Region - Brazil, Israel and Other Countries in US$ Million
Chart 192: Glance at 2016, 2019 and 2025 Rest of World Biosimilar G-CSF Market Share (%) by Geographic Region - Brazil, Israel and Other Countries
Chart 193: Rest of World Biosimilar Insulin Market Analysis (2016-2025) by Geographic Region - Brazil, Israel and Other Countries in US$ Million
Chart 194: Glance at 2016, 2019 and 2025 Rest of World Biosimilar Insulin Market Share (%) by Geographic Region - Brazil, Israel and Other Countries
Chart 195: Rest of World Other Biosimilar Product Types Market Analysis (2016-2025) by Geographic Region - Brazil, Israel and Other Countries in US$ Million
Chart 196: Glance at 2016, 2019 and 2025 Rest of World Other Biosimilar Products Types Market Share (%) by Geographic Region - Brazil, Israel and Other Countries
Chart 197: Rest of World Biosimilars Market Analysis (2016-2025) by Therapeutic Area - Oncology, Autoimmune Disorders, Blood Disorders, Growth Hormone Deficiency and Other in USD Million
Chart 198: Glance at 2016, 2019 and 2025 Rest of World Biosimilars Market Share (%) by Therapeutic Area - Oncology, Autoimmune Disorders, Blood Disorders, Growth Hormone Deficiency and Other
Chart 199: Rest of World Biosimilars Market Analysis (2016-2025) in Oncology by Geographic Region - Brazil, Israel and Other Countries in US$ Million
Chart 200: Glance at 2016, 2019 and 2025 Rest of World Biosimilars Market Share (%) in Oncology by Geographic Region - Brazil, Israel and Other Countries
Chart 201: Rest of World Biosimilars Market Analysis (2016-2025) in Autoimmune Disorders by Geographic Region - Brazil, Israel and Other Countries in US$ Million
Chart 202: Glance at 2016, 2019 and 2025 Rest of World Biosimilars Market Share (%) in Autoimmune Disorders by Geographic Region - Brazil, Israel and Other Countries
Chart 203: Rest of World Biosimilars Market Analysis (2016-2025) in Blood Disorders by Geographic Region - Brazil, Israel and Other Countries in US$ Million
Chart 204: Glance at 2016, 2019 and 2025 Rest of World Biosimilars Market Share (%) in Blood Disorders by Geographic Region - Brazil, Israel and Other Countries
Chart 205: Rest of World Biosimilars Market Analysis (2016-2025) in Growth Hormone Deficiency by Geographic Region - Brazil, Israel and Other Countries in US$ Million
Chart 206: Glance at 2016, 2019 and 2025 Rest of World Biosimilars Market Share (%) in Growth Hormone Deficiency by Geographic Region - Brazil, Israel and Other Countries
Chart 207: Rest of World Biosimilars Market Analysis (2016-2025) in Other Therapeutic Areas by Geographic Region - Brazil, Israel and Other Countries in US$ Million
Chart 208: Glance at 2016, 2019 and 2025 Rest of World Biosimilars Market Share (%) in Other Therapeutic Areas by Geographic Region - Brazil, Israel and Other Countries
Brazil
Chart 209: Brazilian Biosimilars Market Analysis (2016-2025) in USD Million
Chart 210: Brazilian Biosimilars Market Analysis (2016-2025) by Product Type - Monoclonal Antibodies, Erythropoietin, G-CSF, Insulin and Other in USD Million
Chart 211: Glance at 2016, 2019 and 2025 Brazilian Biosimilars Market Share (%) by Product Type - Monoclonal Antibodies, Erythropoietin, G-CSF, Insulin and Other
Chart 212: Brazilian Biosimilars Market Analysis (2016-2025) by Therapeutic Area - Oncology, Autoimmune Disorders, Blood Disorders, Growth Hormone Deficiency and Other in USD Million
Chart 213: Glance at 2016, 2019 and 2025 Brazilian Biosimilars Market Share (%) by Therapeutic Area - Oncology, Autoimmune Disorders, Blood Disorders, Growth Hormone Deficiency and Other
Israel
Chart 214: Israeli Biosimilars Market Analysis (2016-2025) in USD Million
Chart 215: Israeli Biosimilars Market Analysis (2016-2025) by Product Type - Monoclonal Antibodies, Erythropoietin, G-CSF, Insulin and Other in USD Million
Chart 216: Glance at 2016, 2019 and 2025 Israeli Biosimilars Market Share (%) by Product Type - Monoclonal Antibodies, Erythropoietin, G-CSF, Insulin and Other
Chart 217: Israeli Biosimilars Market Analysis (2016-2025) by Therapeutic Area - Oncology, Autoimmune Disorders, Blood Disorders, Growth Hormone Deficiency and Other in USD Million
Chart 218: Glance at 2016, 2019 and 2025 Israeli Biosimilars Market Share (%) by Therapeutic Area - Oncology, Autoimmune Disorders, Blood Disorders, Growth Hormone Deficiency and Other
Other Countries
Chart 219: Other Countries Biosimilars Market Analysis (2016-2025) in USD Million
Chart 220: Other Countries Biosimilars Market Analysis (2016-2025) by Product Type - Monoclonal Antibodies, Erythropoietin, G-CSF, Insulin and Other in USD Million
Chart 221: Glance at 2016, 2019 and 2025 Other Countries Biosimilars Market Share (%) by Product Type - Monoclonal Antibodies, Erythropoietin, G-CSF, Insulin and Other
Chart 222: Other Countries Biosimilars Market Analysis (2016-2025) by Therapeutic Area - Oncology, Autoimmune Disorders, Blood Disorders, Growth Hormone Deficiency and Other in USD Million
Chart 223: Glance at 2016, 2019 and 2025 Other Countries Biosimilars Market Share (%) by Therapeutic Area - Oncology, Autoimmune Disorders, Blood Disorders, Growth Hormone Deficiency and Other
Tables:
Table 1: Biosimilar Synonyms
Table 2: Comparison of Generics and Biosimilars
Table 3: List of the US and European Approved Biosimilars for Diabetes
Table 4: List of the US and European Approved Biosimilars for Oncology
Table 5: List of the US and European Approved Biosimilars for Autoimmune Disorders
Table 6: List of the US and European Approved Biosimilars for Blood Disorders
Table 7: List of the US and European Approved Biosimilars for Other Indications
Table 8: List of Leading Bioloigcs Containing mAbs, Year of Approval and Patent Expiry in Europe and the United States
Table 9: Number of Biosimilar mAbs in Pipeline
Table 10: Global Biosimilar Pipeline and its Manufacturer
Table 11: Biosimilars Approvals from 2017 to 2019
Adello Biologics
Amgen Inc.
AXXO GmbH
BIOCAD
Biogen, Inc.
CoherusBioSciences
Creative BioMart
Dong-A Socio Group
Dr. Reddy's Laboratories Ltd.
Eli Lilly and Company
Genor Biopharma Co., Ltd.
Hetero Drugs Limited
Insud Pharma SL
Intas Pharmaceuticals Ltd.
LG Chem
Lupin Limited
Mylan, Inc
Nippon Kayaku Co., Ltd.
Pfizer, Inc.
Reliance Life Sciences Pvt. Ltd.
Sandoz International GmbH
Shanghai Henlius Biotech, Inc.
STADA Arzneimittel AG
Teva Pharmaceutical Industries Limited
Wockhardt Limited
Zydus Cadila
SINGLE USER/ENTERPRISE LICENSE
Electronic (PDF)
Latest Version Available!
Latest version of this report is available. Click below to view report.
Latest Publication
avialable for this report
OTHER ARCHIVED REPORTS
Natural Source Vitamin E (Tocopherols and Tocotrienols) – A Global Market Overview
Report Code: PH002ARCH | Pages: 278 | Price: $2700
Published
Oct 2021
Vacuum Insulation Panels (VIPs) – A Global Market Overview-2021
Report Code: MG023ARCH | Pages: 272 | Price: $1800
Published
Jan 2021
Powder Metallurgy – A Global Market Overview
Report Code: CP057ARCH | Pages: 567 | Price: $2187
Published
Oct 2020

Hydraulic Components – A Global Market Overview
Report Code: MG014ARCH | Pages: 464 | Price: $2475
Published
Aug 2020

Global Zeolites Market – Products and Applications | Covid-19 Impact
Report Code: CP091ARCH | Pages: 450 | Price: $2475
Published
Jul 2020