
Report Synopsis
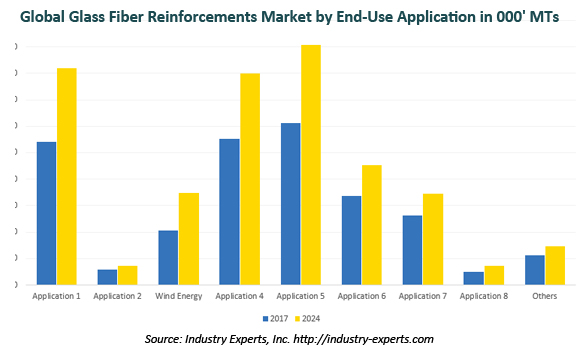
Wind energy remains one of the most important and dynamic end markets served by the glass fiber composites industry. The wind energy sector is one of the most promising alternative energy sources in the world and expected to record double digit growths in the future. Regulations and standards around the globe such as CAFE in the US and carbon emission targets in Europe, are driving increased usage of glass fiber reinforcements in automobiles to reduce weight and CO2 emissions. Further, renewed growth in worldwide construction activities and demand for corrosion resistance applications such as pipes and tanks from oil & gas and water supply sectors, are key drivers for growth in glass fiber reinforcements.
Driven by growth in the key application areas such as automotive, pipes & tanks, construction and wind energy, the global glass fiber reinforcements market is projected to reach US$12 billion, reflecting CAGR of 5.1% during 2017-2024 analysis period. The market is anticipated to record lower growth in value demand compared to volume consumption during the above period due to decline in average prices of glass fiber reinforcements worldwide because of overcapacity, mainly in China.
Research Findings & Coverage
- The global market for Glass Fiber Reinforcements is analyzed in this report with respect to key product segments and major application areas
- All major application areas are exclusively discussed in detail with future projections
- Demand for Glass Fiber Reinforcements Being Propelled by Wind Energy
- Factors Fueling Automotive & Transportation Industry’s Wider Adoption of Glass Fibers
- Glass Fiber Composites Demand Increasing in Construction Industry
- Key business trends focusing on product innovations/developments, M&As, JVs and other recent industry developments
- Major companies profiled – 70 while an in-depth analysis carried out for production capacities globally
- The industry guide includes the contact details for 109 companies engaged in the manufacturing and supply of glass fiber reinforcements and their downstream products such as fabrics, prepregs etc.
Product Outline
The report analyzes the market for product segments of Glass Fiber Reinforcements including:
- Single-end Rovings
- Multi-end Rovings
- Woven Rovings
- Chopped Strands
- Chopped Strand Mat (CSM)
- Continuous Filament Mat (CFM)
- Fabrics
- Others
Application areas of Glass Fiber Reinforcements analyzed comprise the following:
- Automotive & Transportation
- Marine
- Wind Energy
- Pipes & Tanks
- Building & Construction
- Electricals & Electronics
- Consumer Goods
- Aerospace & Defense
- Other Applications
Analysis Period & Units
- The report reviews, analyzes and projects the global Glass Fiber Reinforcements market for the period 2014-2024 in terms of volume in metric tons and value in US$ and the compound annual growth rates (CAGRs) projected from 2017 through 2024
Geographic Coverage
- North America (The United States and Canada)
- Europe (Germany, France, Italy, Spain, The United Kingdom and other EU-27 countries)
- Asia-Pacific (China, Japan, India, South Korea and Rest of Asia-Pacific)
- Rest of World (Russia, Brazil, Turkey and others)
PART A: GLOBAL MARKET PERSPECTIVE
1. INTRODUCTION
1.1 Product Outline
1.1.1 Manufacturing Process of Glass Fiber
1.1.2 Glass Fiber Product Segmentation
1.1.2.1 Glass Fiber Reinforcements
1.1.2.1.1 Glass Fiber Chemical Compositions and Properties
1.1.2.1.2 Types or forms of Glass Fiber Reinforcements
1.1.2.1.2.1 Roving
1.1.2.1.2.2 Chopped Strands
1.1.2.1.2.3 Chopped Strand Mat (CSM)
1.1.2.1.2.4 Continuous Filament Mat (CFM)
1.1.2.1.2.5 Fabrics
1.1.2.1.2.6 Other Forms of Glass Fiber
1.1.2.1.3 A Snapshot of Global Market for Glass Fiber Product Forms in 2017
1.1.3 Competitive Materials
1.2 End-use Application Areas for Glass Fiber Reinforcements
1.2.1 Automotive & Transportation
1.2.2 Marine
1.2.3 Wind Energy
1.2.4 Pipes, Tanks &Other Corrosion Resistant Equipment
1.2.5 Building and Construction
1.2.6 Electricals and Electronics
1.2.7 Consumer Goods
1.2.8 Aerospace & Defense
1.2.9 Other Application Areas
2. KEY MARKET TRENDS
2.1 Demand for Glass Fiber Reinforcements Being Propelled by Wind Energy
2.2 Factors Fueling Automotive & Transportation Industry’s Wider Adoption of Glass Fibers
2.3 Glass Fiber Composites Demand Increasing in Construction Industry
2.4 Long Glass Fiber Reinforced Thermoplastics (LFT) Looks Promising in Automotive & Transportation Industry
3. INDUSTRY LANDSCAPE
3.1 Glass Fiber Production Capacities
Chart 16: Global Glass Fiber Production Capacities (2017-2020) of Major Companies in Thousand Metric Tons
Chart 17: Global Glass Fiber Production Capacities (2017-2020) by Geographic Region in Thousand Metric Tons
Table 1: Glass Fiber Production Capacity Expansions Worldwide (2017-2020)
Table 2: Global Glass Fiber Production Capacities (2017-2020) by Company, Country and Plant in Thousand Metric Tons
3.2 Key Global Players
Braj Binani Group (3B-Fibreglass) (India)
China Jushi Group Co., Ltd. (China)
Chongqing Polycomp International Corporation (CPIC) (China)
Chongqing Sanlei Glass Fiber Co., Ltd. (China)
Jiangsu Changhai Composite Materials Co., Ltd. (China)
Johns Manville Corporation (United States)
Nippon Electric Glass Co., Ltd. (Japan)
Owens Corning (United States)
Shandong Fiberglass Group Co., Ltd. (China)
Taishan Fiberglass Inc. (China)
4. KEY BUSINESS & PRODUCT TRENDS
Johns Manville Resumed Furnace Operations with Increased Capacity in Ohio
Availability of JM’s StarRov® 853 Roving in North America and Europe
Chongqing Sanlei Glass Fiber Co., Ltd. Ignited Their First Glass Fiber Production Line
Development of Direct Roving with a Weight of 20 kg Bays Commenced by "Polotsk-Steklovolokno"
Nippon Electric Glass Co., Ltd. to Broaden Glass Fiber Production Capacity in its Subsidiaries in the Netherlands and the United States
Hexcel Extended its Existing Supply Deal with UTC Aerospace Systems Through 2030
Johns Manville’s Slovakia Plant Received GMP Certification for CFGF Fabrication
JM’s New ThermoFlow® 600+ Chopped Strands for PBT/PET Reinforcement
Extension of Hexcel’s Composite Materials Supply Deal with Vestas for New Generation Wind Blades
Chomarat and Velox form Composite Reinforcements Distribution Pact
Flat Glass Fiber Developed by Nippon Electric Glass to Reinforce Thermoplastic Resin
P-D Interglas Technologies Completely Acquired by Porcher Industries
Structil Acquired by Hexcel
Jushi Completed the first 200,000 tons of Glass Fiber Production Base in Egypt
Groundbreaking Ceremony for China Jushi’s First Line 150,000 Tons of Glass Fiber Production
Owens Corning to Broaden Thermoplastic Chopped Strands Production Capacity in France
PPG’s US Glass Fiber Business Acquired by Nippon Electric Glass
BGF Industries Acquired New Altavista Plant
METYX Group and KARL MAYER Sign Multi-Machinery Supply Deal
PolyPreg®, BGF Industries’ Latest Innovation in Thermoplastic Composite Material
Inauguration of Vectorply’s New Advanced Composite Reinforcement Center
CPIC’s North American Headquarters is Now in New York
Cam Elyaf Plans to Build New Glass Fiber Production facility in Turkey
Valmieras stikla �kiedra JSC to Build a Glass Fiber Production and Processing Plant in the US
GRP Solutions Ltd., METYX Composites’ New Exclusive Distributor for Great Britain
StarRov® 090 Roving Now Available in North America and Europe
Launch of JM’s New ThermoFlow® 641 chopped Strands
MultiStar® 264 Roving for Sheet Molding Composites Reinforcements Introduced by JM
ISPO MUNICH 2017 to Feature Hexcel’s Composite Innovations for the Winter Sports Market
Taishan Fiberglass to Establish a Green-field Fiberglass Production Unit in India
PFG Fiber Glass Joint Ventures Fully Acquired by Nan Ya
UL Certification for JM’s DuraCore® 300 Chopped Strands
Nippon Electric Glass Acquired the European Glass Fiber Business of PPG
P-D Management Industries-Technologies GmbH Purchased 33% Shares of Valmiera Glass USA Corp.
Launch of PPG’s INNOFIBER® TS 2402 Direct-Draw Fiber Glass Roving
Owens Corning’s Investment to Support the Growing India Glass Fiber Market
Three New Products Added to PPG’s Fiber Glass Product Lines
CEM, Exclusive Distributor for SAERTEX’s SAERfoam® in the US
Plans to Upgrade PPG’s Fiber Glass Production Unit in South Carolina
Expanded METYX Production Site is Almost Twice the Size of its Existing Factory
Chongqing Sanlei Glass Fiber Co., Ltd Plans to Build ECR Glass Fiber Plant in China
Polystrand Built a Racecar Using PPG’s TUFROV Fiber Glass Roving Products
LM 88.4 P Blade, the Longest Blade in the World Designed for Adwen’s AD 8-180 Wind Turbine Model
Second 80,000 Ton Fiberglass Furnace Successfully Started by Jushi Egypt
China Jushi Reached a Milestone in the Strategic Development of its Globalization by Signing of the US Project
Matti Holtzberg Selected AGY Fibers to develop the All Composite Polimotor 2 Engine
Launch of a New Chopped Strand for General Purpose PA grades by 3B-the fibreglass Company
JEC World 2016 to Feature JM’s Three New Rovings
Introduction of Owens Corning’s New PipeStrand™ Product Line for Filament Winding Applications
Expansion of JM’s Glass Fiber Operations Plant in Etowah
JSC Valmieras stikla �kiedra to Invest USD 90 Million to Expand its US Production
Owens Corning to Purchase Ahlstrom’s Glass Non-Wovens and Fabrics Assets
Technology Licensing and Manufacturing Supply Deals Signed by Owens Corning and Shandong Fiberglass Group
Formax UK Completely Acquired by Hexcel
Introduction of Owens Corning’s PulStrand™ 4100 roving at CAMX 2015
NEG and NSG to Launch a Joint Development Project of Glass Fillers
AGY Expanded the Capacity of Specialty Glass Fiber Product Lines
CAMX 2015 to Feature PPG’s Expanded Direct Draw Roving Portfolio
JM Making Investments to Expand its Glass Microfiber Business
Vectorply Receives a Certificate of Appreciation from The Boeing Company
AGY Invests to Expand L-Glass™ Low-Loss Glass Fiber Capacity
Expansion of AGY’s Glass Fiber Portfolio
Production Capacity of S-2 Glass® Yarns and Rovings Broadened by AGY
Release of 3B-the fibreglass company’s New HiPer-tex™ H2020 Roving
Launch of JM’s New Multi-End Rovings for Use in Various Process Technologies
Launch of Owens Corning’s PulStrand™ 4100 Roving at JEC Europe 2015
Owens Corning’s New OC Paneluxe™ Multi-End Roving for Continuous Lamination of Translucent and General Purpose Applications
Owens Corning Introduces New HydroStrand® 258 Glass Fiber Chopped Strands for PA Resins
Launch of ThermoFlow® 675 Chopped Strand Glass Fiber for High Performance Polyamide
5. GLOBAL MARKET OVERVIEW
5.1 Global Glass Fiber Reinforcements Market Overview by Product Form
5.2 Global Glass Fiber Reinforcements Market Overview by End-Use Application
5.2.1 Global Glass Fiber Reinforcements End-use Application Market Overview by Geographic Region
5.2.1.1 Automotive & Transportation
5.2.1.2 Marine
5.2.1.3 Wind Energy
5.2.1.4 Pipes, Tanks & Other Corrosion Resistant Equipment
5.2.1.5 Building & Construction
5.2.1.6 Electricals & Electronics
5.2.1.7 Consumer Goods
5.2.1.8 Aerospace & Defense
5.2.1.9 Other Applications
PART B: REGIONAL MARKET PERSPECTIVE
Global Glass Fiber Reinforcements Market Overview by Geographic Region
REGIONAL MARKET OVERVIEW
1. NORTH AMERICA
1.1 North American Glass Fiber Reinforcements Market Overview by Geographic Region
1.2 North American Glass Fiber Reinforcements Market Overview by End-Use Application
1.3 North American Glass Fiber Reinforcements Market Overview by Product Form
1.4 Major Market Players
AGY Holding Corp. (United States)
BGF Industries, Inc. (United States)
Fiberex Technologies Inc. (Canada)
Fibertec, Inc. (United States)
Glass Strand Inc. (GSI) (United States)
Hexcel Corporation (United States)
Johns Manville Corporation (United States)
JPS Composite Materials (United States)
Nycon Corporation (United States)
Owens Corning (United States)
Unifrax I LLC (United States)
V2 Composites, Inc. (United States)
Vectorply Corporation (United States)
1.5 Glass Fiber Reinforcements Market Overview by North American Region
1.5.1 The United States
1.5.1.1 United States Glass Fiber Reinforcements Market Analysis Overview by End-Use Application
1.5.1.2 United States Glass Fiber Reinforcements Market Overview by Product Form
1.5.2 Canada
1.5.2.1 Canada Glass Fiber Reinforcements Market Overview by End-Use Application
1.5.2.2 Canada Glass Fiber Reinforcements Market Overview by Product Form
2. EUROPE
2.1 European Glass Fiber Reinforcements Market Overview by Geographic Region
2.2 European Glass Fiber Reinforcements Market Overview by End-Use Application
2.3 European Glass Fiber Reinforcements Market Overview by Product Form
2.4 Major Market Players
3B-The Fibreglass Company (Belgium)
Ahlstrom-Munksjo Group (Sweden)
Asglatexohorn GmbH (Germany)
Chomarat™ (France)
DBW Advanced Fiber Technologies GmbH (Germany)
Devold AMT AS (Norway)
Dipex Spol. S R.O. (Slovakia)
Dr. Gunther Kast Gmbh & Co. (Germany)
JSC "Polotsk-Steklovolokno" (Republic Of Belarus)
Lanxess AG (Germany)
P-D Glasseiden GmbH Oschatz (Germany)
P-D Tatneft-Alabugasteklovolokno, LLC (Russia)
Saertex GmbH & Co. Kg (Germany)
Saint-Gobain S.A (France)
Selcom S.R.L. (Italy)
Tissaglasweberei AG (Switzerland)
Valmieras Stikla Skiedra JSC (Latvia)
2.5 Glass Fiber Reinforcements Market Overview by European Region
2.5.1 Germany
2.5.1.1 Germany Glass Fiber Reinforcements Market Overview by End-Use Application
2.5.1.2 Germany Glass Fiber Reinforcements Market Overview by Product Form
2.5.2 France
2.5.2.1 France Glass Fiber Reinforcements Market Overview by End-Use Application
2.5.2.2 France Glass Fiber Reinforcements Market Overview by Product Form
2.5.3 Italy
2.5.3.1 Italy Glass Fiber Reinforcements Market Overview by End-Use Application
2.5.3.2 Italy Glass Fiber Reinforcements Market Overview by Product Form
2.5.4 Spain
2.5.4.1 Spain Glass Fiber Reinforcements Market Overview by End-Use Application
2.5.4.2 Spain Glass Fiber Reinforcements Market Overview by Product Form
2.5.5 The United Kingdom
2.5.5.1 United Kingdom Glass Fiber Reinforcements Market Overview by End-Use Application
2.5.5.2 United Kingdom Glass Fiber Reinforcements Market Overview by Product Form
2.5.6 Rest of Europe
2.5.6.1 Rest of Europe Glass Fiber Reinforcements Market Overview by End-Use Application
2.5.6.2 Rest of Europe Glass Fiber Reinforcements Market Overview by Product Form
3. ASIA-PACIFIC
3.1 Asia-Pacific Glass Fiber Reinforcements Market Overview by Geographic Region
3.2 Asia-Pacific Glass Fiber Reinforcements Market Overview by End-Use Application
3.3 Asia-Pacific Glass Fiber Reinforcements Market Overview by Product Form
3.4 Major Market Players
Baotek Inc. (Taiwan)
Braj Binani Group - Goa Glass Fibre Limited (India)
Central Glass Co., Ltd. (Japan)
Changshu Dongyu Insulated Compound Materials Co., Ltd. (China)
Changzhou Pro-Tech Industry Co., Ltd. (China)
Changzhou Zhongxintianma Fiberglass Products Co., Ltd. (China)
Chengdu Chang Yuan Shun Co., Ltd. (China)
China Jushi Group Co., Ltd. (China)
China Yangzhou Guotai Fiberglass Co., Ltd. (China)
Chongqing Polycomp International Corporation (CPIC) (China)
Chongqing Sanlei Glass Fiber Co., Ltd. (China)
Colan Products Pty Limited (Australia)
Fibrecn International Co., Ltd. (China)
Glotech Industrial Corp. (Taiwan)
Hebei Yuniu Fiberglass Manufacturing Co., Ltd. (China)
Hubei Huierjie New Material Technology Co., Ltd. (China)
Jiangsu Changhai Composite Materials Co., Ltd. (China)
Jiangsu Jiuding New Material Co., Ltd. (China)
Jiangxi Dahua Fiberglass Group Co., Ltd. (China)
KCC Corporation (South Korea)
Kush Synthetics Private Limited (India)
Nippon Electric Glass Co., Ltd. (Japan)
Nippon Sheet Glass Co., Ltd. (Japan)
Nitto Boseki Co., Ltd. (Japan)
Pasia Fiber & Composite Co., Ltd. (China)
PFG Fiber Glass Corporation (Taiwan)
Shaanxi Huatek Fiberglass Material Group Co., Ltd. (China)
Shandong Fiberglass Group Co., Ltd. (China)
Sichuan Weibo New Material Group Co., Ltd. (China)
Sinoma Jinjing Fiberglass Co., Ltd. (China)
Suntex Composite Industrial Co., Ltd. (China)
Taishan Fiberglass Inc. (China)
Taiwan Glass Industry Corporation (Taiwan)
Xingtai Jinniu Fiberglass Co., Ltd. (China)
3.5 Glass Fiber Reinforcements Market Overview by Asia-Pacific Region
3.5.1 Japan
3.5.1.1 Japan Glass Fiber Reinforcements Market Overview by End-Use Application
3.5.1.2 Japan Glass Fiber Reinforcements Market Overview by Product Form
3.5.2 China
3.5.2.1 China Glass Fiber Reinforcements Market Overview by End-Use Application
3.5.2.2 China Glass Fiber Reinforcements Market Overview by Product Form
3.5.3 India
3.5.3.1 India Glass Fiber Reinforcements Market Overview by End-Use Application
3.5.3.2 India Glass Fiber Reinforcements Market Overview by Product Form
3.5.4 South Korea
3.5.4.1 South Korea Glass Fiber Reinforcements Market Overview by End-Use Application
3.5.4.2 South Korea Glass Fiber Reinforcements Market Overview by Product Form
3.5.5 Rest of Asia-Pacific
3.5.5.1 Rest of APAC Glass Fiber Reinforcements Market Overview by End-Use Application
3.5.5.2 Rest of APAC Glass Fiber Reinforcements Market Overview by Product Form
4. REST OF WORLD
4.1 Rest of World Glass Fiber Reinforcements Market Overview by Geographic Region
4.2 Rest of World Glass Fiber Reinforcements Market Overview by End-Use Application
4.3 Rest of World Glass Fiber Reinforcements Market Overview by Product Form
4.4 Major Market Players
Cam Elyaf Sanayii A.S. (SISECAM Group) (Turkey)
CPIC Abahsain Fiberglass W.L.L. (Bahrain)
Eastern Industrial Company (EICO) (Saudi Arabia)
Metyx Composites (Turkey)
ShairCo Fiberglass (Saudi Arabia)
Texiglass Industria E Comercio Textil Ltda (Brazil)
4.5 Glass Fiber Reinforcements Market Overview by Rest of World Region
4.5.1 Russia
4.5.1.1 Russia Glass Fiber Reinforcements Market Overview by End-Use Application
4.5.1.2 Russia Glass Fiber Reinforcements Market Overview by Product Form
4.5.2 Turkey
4.5.2.1 Turkey Glass Fiber Reinforcements Market Overview by End-Use Application
4.5.2.2 Turkey Glass Fiber Reinforcements Market Overview by Product Form
4.5.3 Brazil
4.5.3.1 Brazil Glass Fiber Reinforcements Market Overview by End-Use Application
4.5.3.2 Brazil Glass Fiber Reinforcements Market Overview by Product Form
4.5.4 Other Rest of World
4.5.4.1 Other ROW Glass Fiber Reinforcements Market Overview by End-Use Application
4.5.4.2 Other ROW Glass Fiber Reinforcements Market Overview by Product Form
PART C: GUIDE TO THE INDUSTRY
PART D: ANNEXURE
1. RESEARCH METHODOLOGY
2. FEEDBACK
Charts & Graphs
PART A: GLOBAL MARKET PERSPECTIVE
Chart 1: Global Glass Fiber Reinforcements Market 2014, 2017 and 2024
Chart 2: Global Glass Fiber Reinforcements Market 2017 and 2024 by Geographic Region
Chart 3: Global Glass Fiber Reinforcements Market Analysis 2017 and 2024 by End-Use Application
Chart 4: Global Glass Fiber Reinforcements Market 2017 and 2024 by Product Form
Chart 5: Global Glass Fiber Reinforcements Market for Product Forms (2017) by Geographic Region in Thousand Metric Tons
Chart 6: Glance at 2017 Global and Regional Glass Fiber Reinforcements Market Share (%) by Product Form
Chart 7: Global Glass Fiber Reinforcements Consumption in Automotive & Transportation Applications (2017 & 2024) by Geographic Region in Thousand Metric Tons
Chart 8: Global Glass Fiber Reinforcements Consumption in Marine Applications (2017 & 2024) by Geographic Region in Thousand Metric Tons
Chart 9: Global Glass Fiber Reinforcements Consumption in Wind Energy Applications (2017 & 2024) by Geographic Region in Thousand Metric Tons
Chart 10: Global Glass Fiber Reinforcements Consumption in Pipes, Tanks & Other Corrosion Resistant Equipment Applications (2017 & 2024) by Geographic Region in Thousand Metric Tons
Chart 11: Global Glass Fiber Reinforcements Consumption in Building & Construction Applications (2017 & 2024) by Geographic Region in Thousand Metric Tons
Chart 12: Global Glass Fiber Reinforcements Consumption in Electricals & Electronics Applications (2017 & 2024) by Geographic Region in Thousand Metric Tons
Chart 13: Global Glass Fiber Reinforcements Consumption in Consumer Goods Applications (2017 & 2024) by Geographic Region in Thousand Metric Tons
Chart 14: Global Glass Fiber Reinforcements Consumption in Aerospace & Defense Applications (2017 & 2024) by Geographic Region in Thousand Metric Tons
Chart 15: Global Glass Fiber Reinforcements Consumption in Other Applications (2017 & 2024) by Geographic Region in Thousand Metric Tons
Chart 16: Global Glass Fiber Production Capacities (2017-2020) of Major Companies in Thousand Metric Tons
Chart 17: Global Glass Fiber Production Capacities (2017-2020) by Geographic Region in Thousand Metric Tons
Chart 18: Global Glass Fiber Reinforcements Market Analysis (2014-2024) in Volume (Thousand Metric Tons) and Value (US$ Million)
Chart 19: Global Glass Fiber Reinforcements Market Analysis (2014-2024) by Product Form – Single-end Rovings, Multi-end Rovings, Woven Rovings, Chopped Strands, Chopped Strand Mat (CSM), Continuous Filament Mat (CFM), Fabrics and Others in Thousand Metric Tons
Chart 20: Glance at 2014, 2018 and 2024 Global Glass Fiber Reinforcements Market Share (%) by Product Forms – Single-end Rovings, Multi-end Rovings, Woven Rovings, Chopped Strands, Chopped Strand Mat (CSM), Continuous Filament Mat (CFM), Fabrics and Others
Chart 21: Global Glass Fiber Reinforcements Market Analysis (2014-2024) by End-Use Application – Automotive & Transportation, Marine, Wind Energy, Pipes & Tanks, Building & Construction, Electricals & Electronics, Consumer Goods, Aerospace & Defense and Other in Thousand Metric Tons
Chart 22: Glance at 2014, 2018 and 2024 Global Glass Fiber Reinforcements Market Share (%) by End-Use Application – Automotive & Transportation, Marine, Wind Energy, Pipes & Tanks, Building & Construction, Electricals & Electronics, Consumer Goods, Aerospace & Defense and Other
Chart 23: Global Glass Fiber Reinforcements Market Analysis (2014-2024) by End-Use Application – Automotive & Transportation, Marine, Wind Energy, Pipes & Tanks, Building & Construction, Electricals & Electronics, Consumer Goods, Aerospace & Defense and Other in US$ Million
Chart 24: Glance at 2014, 2018 and 2024 Global Glass Fiber Reinforcements Market Share (%) by End-Use Application – Automotive & Transportation, Marine, Wind Energy, Pipes & Tanks, Building & Construction, Electricals & Electronics, Consumer Goods, Aerospace & Defense and Other
Chart 25: Global Market Analysis of Glass Fiber Reinforcements Application in Automotive & Transportation (2014-2024) by Geographic Region – North America, Europe, Asia-Pacific and Rest of World in Thousand Metric Tons
Chart 26: Glance at 2014, 2018 and 2024 Global Market Share of Glass Fiber Reinforcements Application in Automotive & Transportation (%) by Geographic Region - North America, Europe, Asia-Pacific and Rest of World
Chart 27: Global Market Analysis of Glass Fiber Reinforcements Application in Automotive & Transportation (2014-2024) by Geographic Region – North America, Europe, Asia-Pacific and Rest of World in US$ Million
Chart 28: Glance at 2014, 2018 and 2024 Global Market Share of Glass Fiber Reinforcements Application in Automotive & Transportation (%) by Geographic Region - North America, Europe, Asia-Pacific and Rest of World
Chart 29: Global Market Analysis of Glass Fiber Reinforcements Application in Marine (2014-2024) by Geographic Region – North America, Europe, Asia-Pacific and Rest of World in Thousand Metric Tons
Chart 30: Glance at 2014, 2018 and 2024 Global Market Share of Glass Fiber Reinforcements Application in Marine (%) by Geographic Region - North America, Europe, Asia-Pacific and Rest of World
Chart 31: Global Market Analysis of Glass Fiber Reinforcements Application in Marine (2014-2024) by Geographic Region – North America, Europe, Asia-Pacific and Rest of World in US$ Million
Chart 32: Glance at 2014, 2018 and 2024 Global Market Share of Glass Fiber Reinforcements Application in Marine (%) by Geographic Region - North America, Europe, Asia-Pacific and Rest of World
Chart 33: Global Market Analysis of Glass Fiber Reinforcements Application in Wind Energy (2014-2024) by Geographic Region – North America, Europe, Asia-Pacific and Rest of World in Thousand Metric Tons
Chart 34: Glance at 2014, 2018 and 2024 Global Market Share of Glass Fiber Reinforcements Application in Wind Energy (%) by Geographic Region - North America, Europe, Asia-Pacific and Rest of World
Chart 35: Global Market Analysis of Glass Fiber Reinforcements Application in Wind Energy (2014-2024) by Geographic Region – North America, Europe, Asia-Pacific and Rest of World in US$ Million
Chart 36: Glance at 2014, 2018 and 2024 Global Market Share of Glass Fiber Reinforcements Application in Wind Energy (%) by Geographic Region - North America, Europe, Asia-Pacific and Rest of World
Chart 37: Global Market Analysis of Glass Fiber Reinforcements Application in Pipes & Tanks (2014-2024) by Geographic Region – North America, Europe, Asia-Pacific and Rest of World in Thousand Metric Tons
Chart 38: Glance at 2014, 2018 and 2024 Global Market Share of Glass Fiber Reinforcements Application in Pipes & Tanks (%) by Geographic Region - North America, Europe, Asia-Pacific and Rest of World
Chart 39: Global Market Analysis of Glass Fiber Reinforcements Application in Pipes & Tanks (2014-2024) by Geographic Region – North America, Europe, Asia-Pacific and Rest of World in US$ Million
Chart 40: Glance at 2014, 2018 and 2024 Global Market Share of Glass Fiber Reinforcements Application in Pipes & Tanks (%) by Geographic Region - North America, Europe, Asia-Pacific and Rest of World
Chart 41: Global Market Analysis of Glass Fiber Reinforcements Application in Building & Construction (2014-2024) by Geographic Region – North America, Europe, Asia-Pacific and Rest of World in Thousand Metric Tons
Chart 42: Glance at 2014, 2018 and 2024 Global Market Share of Glass Fiber Reinforcements Application in Building & Construction (%) by Geographic Region - North America, Europe, Asia-Pacific and Rest of World
Chart 43: Global Market Analysis of Glass Fiber Reinforcements Application in Building & Construction (2014-2024) by Geographic Region – North America, Europe, Asia-Pacific and Rest of World in US$ Million
Chart 44: Glance at 2014, 2018 and 2024 Global Market Share of Glass Fiber Reinforcements Application in Building & Construction (%) by Geographic Region - North America, Europe, Asia-Pacific and Rest of World
Chart 45: Global Market Analysis of Glass Fiber Reinforcements Application in Electricals & Electronics (2014-2024) by Geographic Region – North America, Europe, Asia-Pacific and Rest of World in Thousand Metric Tons
Chart 46: Glance at 2014, 2018 and 2024 Global Market Share of Glass Fiber Reinforcements Application in Electricals & Electronics (%) by Geographic Region - North America, Europe, Asia-Pacific and Rest of World
Chart 47: Global Market Analysis of Glass Fiber Reinforcements Application in Electricals & Electronics (2014-2024) by Geographic Region – North America, Europe, Asia-Pacific and Rest of World in US$ Million
Chart 48: Glance at 2014, 2018 and 2024 Global Market Share of Glass Fiber Reinforcements Application in Electricals & Electronics (%) by Geographic Region - North America, Europe, Asia-Pacific and Rest of World
Chart 49: Global Market Analysis of Glass Fiber Reinforcements Application in Consumer Goods (2014-2024) by Geographic Region – North America, Europe, Asia-Pacific and Rest of World in Thousand Metric Tons
Chart 50: Glance at 2014, 2018 and 2024 Global Market Share of Glass Fiber Reinforcements Application in Consumer Goods (%) by Geographic Region - North America, Europe, Asia-Pacific and Rest of World
Chart 51: Global Market Analysis of Glass Fiber Reinforcements Application in Consumer Goods (2014-2024) by Geographic Region – North America, Europe, Asia-Pacific and Rest of World in US$ Million
Chart 52: Glance at 2014, 2018 and 2024 Global Market Share of Glass Fiber Reinforcements Application in Consumer Goods (%) by Geographic Region - North America, Europe, Asia-Pacific and Rest of World
Chart 53: Global Market Analysis of Glass Fiber Reinforcements Application in Aerospace & Defense (2014-2024) by Geographic Region – North America, Europe, Asia-Pacific and Rest of World in Thousand Metric Tons
Chart 54: Glance at 2014, 2018 and 2024 Global Market Share of Glass Fiber Reinforcements Application in Aerospace & Defense (%) by Geographic Region - North America, Europe, Asia-Pacific and Rest of World
Chart 55: Global Market Analysis of Glass Fiber Reinforcements Application in Aerospace & Defense (2014-2024) by Geographic Region – North America, Europe, Asia-Pacific and Rest of World in US$ Million
Chart 56: Glance at 2014, 2018 and 2024 Global Market Share of Glass Fiber Reinforcements Application in Aerospace & Defense (%) by Geographic Region - North America, Europe, Asia-Pacific and Rest of World
Chart 57: Global Market Analysis of Glass Fiber Reinforcements Application in Others (2014-2024) by Geographic Region – North America, Europe, Asia-Pacific and Rest of World in Thousand Metric Tons
Chart 58: Glance at 2014, 2018 and 2024 Global Market Share of Glass Fiber Reinforcements Application in Others (%) by Geographic Region - North America, Europe, Asia-Pacific and Rest of World
Chart 59: Global Market Analysis of Glass Fiber Reinforcements Application in Others (2014-2024) by Geographic Region – North America, Europe, Asia-Pacific and Rest of World in US$ Million
Chart 60: Glance at 2014, 2018 and 2024 Global Market Share of Glass Fiber Reinforcements Application in Others (%) by Geographic Region - North America, Europe, Asia-Pacific and Rest of World
PART B: REGIONAL MARKET PERSPECTIVE
Chart 61: Global Glass Fiber Reinforcements Market Analysis (2014-2024) by Geographic Region - North America, Europe, Asia-Pacific and Rest of World in Thousand Metric Tons
Chart 62: Glance at 2014, 2018 and 2024 Global Glass Fiber Reinforcements Market Share (%) by Geographic Region - North America, Europe, Asia-Pacific and Rest of World
Chart 63: Global Glass Fiber Reinforcements Market Analysis (2014-2024) by Geographic Region - North America, Europe, Asia-Pacific and Rest of World in US$ Million
Chart 64: Glance at 2014, 2018 and 2024 Global Glass Fiber Reinforcements Market Share (%) by Geographic Region - North America, Europe, Asia-Pacific and Rest of World
REGIONAL MARKET OVERVIEW
NORTH AMERICA
Chart 65: North American Glass Fiber Reinforcements Market Analysis (2014-2024) in Volume (Thousand Metric Tons) and Value (US$ Million)
Chart 66: North American Glass Fiber Reinforcements Market Analysis (2014-2024) by Geographic Region - United States and Canada in Thousand Metric Tons
Chart 67: Glance at 2014, 2018 and 2024 North American Glass Fiber Reinforcements Market Share (%) by Geographic Region - United States and Canada
Chart 68: North American Glass Fiber Reinforcements Market Analysis (2014-2024) by Geographic Region - United States and Canada in US$ Million
Chart 69: Glance at 2014, 2018 and 2024 North American Glass Fiber Reinforcements Market Share (%) by Geographic Region - United States and Canada
Chart 70: North American Glass Fiber Reinforcements Market Analysis (2014-2024) by End-Use Application – Automotive & Transportation, Marine, Wind Energy, Pipes & Tanks, Building & Construction, Electricals & Electronics, Consumer Goods, Aerospace & Defense and Other in Thousand Metric Tons
Chart 71: Glance at 2014, 2018 and 2024 North American Glass Fiber Reinforcements Market Share (%) by End-Use Application – Automotive & Transportation, Marine, Wind Energy, Pipes & Tanks, Building & Construction, Electricals & Electronics, Consumer Goods, Aerospace & Defense and Other
Chart 72: North American Glass Fiber Reinforcements Market Analysis (2014-2024) by End-Use Application – Automotive & Transportation, Marine, Wind Energy, Pipes & Tanks, Building & Construction, Electricals & Electronics, Consumer Goods, Aerospace & Defense and Other in US$ Million
Chart 73: Glance at 2014, 2018 and 2024 North American Glass Fiber Reinforcements Market Share (%) by End-Use Application – Automotive & Transportation, Marine, Wind Energy, Pipes & Tanks, Building & Construction, Electricals & Electronics, Consumer Goods, Aerospace & Defense and Other
Chart 74: North American Glass Fiber Reinforcements Market Analysis (2014-2024) by Product Form – Single-end Rovings, Multi-end Rovings, Woven Rovings, Chopped Strands, Chopped Strand Mat (CSM), Continuous Filament Mat (CFM), Fabrics and Others in Thousand Metric Tons
Chart 75: Glance at 2014, 2018 and 2024 North American Glass Fiber Reinforcements Market Share (%) by Product Form – Single-end Rovings, Multi-end Rovings, Woven Rovings, Chopped Strands, Chopped Strand Mat (CSM), Continuous Filament Mat (CFM), Fabrics and Others
The United States
Chart 76: United States Glass Fiber Reinforcements Market Analysis (2014-2024) in Volume (Thousand Metric Tons) and Value (US$ Million)
Chart 77: United States Glass Fiber Reinforcements Market Analysis (2014-2024) by End-Use Application – Automotive & Transportation, Marine, Wind Energy, Pipes & Tanks, Building & Construction, Electricals & Electronics, Consumer Goods, Aerospace & Defense and Other in Thousand Metric Tons
Chart 78: Glance at 2014, 2018 and 2024 United States Glass Fiber Reinforcements Market Share (%) by End-Use Application – Automotive & Transportation, Marine, Wind Energy, Pipes & Tanks, Building & Construction, Electricals & Electronics, Consumer Goods, Aerospace & Defense and Other
Chart 79: United States Glass Fiber Reinforcements Market Analysis (2014-2024) by End-Use Application – Automotive & Transportation, Marine, Wind Energy, Pipes & Tanks, Building & Construction, Electricals & Electronics, Consumer Goods, Aerospace & Defense and Other in US$ Million
Chart 80: Glance at 2014, 2018 and 2024 United States Glass Fiber Reinforcements Market Share (%) by End-Use Application – Automotive & Transportation, Marine, Wind Energy, Pipes & Tanks, Building & Construction, Electricals & Electronics, Consumer Goods, Aerospace & Defense and Other
Chart 81: United States Glass Fiber Reinforcements Market Analysis (2014-2024) by Product Form – Single-end Rovings, Multi-end Rovings, Woven Rovings, Chopped Strands, Chopped Strand Mat (CSM), Continuous Filament Mat (CFM), Fabrics and Others in Thousand Metric Tons
Chart 82: Glance at 2014, 2018 and 2024 United States Glass Fiber Reinforcements Market Share (%) by Product Form – Single-end Rovings, Multi-end Rovings, Woven Rovings, Chopped Strands, Chopped Strand Mat (CSM), Continuous Filament Mat (CFM), Fabrics and Others
Canada
Chart 83: Canada Glass Fiber Reinforcements Market Analysis (2014-2024) in Volume (Thousand Metric Tons) and Value (US$ Million)
Chart 84: Canada Glass Fiber Reinforcements Market Analysis (2014-2024) by End-Use Application – Automotive & Transportation, Marine, Wind Energy, Pipes & Tanks, Building & Construction, Electricals & Electronics, Consumer Goods, Aerospace & Defense and Other in Thousand Metric Tons
Chart 85: Glance at 2014, 2018 and 2024 Canada Glass Fiber Reinforcements Market Share (%) by End-Use Application – Automotive & Transportation, Marine, Wind Energy, Pipes & Tanks, Building & Construction, Electricals & Electronics, Consumer Goods, Aerospace & Defense and Other
Chart 86: Canada Glass Fiber Reinforcements Market Analysis (2014-2024) by End-Use Application – Automotive & Transportation, Marine, Wind Energy, Pipes & Tanks, Building & Construction, Electricals & Electronics, Consumer Goods, Aerospace & Defense and Other in US$ Million
Chart 87: Glance at 2014, 2018 and 2024 Canada Glass Fiber Reinforcements Market Share (%) by End-Use Application – Automotive & Transportation, Marine, Wind Energy, Pipes & Tanks, Building & Construction, Electricals & Electronics, Consumer Goods, Aerospace & Defense and Other
Chart 88: Canada Glass Fiber Reinforcements Market Analysis (2014-2024) by Product Form – Single-end Rovings, Multi-end Rovings, Woven Rovings, Chopped Strands, Chopped Strand Mat (CSM), Continuous Filament Mat (CFM), Fabrics and Others in Thousand Metric Tons
Chart 89: Glance at 2014, 2018 and 2024 Canada Glass Fiber Reinforcements Market Share (%) by Product Form – Single-end Rovings, Multi-end Rovings, Woven Rovings, Chopped Strands, Chopped Strand Mat (CSM), Continuous Filament Mat (CFM), Fabrics and Others
EUROPE
Chart 90: European Glass Fiber Reinforcements Market Analysis (2014-2024) in Volume (Thousand Metric Tons) and Value (US$ Million)
Chart 91: European Glass Fiber Reinforcements Market Analysis (2014-2024) by Geographic Region - Germany, France, Italy, Spain, the United Kingdom and Rest of Europe in Thousand Metric Tons
Chart 92: Glance at 2014, 2018 and 2024 European Glass Fiber Reinforcements Market Share (%) by Geographic Region - Germany, France, Italy, Spain, the United Kingdom and Rest of Europe
Chart 93: European Glass Fiber Reinforcements Market Analysis (2014-2024) by Geographic Region - Germany, France, Italy, Spain, the United Kingdom and Rest of Europe in US$ Million
Chart 94: Glance at 2014, 2018 and 2024 European Glass Fiber Reinforcements Market Share (%) by Geographic Region - Germany, France, Italy, Spain, the United Kingdom and Rest of Europe
Chart 95: European Glass Fiber Reinforcements Market Analysis (2014-2024) by End-Use Application – Automotive & Transportation, Marine, Wind Energy, Pipes & Tanks, Building & Construction, Electricals & Electronics, Consumer Goods, Aerospace & Defense and Other in Thousand Metric Tons
Chart 96: Glance at 2014, 2018 and 2024 European Glass Fiber Reinforcements Market Share (%) by End-Use Application – Automotive & Transportation, Marine, Wind Energy, Pipes & Tanks, Building & Construction, Electricals & Electronics, Consumer Goods, Aerospace & Defense and Other
Chart 97: European Glass Fiber Reinforcements Market Analysis (2014-2024) by End-Use Application – Automotive & Transportation, Marine, Wind Energy, Pipes & Tanks, Building & Construction, Electricals & Electronics, Consumer Goods, Aerospace & Defense and Other in US$ Million
Chart 98: Glance at 2014, 2018 and 2024 European Glass Fiber Reinforcements Market Share (%) by End-Use Application – Automotive & Transportation, Marine, Wind Energy, Pipes & Tanks, Building & Construction, Electricals & Electronics, Consumer Goods, Aerospace & Defense and Other
Chart 99: European Glass Fiber Reinforcements Market Analysis (2014-2024) by Product Form – Single-end Rovings, Multi-end Rovings, Woven Rovings, Chopped Strands, Chopped Strand Mat (CSM), Continuous Filament Mat (CFM), Fabrics and Others in Thousand Metric Tons
Chart 100: Glance at 2014, 2018 and 2024 European Glass Fiber Reinforcements Market Share (%) by Product Form – Single-end Rovings, Multi-end Rovings, Woven Rovings, Chopped Strands, Chopped Strand Mat (CSM), Continuous Filament Mat (CFM), Fabrics and Others
Germany
Chart 101: Germany Glass Fiber Reinforcements Market Analysis (2014-2024) in Volume (Thousand Metric Tons) and Value (US$ Million)
Chart 102: Germany Glass Fiber Reinforcements Market Analysis (2014-2024) by End-Use Application – Automotive & Transportation, Marine, Wind Energy, Pipes & Tanks, Building & Construction, Electricals & Electronics, Consumer Goods, Aerospace & Defense and Other in Thousand Metric Tons
Chart 103: Glance at 2014, 2018 and 2024 Germany Glass Fiber Reinforcements Market Share (%) by End-Use Application – Automotive & Transportation, Marine, Wind Energy, Pipes & Tanks, Building & Construction, Electricals & Electronics, Consumer Goods, Aerospace & Defense and Other
Chart 104: Germany Glass Fiber Reinforcements Market Analysis (2014-2024) by End-Use Application – Automotive & Transportation, Marine, Wind Energy, Pipes & Tanks, Building & Construction, Electricals & Electronics, Consumer Goods, Aerospace & Defense and Other in US$ Million
Chart 105: Glance at 2014, 2018 and 2024 Germany Glass Fiber Reinforcements Market Share (%) by End-Use Application – Automotive & Transportation, Marine, Wind Energy, Pipes & Tanks, Building & Construction, Electricals & Electronics, Consumer Goods, Aerospace & Defense and Other
Chart 106: Germany Glass Fiber Reinforcements Market Analysis (2014-2024) by Product Form – Single-end Rovings, Multi-end Rovings, Woven Rovings, Chopped Strands, Chopped Strand Mat (CSM), Continuous Filament Mat (CFM), Fabrics and Others in Thousand Metric Tons
Chart 107: Glance at 2014, 2018 and 2024 Germany Glass Fiber Reinforcements Market Share (%) by Product Form – Single-end Rovings, Multi-end Rovings, Woven Rovings, Chopped Strands, Chopped Strand Mat (CSM), Continuous Filament Mat (CFM), Fabrics and Others
France
Chart 108: France Glass Fiber Reinforcements Market Analysis (2014-2024) in Volume (Thousand Metric Tons) and Value (US$ Million)
Chart 109: France Glass Fiber Reinforcements Market Analysis (2014-2024) by End-Use Application – Automotive & Transportation, Marine, Wind Energy, Pipes & Tanks, Building & Construction, Electricals & Electronics, Consumer Goods, Aerospace & Defense and Other in Thousand Metric Tons
Chart 110: Glance at 2014, 2018 and 2024 France Glass Fiber Reinforcements Market Share (%) by End-Use Application – Automotive & Transportation, Marine, Wind Energy, Pipes & Tanks, Building & Construction, Electricals & Electronics, Consumer Goods, Aerospace & Defense and Other
Chart 111: France Glass Fiber Reinforcements Market Analysis (2014-2024) by End-Use Application – Automotive & Transportation, Marine, Wind Energy, Pipes & Tanks, Building & Construction, Electricals & Electronics, Consumer Goods, Aerospace & Defense and Other in US$ Million
Chart 112: Glance at 2014, 2018 and 2024 France Glass Fiber Reinforcements Market Share (%) by End-Use Application – Automotive & Transportation, Marine, Wind Energy, Pipes & Tanks, Building & Construction, Electricals & Electronics, Consumer Goods, Aerospace & Defense and Other
Chart 113: France Glass Fiber Reinforcements Market Analysis (2014-2024) by Product Form – Single-end Rovings, Multi-end Rovings, Woven Rovings, Chopped Strands, Chopped Strand Mat (CSM), Continuous Filament Mat (CFM), Fabrics and Others in Thousand Metric Tons
Chart 114: Glance at 2014, 2018 and 2024 France Glass Fiber Reinforcements Market Share (%) by Product Form – Single-end Rovings, Multi-end Rovings, Woven Rovings, Chopped Strands, Chopped Strand Mat (CSM), Continuous Filament Mat (CFM), Fabrics and Others
Italy
Chart 115: Italy Glass Fiber Reinforcements Market Analysis (2014-2024) in Volume (Thousand Metric Tons) and Value (US$ Million)
Chart 116: Italy Glass Fiber Reinforcements Market Analysis (2014-2024) by End-Use Application – Automotive & Transportation, Marine, Wind Energy, Pipes & Tanks, Building & Construction, Electricals & Electronics, Consumer Goods, Aerospace & Defense and Other in Thousand Metric Tons
Chart 117: Glance at 2014, 2018 and 2024 Italy Glass Fiber Reinforcements Market Share (%) by End-Use Application – Automotive & Transportation, Marine, Wind Energy, Pipes & Tanks, Building & Construction, Electricals & Electronics, Consumer Goods, Aerospace & Defense and Other
Chart 118: Italy Glass Fiber Reinforcements Market Analysis (2014-2024) by End-Use Application – Automotive & Transportation, Marine, Wind Energy, Pipes & Tanks, Building & Construction, Electricals & Electronics, Consumer Goods, Aerospace & Defense and Other in US$ Million
Chart 119: Glance at 2014, 2018 and 2024 Italy Glass Fiber Reinforcements Market Share (%) by End-Use Application – Automotive & Transportation, Marine, Wind Energy, Pipes & Tanks, Building & Construction, Electricals & Electronics, Consumer Goods, Aerospace & Defense and Other
Chart 120: Italy Glass Fiber Reinforcements Market Analysis (2014-2024) by Product Form – Single-end Rovings, Multi-end Rovings, Woven Rovings, Chopped Strands, Chopped Strand Mat (CSM), Continuous Filament Mat (CFM), Fabrics and Others in Thousand Metric Tons
Chart 121: Glance at 2014, 2018 and 2024 Italy Glass Fiber Reinforcements Market Share (%) by Product Form – Single-end Rovings, Multi-end Rovings, Woven Rovings, Chopped Strands, Chopped Strand Mat (CSM), Continuous Filament Mat (CFM), Fabrics and Others
Spain
Chart 122: Spain Glass Fiber Reinforcements Market Analysis (2014-2024) in Volume (Thousand Metric Tons) and Value (US$ Million)
Chart 123: Spain Glass Fiber Reinforcements Market Analysis (2014-2024) by End-Use Application – Automotive & Transportation, Marine, Wind Energy, Pipes & Tanks, Building & Construction, Electricals & Electronics, Consumer Goods, Aerospace & Defense and Other in Thousand Metric Tons
Chart 124: Glance at 2014, 2018 and 2024 Spain Glass Fiber Reinforcements Market Share (%) by End-Use Application – Automotive & Transportation, Marine, Wind Energy, Pipes & Tanks, Building & Construction, Electricals & Electronics, Consumer Goods, Aerospace & Defense and Other
Chart 125: Spain Glass Fiber Reinforcements Market Analysis (2014-2024) by End-Use Application – Automotive & Transportation, Marine, Wind Energy, Pipes & Tanks, Building & Construction, Electricals & Electronics, Consumer Goods, Aerospace & Defense and Other in US$ Million
Chart 126: Glance at 2014, 2018 and 2024 Spain Glass Fiber Reinforcements Market Share (%) by End-Use Application – Automotive & Transportation, Marine, Wind Energy, Pipes & Tanks, Building & Construction, Electricals & Electronics, Consumer Goods, Aerospace & Defense and Other
Chart 127: Spain Glass Fiber Reinforcements Market Analysis (2014-2024) by Product Form – Single-end Rovings, Multi-end Rovings, Woven Rovings, Chopped Strands, Chopped Strand Mat (CSM), Continuous Filament Mat (CFM), Fabrics and Others in Thousand Metric Tons
Chart 128: Glance at 2014, 2018 and 2024 Spain Glass Fiber Reinforcements Market Share (%) by Product Form – Single-end Rovings, Multi-end Rovings, Woven Rovings, Chopped Strands, Chopped Strand Mat (CSM), Continuous Filament Mat (CFM), Fabrics and Others
The United Kingdom
Chart 129: The United Kingdom Glass Fiber Reinforcements Market Analysis (2014-2024) in Volume (Thousand Metric Tons) and Value (US$ Million)
Chart 130: United Kingdom Glass Fiber Reinforcements Market Analysis (2014-2024) by End-Use Application – Automotive & Transportation, Marine, Wind Energy, Pipes & Tanks, Building & Construction, Electricals & Electronics, Consumer Goods, Aerospace & Defense and Other in Thousand Metric Tons
Chart 131: Glance at 2014, 2018 and 2024 United Kingdom Glass Fiber Reinforcements Market Share (%) by End-Use Application – Automotive & Transportation, Marine, Wind Energy, Pipes & Tanks, Building & Construction, Electricals & Electronics, Consumer Goods, Aerospace & Defense and Other
Chart 132: United Kingdom Glass Fiber Reinforcements Market Analysis (2014-2024) by End-Use Application – Automotive & Transportation, Marine, Wind Energy, Pipes & Tanks, Building & Construction, Electricals & Electronics, Consumer Goods, Aerospace & Defense and Other in US$ Million
Chart 133: Glance at 2014, 2018 and 2024 United Kingdom Glass Fiber Reinforcements Market Share (%) by End-Use Application – Automotive & Transportation, Marine, Wind Energy, Pipes & Tanks, Building & Construction, Electricals & Electronics, Consumer Goods, Aerospace & Defense and Other
Chart 134: United Kingdom Glass Fiber Reinforcements Market Analysis (2014-2024) by Product Form – Single-end Rovings, Multi-end Rovings, Woven Rovings, Chopped Strands, Chopped Strand Mat (CSM), Continuous Filament Mat (CFM), Fabrics and Others in Thousand Metric Tons
Chart 135: Glance at 2014, 2018 and 2024 United Kingdom Glass Fiber Reinforcements Market Share (%) by Product Form – Single-end Rovings, Multi-end Rovings, Woven Rovings, Chopped Strands, Chopped Strand Mat (CSM), Continuous Filament Mat (CFM), Fabrics and Others
Rest of Europe
Chart 136: Rest of Europe Glass Fiber Reinforcements Market Analysis (2014-2024) in Volume (Thousand Metric Tons) and Value (US$ Million)
Chart 137: Rest of Europe Glass Fiber Reinforcements Market Analysis (2014-2024) by End-Use Application – Automotive & Transportation, Marine, Wind Energy, Pipes & Tanks, Building & Construction, Electricals & Electronics, Consumer Goods, Aerospace & Defense and Other in Thousand Metric Tons
Chart 138: Glance at 2014, 2018 and 2024 Rest of Europe Glass Fiber Reinforcements Market Share (%) by End-Use Application – Automotive & Transportation, Marine, Wind Energy, Pipes & Tanks, Building & Construction, Electricals & Electronics, Consumer Goods, Aerospace & Defense and Other
Chart 139: Rest of Europe Glass Fiber Reinforcements Market Analysis (2014-2024) by End-Use Application – Automotive & Transportation, Marine, Wind Energy, Pipes & Tanks, Building & Construction, Electricals & Electronics, Consumer Goods, Aerospace & Defense and Other in US$ Million
Chart 140: Glance at 2014, 2018 and 2024 Rest of Europe Glass Fiber Reinforcements Market Share (%) by End-Use Application – Automotive & Transportation, Marine, Wind Energy, Pipes & Tanks, Building & Construction, Electricals & Electronics, Consumer Goods, Aerospace & Defense and Other
Chart 141: Rest of Europe Glass Fiber Reinforcements Market Analysis (2014-2024) by Product Form – Single-end Rovings, Multi-end Rovings, Woven Rovings, Chopped Strands, Chopped Strand Mat (CSM), Continuous Filament Mat (CFM), Fabrics and Others in Thousand Metric Tons
Chart 142: Glance at 2014, 2018 and 2024 Rest of Europe Glass Fiber Reinforcements Market Share (%) by Product Form – Single-end Rovings, Multi-end Rovings, Woven Rovings, Chopped Strands, Chopped Strand Mat (CSM), Continuous Filament Mat (CFM), Fabrics and Others
ASIA-PACIFIC
Chart 143: Asia-Pacific Glass Fiber Reinforcements Market Analysis (2014-2024) in Volume (Thousand Metric Tons) and Value (US$ Million)
Chart 144: Asia-Pacific Glass Fiber Reinforcements Market Analysis (2014-2024) by Geographic Region - Japan, China, India, South Korea and Rest of APAC in Thousand Metric Tons
Chart 145: Glance at 2014, 2018 and 2024 Asia-Pacific Glass Fiber Reinforcements Market Share (%) by Geographic Region - Japan, China, India, South Korea and Rest of APAC
Chart 146: Asia-Pacific Glass Fiber Reinforcements Market Analysis (2014-2024) by Geographic Region - Japan, China, India, South Korea and Rest of APAC in US$ Million
Chart 147: Glance at 2014, 2018 and 2024 Asia-Pacific Glass Fiber Reinforcements Market Share (%) by Geographic Region - Japan, China, India, South Korea and Rest of APAC
Chart 148: Asia-Pacific Glass Fiber Reinforcements Market Analysis (2014-2024) by End-Use Application – Automotive & Transportation, Marine, Wind Energy, Pipes & Tanks, Building & Construction, Electricals & Electronics, Consumer Goods, Aerospace & Defense and Other in Thousand Metric Tons
Chart 149: Glance at 2014, 2018 and 2024 Asia-Pacific Glass Fiber Reinforcements Market Share (%) by End-Use Application – Automotive & Transportation, Marine, Wind Energy, Pipes & Tanks, Building & Construction, Electricals & Electronics, Consumer Goods, Aerospace & Defense and Other
Chart 150: Asia-Pacific Glass Fiber Reinforcements Market Analysis (2014-2024) by End-Use Application – Automotive & Transportation, Marine, Wind Energy, Pipes & Tanks, Building & Construction, Electricals & Electronics, Consumer Goods, Aerospace & Defense and Other in US$ Million
Chart 151: Glance at 2014, 2018 and 2024 Asia-Pacific Glass Fiber Reinforcements Market Share (%) by End-Use Application – Automotive & Transportation, Marine, Wind Energy, Pipes & Tanks, Building & Construction, Electricals & Electronics, Consumer Goods, Aerospace & Defense and Other
Chart 152: Asia-Pacific Glass Fiber Reinforcements Market Analysis (2014-2024) by Product Form – Single-end Rovings, Multi-end Rovings, Woven Rovings, Chopped Strands, Chopped Strand Mat (CSM), Continuous Filament Mat (CFM), Fabrics and Others in Thousand Metric Tons
Chart 153: Glance at 2014, 2018 and 2024 Asia-Pacific Glass Fiber Reinforcements Market Share (%) by Product Form – Single-end Rovings, Multi-end Rovings, Woven Rovings, Chopped Strands, Chopped Strand Mat (CSM), Continuous Filament Mat (CFM), Fabrics and Others
Japan
Chart 154: Japan Glass Fiber Reinforcements Market Analysis (2014-2024) in Volume (Thousand Metric Tons) and Value (US$ Million)
Chart 155: Japan Glass Fiber Reinforcements Market Analysis (2014-2024) by End-Use Application – Automotive & Transportation, Marine, Wind Energy, Pipes & Tanks, Building & Construction, Electricals & Electronics, Consumer Goods, Aerospace & Defense and Other in Thousand Metric Tons
Chart 156: Glance at 2014, 2018 and 2024 Japan Glass Fiber Reinforcements Market Share (%) by End-Use Application – Automotive & Transportation, Marine, Wind Energy, Pipes & Tanks, Building & Construction, Electricals & Electronics, Consumer Goods, Aerospace & Defense and Other
Chart 157: Japan Glass Fiber Reinforcements Market Analysis (2014-2024) by End-Use Application – Automotive & Transportation, Marine, Wind Energy, Pipes & Tanks, Building & Construction, Electricals & Electronics, Consumer Goods, Aerospace & Defense and Other in US$ Million
Chart 158: Glance at 2014, 2018 and 2024 Japan Glass Fiber Reinforcements Market Share (%) by End-Use Application – Automotive & Transportation, Marine, Wind Energy, Pipes & Tanks, Building & Construction, Electricals & Electronics, Consumer Goods, Aerospace & Defense and Other
Chart 159: Japan Glass Fiber Reinforcements Market Analysis (2014-2024) by Product Form – Single-end Rovings, Multi-end Rovings, Woven Rovings, Chopped Strands, Chopped Strand Mat (CSM), Continuous Filament Mat (CFM), Fabrics and Others in Thousand Metric Tons
Chart 160: Glance at 2014, 2018 and 2024 Japan Glass Fiber Reinforcements Market Share (%) by Product Form – Single-end Rovings, Multi-end Rovings, Woven Rovings, Chopped Strands, Chopped Strand Mat (CSM), Continuous Filament Mat (CFM), Fabrics and Others
China
Chart 161: China Glass Fiber Reinforcements Market Analysis (2014-2024) in Volume (Thousand Metric Tons) and Value (US$ Million)
Chart 162: China Glass Fiber Reinforcements Market Analysis (2014-2024) by End-Use Application – Automotive & Transportation, Marine, Wind Energy, Pipes & Tanks, Building & Construction, Electricals & Electronics, Consumer Goods, Aerospace & Defense and Other in Thousand Metric Tons
Chart 163: Glance at 2014, 2018 and 2024 China Glass Fiber Reinforcements Market Share (%) by End-Use Application – Automotive & Transportation, Marine, Wind Energy, Pipes & Tanks, Building & Construction, Electricals & Electronics, Consumer Goods, Aerospace & Defense and Other
Chart 164: China Glass Fiber Reinforcements Market Analysis (2014-2024) by End-Use Application – Automotive & Transportation, Marine, Wind Energy, Pipes & Tanks, Building & Construction, Electricals & Electronics, Consumer Goods, Aerospace & Defense and Other in US$ Million
Chart 165: Glance at 2014, 2018 and 2024 China Glass Fiber Reinforcements Market Share (%) by End-Use Application – Automotive & Transportation, Marine, Wind Energy, Pipes & Tanks, Building & Construction, Electricals & Electronics, Consumer Goods, Aerospace & Defense and Other
Chart 166: China Glass Fiber Reinforcements Market Analysis (2014-2024) by Product Form – Single-end Rovings, Multi-end Rovings, Woven Rovings, Chopped Strands, Chopped Strand Mat (CSM), Continuous Filament Mat (CFM), Fabrics and Others in Thousand Metric Tons
Chart 167: Glance at 2014, 2018 and 2024 China Glass Fiber Reinforcements Market Share (%) by Product Form – Single-end Rovings, Multi-end Rovings, Woven Rovings, Chopped Strands, Chopped Strand Mat (CSM), Continuous Filament Mat (CFM), Fabrics and Others
India
Chart 168: India Glass Fiber Reinforcements Market Analysis (2014-2024) in Volume (Thousand Metric Tons) and Value (US$ Million)
Chart 169: India Glass Fiber Reinforcements Market Analysis (2014-2024) by End-Use Application – Automotive & Transportation, Marine, Wind Energy, Pipes & Tanks, Building & Construction, Electricals & Electronics, Consumer Goods, Aerospace & Defense and Other in Thousand Metric Tons
Chart 170: Glance at 2014, 2018 and 2024 India Glass Fiber Reinforcements Market Share (%) by End-Use Application – Automotive & Transportation, Marine, Wind Energy, Pipes & Tanks, Building & Construction, Electricals & Electronics, Consumer Goods, Aerospace & Defense and Other
Chart 171: India Glass Fiber Reinforcements Market Analysis (2014-2024) by End-Use Application – Automotive & Transportation, Marine, Wind Energy, Pipes & Tanks, Building & Construction, Electricals & Electronics, Consumer Goods, Aerospace & Defense and Other in US$ Million
Chart 172: Glance at 2014, 2018 and 2024 India Glass Fiber Reinforcements Market Share (%) by End-Use Application – Automotive & Transportation, Marine, Wind Energy, Pipes & Tanks, Building & Construction, Electricals & Electronics, Consumer Goods, Aerospace & Defense and Other
Chart 173: India Glass Fiber Reinforcements Market Analysis (2014-2024) by Product Form – Single-end Rovings, Multi-end Rovings, Woven Rovings, Chopped Strands, Chopped Strand Mat (CSM), Continuous Filament Mat (CFM), Fabrics and Others in Thousand Metric Tons
Chart 174: Glance at 2014, 2018 and 2024 India Glass Fiber Reinforcements Market Share (%) by Product Form – Single-end Rovings, Multi-end Rovings, Woven Rovings, Chopped Strands, Chopped Strand Mat (CSM), Continuous Filament Mat (CFM), Fabrics and Others
South Korea
Chart 175: South Korea Glass Fiber Reinforcements Market Analysis (2014-2024) in Volume (Thousand Metric Tons) and Value (US$ Million)
Chart 176: South Korea Glass Fiber Reinforcements Market Analysis (2014-2024) by End-Use Application – Automotive & Transportation, Marine, Wind Energy, Pipes & Tanks, Building & Construction, Electricals & Electronics, Consumer Goods, Aerospace & Defense and Other in Thousand Metric Tons
Chart 177: Glance at 2014, 2018 and 2024 South Korea Glass Fiber Reinforcements Market Share (%) by End-Use Application – Automotive & Transportation, Marine, Wind Energy, Pipes & Tanks, Building & Construction, Electricals & Electronics, Consumer Goods, Aerospace & Defense and Other
Chart 178: South Korea Glass Fiber Reinforcements Market Analysis (2014-2024) by End-Use Application – Automotive & Transportation, Marine, Wind Energy, Pipes & Tanks, Building & Construction, Electricals & Electronics, Consumer Goods, Aerospace & Defense and Other in US$ Million
Chart 179: Glance at 2014, 2018 and 2024 South Korea Glass Fiber Reinforcements Market Share (%) by End-Use Application – Automotive & Transportation, Marine, Wind Energy, Pipes & Tanks, Building & Construction, Electricals & Electronics, Consumer Goods, Aerospace & Defense and Other
Chart 180: South Korea Glass Fiber Reinforcements Market Analysis (2014-2024) by Product Form – Single-end Rovings, Multi-end Rovings, Woven Rovings, Chopped Strands, Chopped Strand Mat (CSM), Continuous Filament Mat (CFM), Fabrics and Others in Thousand Metric Tons
Chart 181: Glance at 2014, 2018 and 2024 South Korea Glass Fiber Reinforcements Market Share (%) by Product Form – Single-end Rovings, Multi-end Rovings, Woven Rovings, Chopped Strands, Chopped Strand Mat (CSM), Continuous Filament Mat (CFM), Fabrics and Others
Rest of Asia-Pacific
Chart 182: Rest of APAC Glass Fiber Reinforcements Market Analysis (2014-2024) in Volume (Thousand Metric Tons) and Value (US$ Million)
Chart 183: Rest of APAC Glass Fiber Reinforcements Market Analysis (2014-2024) by End-Use Application – Automotive & Transportation, Marine, Wind Energy, Pipes & Tanks, Building & Construction, Electricals & Electronics, Consumer Goods, Aerospace & Defense and Other in Thousand Metric Tons
Chart 184: Glance at 2014, 2018 and 2024 Rest of APAC Glass Fiber Reinforcements Market Share (%) by End-Use Application – Automotive & Transportation, Marine, Wind Energy, Pipes & Tanks, Building & Construction, Electricals & Electronics, Consumer Goods, Aerospace & Defense and Other
Chart 185: Rest of APAC Glass Fiber Reinforcements Market Analysis (2014-2024) by End-Use Application – Automotive & Transportation, Marine, Wind Energy, Pipes & Tanks, Building & Construction, Electricals & Electronics, Consumer Goods, Aerospace & Defense and Other in US$ Million
Chart 186: Glance at 2014, 2018 and 2024 Rest of APAC Glass Fiber Reinforcements Market Share (%)by End-Use Application – Automotive & Transportation, Marine, Wind Energy, Pipes & Tanks, Building & Construction, Electricals & Electronics, Consumer Goods, Aerospace & Defense and Other
Chart 187: Rest of APAC Glass Fiber Reinforcements Market Analysis (2014-2024) by Product Form – Single-end Rovings, Multi-end Rovings, Woven Rovings, Chopped Strands, Chopped Strand Mat (CSM), Continuous Filament Mat (CFM), Fabrics and Others in Thousand Metric Tons
Chart 188: Glance at 2014, 2018 and 2024 Rest of APAC Glass Fiber Reinforcements Market Share (%) by Product Form – Single-end Rovings, Multi-end Rovings, Woven Rovings, Chopped Strands, Chopped Strand Mat (CSM), Continuous Filament Mat (CFM), Fabrics and Others
REST OF WORLD
Chart 189: Rest of World Glass Fiber Reinforcements Market Analysis (2014-2024) in Volume (Thousand Metric Tons) and Value (US$ Million)
Chart 190: Rest of World Glass Fiber Reinforcements Market Analysis (2014-2024) by Geographic Region - Russia, Turkey, Brazil and Other Countries in Thousand Metric Tons
Chart 191: Glance at 2014, 2018 and 2024 Rest of World Glass Fiber Reinforcements Market Share (%) by Geographic Region - Russia, Turkey, Brazil and Other Countries
Chart 192: Rest of World Glass Fiber Reinforcements Market Analysis (2014-2024) by Geographic Region - Russia, Turkey, Brazil and Other Countries in US$ Million
Chart 193: Glance at 2014, 2018 and 2024 Rest of World Glass Fiber Reinforcements Market Share (%) by Geographic Region - Russia, Turkey, Brazil and Other Countries
Chart 194: Rest of World Glass Fiber Reinforcements Market Analysis (2014-2024) by End-Use Application – Automotive & Transportation, Marine, Wind Energy, Pipes & Tanks, Building & Construction, Electricals & Electronics, Consumer Goods, Aerospace & Defense and Other in Thousand Metric Tons
Chart 195: Glance at 2014, 2018 and 2024 Rest of World Glass Fiber Reinforcements Market Share (%) by End-Use Application – Automotive & Transportation, Marine, Wind Energy, Pipes & Tanks, Building & Construction, Electricals & Electronics, Consumer Goods, Aerospace & Defense and Other
Chart 196: Rest of World Glass Fiber Reinforcements Market Analysis (2014-2024) by End-Use Application – Automotive & Transportation, Marine, Wind Energy, Pipes & Tanks, Building & Construction, Electricals & Electronics, Consumer Goods, Aerospace & Defense and Other in US$ Million
Chart 197: Glance at 2014, 2018 and 2024 Rest of World Glass Fiber Reinforcements Market Share (%) by End-Use Application – Automotive & Transportation, Marine, Wind Energy, Pipes & Tanks, Building & Construction, Electricals & Electronics, Consumer Goods, Aerospace & Defense and Other
Chart 198: Rest of World Glass Fiber Reinforcements Market Analysis (2014-2024) by Product Form – Single-end Rovings, Multi-end Rovings, Woven Rovings, Chopped Strands, Chopped Strand Mat (CSM), Continuous Filament Mat (CFM), Fabrics and Others in Thousand Metric Tons
Chart 199: Glance at 2014, 2018 and 2024 Rest of World Glass Fiber Reinforcements Market Share (%) by Product Form – Single-end Rovings, Multi-end Rovings, Woven Rovings, Chopped Strands, Chopped Strand Mat (CSM), Continuous Filament Mat (CFM), Fabrics and Others
Russia
Chart 200: Russia Glass Fiber Reinforcements Market Analysis (2014-2024) in Volume (Thousand Metric Tons) and Value (US$ Million)
Chart 201: Russia Glass Fiber Reinforcements Market Analysis (2014-2024) by End-Use Application – Automotive & Transportation, Marine, Wind Energy, Pipes & Tanks, Building & Construction, Electricals & Electronics, Consumer Goods, Aerospace & Defense and Other in Thousand Metric Tons
Chart 202: Glance at 2014, 2018 and 2024 Russia Glass Fiber Reinforcements Market Share (%) by End-Use Application – Automotive & Transportation, Marine, Wind Energy, Pipes & Tanks, Building & Construction, Electricals & Electronics, Consumer Goods, Aerospace & Defense and Other
Chart 203: Russia Glass Fiber Reinforcements Market Analysis (2014-2024) by End-Use Application – Automotive & Transportation, Marine, Wind Energy, Pipes & Tanks, Building & Construction, Electricals & Electronics, Consumer Goods, Aerospace & Defense and Other in US$ Million
Chart 204: Glance at 2014, 2018 and 2024 Russia Glass Fiber Reinforcements Market Share (%) by End-Use Application – Automotive & Transportation, Marine, Wind Energy, Pipes & Tanks, Building & Construction, Electricals & Electronics, Consumer Goods, Aerospace & Defense and Other
Chart 205: Russia Glass Fiber Reinforcements Market Analysis (2014-2024) by Product Form – Single-end Rovings, Multi-end Rovings, Woven Rovings, Chopped Strands, Chopped Strand Mat (CSM), Continuous Filament Mat (CFM), Fabrics and Others in Thousand Metric Tons
Chart 206: Glance at 2014, 2018 and 2024 Russia Glass Fiber Reinforcements Market Share (%) by Product Form – Single-end Rovings, Multi-end Rovings, Woven Rovings, Chopped Strands, Chopped Strand Mat (CSM), Continuous Filament Mat (CFM), Fabrics and Others
Turkey
Chart 207: Turkey Glass Fiber Reinforcements Market Analysis (2014-2024) in Volume (Thousand Metric Tons) and Value (US$ Million)
Chart 208: Turkey Glass Fiber Reinforcements Market Analysis (2014-2024) by End-Use Application – Automotive & Transportation, Marine, Wind Energy, Pipes & Tanks, Building & Construction, Electricals & Electronics, Consumer Goods, Aerospace & Defense and Other in Thousand Metric Tons
Chart 209: Glance at 2014, 2018 and 2024 Turkey Glass Fiber Reinforcements Market Share (%) by End-Use Application – Automotive & Transportation, Marine, Wind Energy, Pipes & Tanks, Building & Construction, Electricals & Electronics, Consumer Goods, Aerospace & Defense and Other
Chart 210: Turkey Glass Fiber Reinforcements Market Analysis (2014-2024) by End-Use Application – Automotive & Transportation, Marine, Wind Energy, Pipes & Tanks, Building & Construction, Electricals & Electronics, Consumer Goods, Aerospace & Defense and Other in US$ Million
Chart 211: Glance at 2014, 2018 and 2024 Turkey Glass Fiber Reinforcements Market Share (%) by End-Use Application – Automotive & Transportation, Marine, Wind Energy, Pipes & Tanks, Building & Construction, Electricals & Electronics, Consumer Goods, Aerospace & Defense and Other
Chart 212: Turkey Glass Fiber Reinforcements Market Analysis (2014-2024) by Product Form – Single-end Rovings, Multi-end Rovings, Woven Rovings, Chopped Strands, Chopped Strand Mat (CSM), Continuous Filament Mat (CFM), Fabrics and Others in Thousand Metric Tons
Chart 213: Glance at 2014, 2018 and 2024 Turkey Glass Fiber Reinforcements Market Share (%) by Product Form – Single-end Rovings, Multi-end Rovings, Woven Rovings, Chopped Strands, Chopped Strand Mat (CSM), Continuous Filament Mat (CFM), Fabrics and Others
Brazil
Chart 214: Brazil Glass Fiber Reinforcements Market Analysis (2014-2024) in Volume (Thousand Metric Tons) and Value (US$ Million)
Chart 215: Brazil Glass Fiber Reinforcements Market Analysis (2014-2024) by End-Use Application – Automotive & Transportation, Marine, Wind Energy, Pipes & Tanks, Building & Construction, Electricals & Electronics, Consumer Goods, Aerospace & Defense and Other in Thousand Metric Tons
Chart 216: Glance at 2014, 2018 and 2024 Brazil Glass Fiber Reinforcements Market Share (%) by End-Use Application – Automotive & Transportation, Marine, Wind Energy, Pipes & Tanks, Building & Construction, Electricals & Electronics, Consumer Goods, Aerospace & Defense and Other
Chart 217: Brazil Glass Fiber Reinforcements Market Analysis (2014-2024) by End-Use Application – Automotive & Transportation, Marine, Wind Energy, Pipes & Tanks, Building & Construction, Electricals & Electronics, Consumer Goods, Aerospace & Defense and Other in US$ Million
Chart 218: Glance at 2014, 2018 and 2024 Brazil Glass Fiber Reinforcements Market Share (%) by End-Use Application – Automotive & Transportation, Marine, Wind Energy, Pipes & Tanks, Building & Construction, Electricals & Electronics, Consumer Goods, Aerospace & Defense and Other
Chart 219: Brazil Glass Fiber Reinforcements Market Analysis (2014-2024) by Product Form – Single-end Rovings, Multi-end Rovings, Woven Rovings, Chopped Strands, Chopped Strand Mat (CSM), Continuous Filament Mat (CFM), Fabrics and Others in Thousand Metric Tons
Chart 220: Glance at 2014, 2018 and 2024 Brazil Glass Fiber Reinforcements Market Share (%) by Product Form – Single-end Rovings, Multi-end Rovings, Woven Rovings, Chopped Strands, Chopped Strand Mat (CSM), Continuous Filament Mat (CFM), Fabrics and Others
Other Rest of World
Chart 221: Other ROW Glass Fiber Reinforcements Market Analysis (2014-2024) in Volume (Thousand Metric Tons) and Value (US$ Million)
Chart 222: Other ROW Glass Fiber Reinforcements Market Analysis (2014-2024) by End-Use Application – Automotive & Transportation, Marine, Wind Energy, Pipes & Tanks, Building & Construction, Electricals & Electronics, Consumer Goods, Aerospace & Defense and Other in Thousand Metric Tons
Chart 223: Glance at 2014, 2018 and 2024 Other ROW Glass Fiber Reinforcements Market Share (%) by End-Use Application – Automotive & Transportation, Marine, Wind Energy, Pipes & Tanks, Building & Construction, Electricals & Electronics, Consumer Goods, Aerospace & Defense and Other
Chart 224: Other ROW Glass Fiber Reinforcements Market Analysis (2014-2024) by Product Form – Single-end Rovings, Multi-end Rovings, Woven Rovings, Chopped Strands, Chopped Strand Mat (CSM), Continuous Filament Mat (CFM), Fabrics and Others in Thousand Metric Tons
Chart 225: Glance at 2014, 2018 and 2024 Other ROW Glass Fiber Reinforcements Market Share (%) by Product Form – Single-end Rovings, Multi-end Rovings, Woven Rovings, Chopped Strands, Chopped Strand Mat (CSM), Continuous Filament Mat (CFM), Fabrics and Others
Tables:
Table 1: Glass Fiber Production Capacity Expansions Worldwide (2017-2020)
Table 2: Global Glass Fiber Production Capacities (2017-2020) by Company, Country and Plant in Thousand Metric Tons
Braj Binani Group (3B-Fibreglass)
China Jushi Group Co., Ltd.
Chongqing Polycomp International Corporation (CPIC)
Chongqing Sanlei Glass Fiber Co., Ltd.
Jiangsu Changhai Composite Materials Co., Ltd.
Johns Manville Corporation
Nippon Electric Glass Co., Ltd.
Owens Corning
Shandong Fiberglass Group Co., Ltd.
Taishan Fiberglass Inc.
SINGLE USER/ENTERPRISE LICENSE
Electronic (PDF)
Latest Version Available!
Latest version of this report is available. Click below to view report.
Latest Publication
avialable for this report
OTHER ARCHIVED REPORTS

Natural Source Vitamin E (Tocopherols and Tocotrienols) – A Global Market Overview
Report Code: PH002ARCH | Pages: 278 | Price: $2700
Published
Oct 2021

Vacuum Insulation Panels (VIPs) – A Global Market Overview-2021
Report Code: MG023ARCH | Pages: 272 | Price: $1800
Published
Jan 2021

Powder Metallurgy – A Global Market Overview
Report Code: CP057ARCH | Pages: 567 | Price: $2187
Published
Oct 2020

Hydraulic Components – A Global Market Overview
Report Code: MG014ARCH | Pages: 464 | Price: $2475
Published
Aug 2020

Global Zeolites Market – Products and Applications | Covid-19 Impact
Report Code: CP091ARCH | Pages: 450 | Price: $2475
Published
Jul 2020