Report Synopsis
Increasing pressure on the livestock sector to meet the growing demand for animal protein worldwide is driving growth of amino acids in compound animal feed production. The recent past has been witnessing a growing demand for animal protein globally for livestock, dairy and fish. This trend has been more apparent in the developing economies such as Asia-Pacific, as against the developed regions that have continued to be relatively stable.
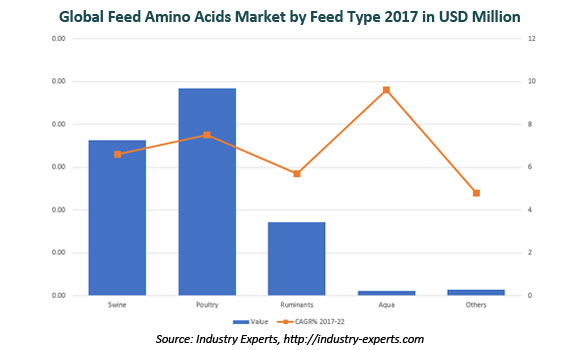
Global volume consumption of Feed Grade Amino Acids is estimated at 4.5 million metric tons in 2017 and is projected to reach 6.2 million metric tons by 2022 at a CAGR of 6.8% between the two years. Poultry feed constitutes the largest consumer of feed amino acids globally with 2017 market share of 43.4%, volume consumption of which is slated to compound annually at 7.6% over 2017-2022 in reaching a projected 2.8 million metric tons by 2022 from an estimated 1.9 million metric tons in 2017.
Research Findings & Coverage
- The feed amino acids global market analyzed in this report for its product types as well as the animal feed type
- The report briefly explains about the feed amino acid types along with the feed types including definitions and processes
- Animal protein demand increase to boost the market for amino acids in feed production
- Burgeoning Opportunities for Amino Acids in High Growth Aquaculture Industry
- Next Limiting Amino Acid L-Valine Fueling Growth for Amino Acids in the Animal Feed Sector
- Key business trends focusing on product innovations/developments, M&As, JVs and other recent industry developments
- Major companies profiled – 61
- The industry guide includes the contact details for 227 companies
Product Outline
The report analyzes the market for the key product types Feed Grade Amino Acids:
- L-Lysine
- Methionine
- L-Threonine
- L-Tryptophan
- L-Valine
- Glycine
Animal Feed types of feed grade amino acids analyzed comprise the following:
- Swine Feed
- Poultry Feed
- Ruminants Feed
- Aqua Feed
- Other Animal Feed
Analysis Period, Units and Growth Rates
- The report reviews, analyzes and projects the worldwide Feed Amino Acids market for the period 2012-2022 in terms of consumption in metric tons and market value in US$ and the compound annual growth rates (CAGRs) projected from 2017 through 2022
Geographic Coverage
- North America (The United States, Canada and Mexico)
- Europe (Germany, France, The United Kingdom, Italy and Rest of Europe)
- Asia-Pacific (China, India, Indonesia, Japan, South Korea and Rest of Asia-Pacific)
- South America (Brazil, Argentina and Rest of South America)
- Rest of World
PART A: GLOBAL MARKET PERSPECTIVE
1. INTRODUCTION
1.1 Product Outline
1.1.1 What are Amino Acids?
1.1.2 Types of Amino Acids
1.1.2.1 Essential and Non-Essential Amino Acids
1.1.2.1.1 Essential Amino Acids
1.1.2.1.2 Non-Essential Amino Acids
1.1.2.2 Amino Acids Classification Based on Charge and Polarity of Side Chains
1.1.2.3 Glycogenic and Ketogenic Amino Acids
1.1.2.4 Amino Acids Classification Based on Structure
1.1.2.5 Amino Acids Classification Based on Functionality
1.1.2.5.1 Neurotransmitter Amino Acids
1.1.2.5.2 Branched Chain Amino Acids (BCAA)
1.1.2.5.3 Sulfur-Containing Amino Acids
1.1.2.5.4 Glycogenic Amino Acids
1.1.2.5.5 Urea Cycle Amino Acids
1.1.2.5.6 Connective Tissue Amino Acids
1.1.3 Production Processes of Amino Acids
1.1.3.1 Protein Hydrolysis
1.1.3.2 Chemical Synthesis
1.1.3.3 Microbiological Methods
1.1.4 Feed Amino Acids
1.1.4.1 L-Lysine
1.1.4.2 Methionine
1.1.4.3 L-Threonine
1.1.4.4 L-Tryptophan
1.1.4.5 L-Valine
1.1.4.6 Glycine
1.1.4.7 Advantages using Amino Acids in Animal Feed
1.1.4.7.1 Contribution in Protein Supply
1.1.4.7.2 Contribution to Protecting the Environment
1.1.4.8 Animal Species and Amino Acids Recommendations
1.1.4.8.1 Poultry
1.1.4.8.2 Swine
1.1.4.8.3 Ruminants
1.1.4.8.4 Aquaculture
2. KEY MARKET TRENDS
2.1 Rising Demand for Animal Protein to Aid the Growth of Amino Acids Usage in Compound Feed Production
2.2 Burgeoning Opportunities for Amino Acids in High Growth Aquaculture Industry
2.3 Next Limiting Amino Acid L-Valine Fueling Growth for Amino Acids in the Animal Feed Sector
3. KEY GLOBAL PLAYERS
Adisseo France S.A.S (France)
Ajinomoto Co., Inc. (Japan)
Archer Daniels Midland Company (United States)
Chongqing Unisplendour Chemical Co., Ltd. (China)
CJ CheilJedang Corporation (South Korea)
Daesang Corporation (South Korea)
Evonik Industries AG (Germany)
Global Bio-Chem Technology Group Company Limited (Hong Kong)
Hebei Donghua Chemical Group (China)
Linghua Group Limited (China)
Meihua Holdings Group Co., Ltd. (China)
Newtrend Group (China)
Novus International, Inc. (United States)
Shijiazhuang Donghua Jinlong Chemical Co., Ltd. (China)
Sumitomo Chemical Company, Limited (Japan)
4. KEY BUSINESS & PRODUCT TRENDS
Ajinomoto and Meihua Holdings Group Enter into an Agreement
Fermented L-Cysteine Introduced by CJ CheilJedang
Evonik Acquires Fermentation Technology from METEX for Producing Methionine
Sumitomo Chemical and ITOCHU in a Distribution Agreement
LARC, First Research and Development Base of Sumitomo Chemical in Latin America
Evonik Presents ValAMINO® and CreAMINO® at EuroTier 2016
Evonik to Double Methionine Production Capacity in Singapore
Patent Infringement Lawsuit Regarding Feed-Use Lysine Delivered in Favor of Ajinomoto Eurolysine SAS
Evonik Starts Production of AQUAVI® Met-Met in Antwerp
Evonik and Univar in an Alliance
Adisseo Acquires IPBB sulfur terminal from SOBEGI
Evonik Industries´ Brazilian L-Lysine Operations Commissioned
Evonik´s Amino Acid Offerings for Animal Nutrition Boosted with the Addition of ValAMINO® L-Valine
Ajinomoto Co Files Patent Infringement Suits in the United States and Europe
Sumitomo Chemical´s Methionine Capacity to be Expanded
Adisseo Completes Second Phase of Nanjing Liquid Methionine Unit
CJ CheilJedang Acquires Ningbo Zhenhai Haide Biochem Co
Ajinomoto Group Initiates Feed Grade Tryptophan Manufacture in North America
Novus International Takes Over Major Intermediate Operations from Union Carbide Corp
Evonik Plans World-Scale Methionine Plant in Singapore
Zavod Premiksov No. 1 Starts Lysine Plant in Russia´s Belgorod Region
Daesang Corp Takes Over L-lysine Operations of Paik Kwang Industrial
CJ CheilJedang´s Malaysian L-Methionine Facility Commences Full-Scale Operations
Meihua Group Completes the Acquisition of NingXia Eppen Biotech Co. Ltd.
Ajinomoto Group´s French Production Capacity of Feed Grade Tryptophan Augmented
Evonik´s Singapore Methionine Facility Goes on Stream
Evonik Starts Construction of Methionine Facility in Mobile, Alabama
5. GLOBAL MARKET OVERVIEW
5.1 Global Feed Amino Acids Market Overview by Product Type
5.1.1 Global Feed Amino Acids Product Type Market Overview by Geographic Region
5.1.1.1 L-Lysine
5.1.1.2 Methionine
5.1.1.3 L-Threonine
5.1.1.4 L-Tryptophan
5.1.1.5 L-Valine
5.1.1.6 Glycine
5.2 Global Feed Amino Acids Market Overview by Feed Type
5.2.1 Global Feed Amino Acids Feed Type Market Overview by Geographic Region
5.2.1.1 Swine Feed
5.2.1.2 Poultry Feed
5.2.1.3 Ruminants Feed
5.2.1.4 Aqua Feed
5.2.1.5 Other Animal Feeds
PART B: REGIONAL MARKET PERSPECTIVE
Global Feed Amino Acids Market Overview by Geographic Region
REGIONAL MARKET OVERVIEW
1. NORTH AMERICA
1.1 North American Feed Amino Acids Market Overview by Geographic Region
1.2 North American Feed Amino Acids Market Overview by Product Type
1.3 North American Feed Amino Acids Market Overview by Feed Type
1.4 Major Market Players
Ajinomoto Heartland, Inc. (United States)
Ajinomoto North America, Inc. (United States)
Archer Daniels Midland Company (United States)
Chattem Chemicals, Inc. (United States)
CJ Bio America (United States)
Evonik Corporation (United States)
GEO Specialty Chemicals, Inc. (United States)
Kemin Industries, Inc. (United States)
Novus International, Inc. (United States)
Prinova Group LLC (United States)
1.5 Country-wise Analysis of North American Feed Amino Acids Market
1.5.1 The United States
1.5.1.1 United States Feed Amino Acids Market Overview by Product Type
1.5.1.2 United States Feed Amino Acids Market Overview by Feed Type
1.5.2 Canada
1.5.2.1 Canada Feed Amino Acids Market Overview by Product Type
1.5.2.2 Canada Feed Amino Acids Market Overview by Feed Type
1.5.3 Mexico
1.5.3.1 Mexico Feed Amino Acids Market Overview by Product Type
1.5.3.2 Mexico Feed Amino Acids Market Overview by Feed Type
2. EUROPE
2.1 European Feed Amino Acids Market Overview by Geographic Region
2.2 European Feed Amino Acids Market Overview by Product Type
2.3 European Feed Amino Acids Market Overview by Feed Type
2.4 Major Market Players
Adisseo France S.A.S (France)
Ajinomoto Eurolysine S.A.S. (France)
Amino GmbH (Germany)
Donbioteh LLC (Russia)
Evonik Industries AG (Germany)
Evonik Degussa Antwerpen NV (Belgium)
Evonik Fermas s.r.o. (Slovakia)
Evonik Agroferm Zrt. (Hungary)
Prioskolye CJSC (Russia)
Volzhsky Orgsynthese, JSC (Russia)
2.5 Country-wise Analysis of European Feed Amino Acids Market
2.5.1 France
2.5.1.1 France Feed Amino Acids Market Overview by Product Type
2.5.1.2 France Feed Amino Acids Market Overview by Feed Type
2.5.2 Germany
2.5.2.1 Germany Feed Amino Acids Market Overview by Product Type
2.5.2.2 Germany Feed Amino Acids Market Overview by Feed Type
2.5.3 Italy
2.5.3.1 Italy Feed Amino Acids Market Overview by Product Type
2.5.3.2 Italy Feed Amino Acids Market Overview by Feed Type
2.5.4 The Netherlands
2.5.4.1 Netherlands Feed Amino Acids Market Overview by Product Type
2.5.4.2 Netherlands Feed Amino Acids Market Overview by Feed Type
2.5.5 Poland
2.5.5.1 Poland Feed Amino Acids Market Overview by Product Type
2.5.5.2 Poland Feed Amino Acids Market Overview by Feed Type
2.5.6 Russia
2.5.6.1 Russia Feed Amino Acids Market Overview by Product Type
2.5.6.2 Russia Feed Amino Acids Market Overview by Feed Type
2.5.7 Spain
2.5.7.1 Spain Feed Amino Acids Market Overview by Product Type
2.5.7.2 Spain Feed Amino Acids Market Overview by Feed Type
2.5.8 The United Kingdom
2.5.8.1 United Kingdom Feed Amino Acids Market Overview by Product Type
2.5.8.2 United Kingdom Feed Amino Acids Market Overview by Feed Type
2.5.9 Rest of Europe
2.5.9.1 Rest of Europe Feed Amino Acids Market Overview by Product Type
2.5.9.2 Rest of Europe Feed Amino Acids Market Overview by Feed Type
3. ASIA-PACIFIC
3.1 Asia-Pacific Feed Amino Acids Market Overview by Geographic Region
3.2 Asia-Pacific Feed Amino Acids Market Overview by Product Type
3.3 Asia-Pacific Feed Amino Acids Market Overview by Feed Type
3.4 Major Market Players
Ajinomoto Co., Inc. (Japan)
Ajinomoto Co., (Thailand), Ltd. (Thailand)
Ajinomoto (China) Co., Ltd. (China)
Nippon Protein Co., Ltd. (Japan)
Anhui Huaheng Biotechnology Co., Ltd. (China)
Baoding Mantong Fine Chemistry Co., Ltd. (China)
China BBCA Group Corporation (China)
Chongqing Unisplendour Chemical Co., Ltd. (China)
CJ CheilJedang Corporation (South Korea)
CJ Liao Cheng Biotech Co., Ltd. (China)
CJ Shenyang Biotech Co., Ltd. (China)
CJ CheilJedang (Malaysia)
PT.Cheil Jedang Indonesia (Indonesia)
CJ Haide (Ningbo) Biotech Co., Ltd. (China)
Daesang Corporation (South Korea)
Evonik (SEA) Pte. Ltd. (Singapore)
Global Bio-Chem Technology Group Company Limited (Hong Kong)
Hebei Donghua Chemical Group (China)
Hebei Huayang Amino Acids Group Company Limited (China)
Henan HDF Chemical Company, Ltd. (China)
Hubei Xingfa Chemicals Group Co., Ltd. (China)
Yichang Jinxin Chemical Co., Ltd. (China)
Linghua Group Co., Ltd. (China)
Meihua Holdings Group Co., Ltd. (China)
NB Group Ltd (China)
Newtrend Group (China)
Shaanxi Sciphar Hi-Tech Industry Co., Ltd. (China)
Shandong Shouguang Juneng Group Golden Corn Co., Ltd (China)
Shandong Zhenxing Chemical Industry Co. Ltd (China)
Shijiazhuang Donghua Jinlong Chemical Co., Ltd. (China)
Shijiazhuang Shixing Amino Acid Co., Ltd. (China)
Shijiazhuang Zexing Amino Acid Co., Ltd. (China)
Star Lake Bioscience Co., Inc. Zhaoqing Guangdong (China)
Sumitomo Chemical Company, Limited (Japan)
Sunrise Nutrachem Group (China)
Vedan International (Holdings) Limited (Vietnam)
Yichang Sanxia Pharmaceutical Co., Ltd. (China)
Zhejiang Guoguang Biochemistry Co., Ltd. (China)
Zhejiang Shenghua Biok Biology Co., Ltd. (China)
3.5 Country-wise Analysis of Asia-Pacific Feed Amino Acids Market
3.5.1 China
3.5.1.1 China Feed Amino Acids Market Overview by Product Type
3.5.1.2 China Feed Amino Acids Market Overview by Feed Type
3.5.2 India
3.5.2.1 India Feed Amino Acids Market Overview by Product Type
3.5.2.2 India Feed Amino Acids Market Overview by Feed Type
3.5.3 Indonesia
3.5.3.1 Indonesia Feed Amino Acids Market Overview by Product Type
3.5.3.2 Indonesia Feed Amino Acids Market Overview by Feed Type
3.5.4 Japan
3.5.4.1 Japan Feed Amino Acids Market Overview by Product Type
3.5.4.2 Japan Feed Amino Acids Market Overview by Feed Type
3.5.5 South Korea
3.5.5.1 South Korea Feed Amino Acids Market Overview by Product Type
3.5.5.2 South Korea Feed Amino Acids Market Overview by Feed Type
3.5.6 Rest of Asia-Pacific
3.5.6.1 Rest of Asia-Pacific Feed Amino Acids Market Overview by Product Type
3.5.6.2 Rest of Asia-Pacific Feed Amino Acids Market Overview by Feed Type
4. SOUTH AMERICA
4.1 South America Feed Amino Acids Market Overview by Geographic Region
4.2 South America Feed Amino Acids Market Overview by Product Type
4.3 South America Feed Amino Acids Market Overview by Feed Type
4.4 Major Market Players
Ajinomoto do Brazil Industria e Comercio de Alimentos Ltda (Brazil)
CJ do Brasil Ltda (Brazil)
4.5 Country-wise Analysis of South American Feed Amino Acids Market
4.5.1 Brazil
4.5.1.1 Brazil Feed Amino Acids Market Overview by Product Type
4.5.1.2 Brazil Feed Amino Acids Market Overview by Feed Type
4.5.2 Argentina
4.5.2.1 Argentina Feed Amino Acids Market Overview by Product Type
4.5.2.2 Argentina Feed Amino Acids Market Overview by Feed Type
4.5.3 Rest of South America
4.5.3.1 Rest of South America Feed Amino Acids Market Overview by Product Type
4.5.3.2 Rest of South America Feed Amino Acids Market Overview by Feed Type
5. REST OF WORLD
5.1 Rest of World Feed Amino Acids Market Overview by Geographic Region
5.2 Rest of World Feed Amino Acids Market Overview by Product Type
5.3 Rest of World Feed Amino Acids Market Overview by Feed Type
PART C: GUIDE TO THE INDUSTRY
1. NORTH AMERICA
2. EUROPE
3. ASIA-PACIFIC
4. SOUTH AMERICA
5. REST OF WORLD
PART D: ANNEXURE
1. RESEARCH METHODOLOGY
2. FEEDBACK
Charts & Graphs
PART A: GLOBAL MARKET PERSPECTIVE
Chart 1: Global Feed Amino Acids Market 2012, 2017 and 2022
Chart 2: Global Feed Amino Acids Market 2017 and 2022 by Product Type
Chart 3: Global Feed Amino Acids Market 2017 and 2022 by Feed Type
Chart 4: Global Feed Amino Acids Market 2017 and 2022 by Geographic Region
Chart 5: Global Animal Protein Production Trends (2010-2016) and Forecast (2016-2022) in Million Metric Tons
Chart 6: Global Compound Feed Production (2012-2016) in Million Metric Tons
Chart 7: 2016 Global Compound Feed Production by Geographic Region and Species in Million Metric Tons
Chart 8: 2016 Global Other Compound Feed Production by Geographic Region and Species in Million Metric Tons
Chart 9: Global Aquaculture Production (2010-2015) by Geographic Region – Live Weight in Million Metric Tons
Chart 10: Global Feed Amino Acids Market Analysis (2012-2022) by Volume in Metric Tons and Value in USD Million
Chart 11: Global Feed Amino Acids Market Analysis (2012-2022) by Product Type – L-Lysine, Methionine, L-Threonine, L-Tryptophan, L-Valine and Glycine in Metric Tons
Chart 12: Glance at 2012, 2017 and 2022 Global Feed Amino Acids Volume Market Share (%) by Product Type – L-Lysine, Methionine, L-Threonine, L-Tryptophan, L-Valine and Glycine
Chart 13: Global Feed Amino Acids Market Analysis (2012-2022) by Product Type – L-Lysine, Methionine, L-Threonine, L-Tryptophan, L-Valine and Glycine in USD Million
Chart 14: Glance at 2012, 2017 and 2022 Global Feed Amino Acids Value Market Share (%) by Product Type – L-Lysine, Methionine, L-Threonine, L-Tryptophan, L-Valine and Glycine
Chart 15: Global L-Lysine Market Analysis (2012-2022) by Geographic Region – North America, Europe, Asia-Pacific, South America and Rest of World in Metric Tons
Chart 16: Glance at 2012, 2017 and 2022 Global L-Lysine Volume Market Share (%) by Geographic Region – North America, Europe, Asia-Pacific, South America and Rest of World
Chart 17: Global L-Lysine Market Analysis (2012-2022) by Geographic Region – North America, Europe, Asia-Pacific, South America and Rest of World in USD Million
Chart 18: Glance at 2012, 2017 and 2022 Global L-Lysine Value Market Share (%) by Geographic Region – North America, Europe, Asia-Pacific, South America and Rest of World
Chart 19: Global Methionine Market Analysis (2012-2022) by Geographic Region – North America, Europe, Asia-Pacific, South America and Rest of World in Metric Tons
Chart 20: Glance at 2012, 2017 and 2022 Global Methionine Volume Market Share (%) by Geographic Region – North America, Europe, Asia-Pacific, South America and Rest of World
Chart 21: Global Methionine Market Analysis (2012-2022) by Geographic Region – North America, Europe, Asia-Pacific, South America and Rest of World in USD Million
Chart 22: Glance at 2012, 2017 and 2022 Global Methionine Value Market Share (%) by Geographic Region – North America, Europe, Asia-Pacific, South America and Rest of World
Chart 23: Global L-Threonine Market Analysis (2012-2022) by Geographic Region – North America, Europe, Asia-Pacific, South America and Rest of World in Metric Tons
Chart 24: Glance at 2012, 2017 and 2022 Global L-Threonine Volume Market Share (%) by Geographic Region – North America, Europe, Asia-Pacific, South America and Rest of World
Chart 25: Global L-Threonine Market Analysis (2012-2022) by Geographic Region – North America, Europe, Asia-Pacific, South America and Rest of World in USD Million
Chart 26: Glance at 2012, 2017 and 2022 Global L-Threonine Value Market Share (%) by Geographic Region – North America, Europe, Asia-Pacific, South America and Rest of World
Chart 27: Global L-Tryptophan Market Analysis (2012-2022) by Geographic Region – North America, Europe, Asia-Pacific, South America and Rest of World in Metric Tons
Chart 28: Glance at 2012, 2017 and 2022 Global L-Tryptophan Volume Market Share (%) by Geographic Region – North America, Europe, Asia-Pacific, South America and Rest of World
Chart 29: Global L-Tryptophan Market Analysis (2012-2022) by Geographic Region – North America, Europe, Asia-Pacific, South America and Rest of World in USD Million
Chart 30: Glance at 2012, 2017 and 2022 Global L-Tryptophan Value Market Share (%) by Geographic Region – North America, Europe, Asia-Pacific, South America and Rest of World
Chart 31: Global L-Valine Market Analysis (2012-2022) by Geographic Region – North America, Europe, Asia-Pacific, South America and Rest of World in Metric Tons
Chart 32: Glance at 2012, 2017 and 2022 Global L-Valine Volume Market Share (%) by Geographic Region – North America, Europe, Asia-Pacific, South America and Rest of World
Chart 33: Global L-Valine Market Analysis (2012-2022) by Geographic Region – North America, Europe, Asia-Pacific, South America and Rest of World in USD Million
Chart 34: Glance at 2012, 2017 and 2022 Global L-Valine Value Market Share (%) by Geographic Region – North America, Europe, Asia-Pacific, South America and Rest of World
Chart 35: Global Glycine Market Analysis (2012-2022) by Geographic Region – North America, Europe, Asia-Pacific, South America and Rest of World in Metric Tons
Chart 36: Glance at 2012, 2017 and 2022 Global Glycine Volume Market Share (%) by Geographic Region – North America, Europe, Asia-Pacific, South America and Rest of World
Chart 37: Global Glycine Market Analysis (2012-2022) by Geographic Region – North America, Europe, Asia-Pacific, South America and Rest of World in USD Million
Chart 38: Glance at 2012, 2017 and 2022 Global Glycine Value Market Share (%) by Geographic Region – North America, Europe, Asia-Pacific, South America and Rest of World
Chart 39: Global Feed Amino Acids Market Analysis (2012-2022) by Feed Type – Swine, Poultry, Ruminants, Aqua and Others in Metric Tons
Chart 40: Glance at 2012, 2017 and 2022 Global Feed Amino Acids Volume Market Share (%) by Feed Type – Swine, Poultry, Ruminants, Aqua and Others
Chart 41: Global Feed Amino Acids Market Analysis (2012-2022) by Feed Type – Swine, Poultry, Ruminants, Aqua and Others in USD Million
Chart 42: Glance at 2012, 2017 and 2022 Global Feed Amino Acids Value Market Share (%) by Feed Type – Swine, Poultry, Ruminants, Aqua and Others
Chart 43: Global Feed Amino Acids Market Analysis (2012-2022) in Swine Feed by Geographic Region – North America, Europe, Asia-Pacific, South America and Rest of World in Metric Tons
Chart 44: Glance at 2012, 2017 and 2022 Global Feed Amino Acids Volume Market Share (%) in Swine Feed by Geographic Region – North America, Europe, Asia-Pacific, South America and Rest of World
Chart 45: Global Feed Amino Acids Market Analysis (2012-2022) in Swine Feed by Geographic Region – North America, Europe, Asia-Pacific, South America and Rest of World in USD Million
Chart 46: Glance at 2012, 2017 and 2022 Global Feed Amino Acids Value Market Share (%) in Swine Feed by Geographic Region – North America, Europe, Asia-Pacific, South America and Rest of World
Chart 47: Global Feed Amino Acids Market Analysis (2012-2022) in Poultry Feed by Geographic Region – North America, Europe, Asia-Pacific, South America and Rest of World in Metric Tons
Chart 48: Glance at 2012, 2017 and 2022 Global Feed Amino Acids Volume Market Share (%) in Poultry Feed by Geographic Region – North America, Europe, Asia-Pacific, South America and Rest of World
Chart 49: Global Feed Amino Acids Market Analysis (2012-2022) in Poultry Feed by Geographic Region – North America, Europe, Asia-Pacific, South America and Rest of World in USD Million
Chart 50: Glance at 2012, 2017 and 2022 Global Feed Amino Acids Value Market Share (%) in Poultry Feed by Geographic Region – North America, Europe, Asia-Pacific, South America and Rest of World
Chart 51: Global Feed Amino Acids Market Analysis (2012-2022) in Ruminants Feed by Geographic Region – North America, Europe, Asia-Pacific, South America and Rest of World in Metric Tons
Chart 52: Glance at 2012, 2017 and 2022 Global Feed Amino Acids Volume Market Share (%) in Ruminants Feed by Geographic Region – North America, Europe, Asia-Pacific, South America and Rest of World
Chart 53: Global Feed Amino Acids Market Analysis (2012-2022) in Ruminants Feed by Geographic Region – North America, Europe, Asia-Pacific, South America and Rest of World in USD Million
Chart 54: Glance at 2012, 2017 and 2022 Global Feed Amino Acids Value Market Share (%) in Ruminants Feed by Geographic Region – North America, Europe, Asia-Pacific, South America and Rest of World
Chart 55: Global Feed Amino Acids Market Analysis (2012-2022) in Aqua Feed by Geographic Region – North America, Europe, Asia-Pacific, South America and Rest of World in Metric Tons
Chart 56: Glance at 2012, 2017 and 2022 Global Feed Amino Acids Volume Market Share (%) in Aqua Feed by Geographic Region – North America, Europe, Asia-Pacific, South America and Rest of World
Chart 57: Global Feed Amino Acids Market Analysis (2012-2022) in Aqua Feed by Geographic Region – North America, Europe, Asia-Pacific, South America and Rest of World in USD Million
Chart 58: Glance at 2012, 2017 and 2022 Global Feed Amino Acids Value Market Share (%) in Aqua Feed by Geographic Region – North America, Europe, Asia-Pacific, South America and Rest of World
Chart 59: Global Feed Amino Acids Market Analysis (2012-2022) in Other Animal Feed by Geographic Region – North America, Europe, Asia-Pacific, South America and Rest of World in Metric Tons
Chart 60: Glance at 2012, 2017 and 2022 Global Feed Amino Acids Volume Market Share (%) in Other Animal Feed by Geographic Region – North America, Europe, Asia-Pacific, South America and Rest of World
Chart 61: Global Feed Amino Acids Market Analysis (2012-2022) in Other Animal Feed by Geographic Region – North America, Europe, Asia-Pacific, South America and Rest of World in USD Million
Chart 62: Glance at 2012, 2017 and 2022 Global Feed Amino Acids Value Market Share (%) in Other Animal Feed by Geographic Region – North America, Europe, Asia-Pacific, South America and Rest of World
PART B: REGIONAL MARKET PERSPECTIVE
Chart 63: Global Feed Amino Acids Market Analysis (2012-2022) by Geographic Region – North America, Europe, Asia-Pacific, South America and Rest of World in Metric Tons
Chart 64: Glance at 2012, 2017 and 2022 Global Feed Amino Acids Volume Market Share (%) by Geographic Region – North America, Europe, Asia-Pacific, South America and Rest of World
Chart 65: Global Feed Amino Acids Market Analysis (2012-2022) by Geographic Region – North America, Europe, Asia-Pacific, South America and Rest of World in USD Million
Chart 66: Glance at 2012, 2017 and 2022 Global Feed Amino Acids Value Market Share (%) by Geographic Region – North America, Europe, Asia-Pacific, South America and Rest of World
REGIONAL MARKET OVERVIEW
NORTH AMERICA
Chart 67: North American Feed Amino Acids Market Analysis (2012-2022) by Volume in Metric Tons and Value in USD Million
Chart 68: North American Feed Amino Acids Market Analysis (2012-2022) by Geographic Region – United States, Canada and Mexico in Metric Tons
Chart 69: Glance at 2012, 2017 and 2022 North American Feed Amino Acids Volume Market Share (%) by Geographic Region – United States, Canada and Mexico
Chart 70: North American Feed Amino Acids Market Analysis (2012-2022) by Geographic Region – United States, Canada and Mexico in USD Million
Chart 71: Glance at 2012, 2017 and 2022 North American Feed Amino Acids Value Market Share (%) by Geographic Region – United States, Canada and Mexico
Chart 72: North American Feed Amino Acids Market Analysis (2012-2022) by Product Type – L-Lysine, Methionine, L-Threonine, L-Tryptophan, L-Valine and Glycine in Metric Tons
Chart 73: Glance at 2012, 2017 and 2022 North American Feed Amino Acids Volume Market Share (%) by Product Type – L-Lysine, Methionine, L-Threonine, L-Tryptophan, L-Valine and Glycine
Chart 74: North American Feed Amino Acids Market Analysis (2012-2022) by Product Type – L-Lysine, Methionine, L-Threonine, L-Tryptophan, L-Valine and Glycine in USD Million
Chart 75: Glance at 2012, 2017 and 2022 North American Feed Amino Acids Value Market Share (%) by Product Type – L-Lysine, Methionine, L-Threonine, L-Tryptophan, L-Valine and Glycine
Chart 76: North American Feed Amino Acids Market Analysis (2012-2022) by Feed Type – Swine, Poultry, Ruminants, Aqua and Others in Metric Tons
Chart 77: Glance at 2012, 2017 and 2022 North American Feed Amino Acids Volume Market Share (%) by Feed Type – Swine, Poultry, Ruminants, Aqua and Others
Chart 78: North American Feed Amino Acids Market Analysis (2012-2022) by Feed Type – Swine, Poultry, Ruminants, Aqua and Others in USD Million
Chart 79: Glance at 2012, 2017 and 2022 North American Feed Amino Acids Value Market Share (%) by Feed Type – Swine, Poultry, Ruminants, Aqua and Others
The United States
Chart 80: United States Feed Amino Acids Market Analysis (2012-2022) by Volume in Metric Tons and Value in USD Million
Chart 81: United States Feed Amino Acids Market Analysis (2012-2022) by Product Type – L-Lysine, Methionine, L-Threonine, L-Tryptophan, L-Valine and Glycine in Metric Tons
Chart 82: Glance at 2012, 2017 and 2022 United States Feed Amino Acids Volume Market Share (%) by Product Type – L-Lysine, Methionine, L-Threonine, L-Tryptophan, L-Valine and Glycine
Chart 83: United States Feed Amino Acids Market Analysis (2012-2022) by Product Type – L-Lysine, Methionine, L-Threonine, L-Tryptophan, L-Valine and Glycine in USD Million
Chart 84: Glance at 2012, 2017 and 2022 United States Feed Amino Acids Value Market Share (%) by Product Type – L-Lysine, Methionine, L-Threonine, L-Tryptophan, L-Valine and Glycine
Chart 85: United States Feed Amino Acids Market Analysis (2012-2022) by Feed Type – Swine, Poultry, Ruminants, Aqua and Others in Metric Tons
Chart 86: Glance at 2012, 2017 and 2022 United States Feed Amino Acids Volume Market Share (%) by Feed Type – Swine, Poultry, Ruminants, Aqua and Others
Chart 87: United States Feed Amino Acids Market Analysis (2012-2022) by Feed Type – Swine, Poultry, Ruminants, Aqua and Others in USD Million
Chart 88: Glance at 2012, 2017 and 2022 United States Feed Amino Acids Value Market Share (%) by Feed Type – Swine, Poultry, Ruminants, Aqua and Others
Canada
Chart 89: Canada Feed Amino Acids Market Analysis (2012-2022) by Volume in Metric Tons and Value in USD Million
Chart 90: Canada Feed Amino Acids Market Analysis (2012-2022) by Product Type – L-Lysine, Methionine, L-Threonine, L-Tryptophan, L-Valine and Glycine in Metric Tons
Chart 91: Glance at 2012, 2017 and 2022 Canada Feed Amino Acids Volume Market Share (%) by Product Type – L-Lysine, Methionine, L-Threonine, L-Tryptophan, L-Valine and Glycine
Chart 92: Canada Feed Amino Acids Market Analysis (2012-2022) by Product Type – L-Lysine, Methionine, L-Threonine, L-Tryptophan, L-Valine and Glycine in USD Million
Chart 93: Glance at 2012, 2017 and 2022 Canada Feed Amino Acids Value Market Share (%) by Product Type – L-Lysine, Methionine, L-Threonine, L-Tryptophan, L-Valine and Glycine
Chart 94: Canada Feed Amino Acids Market Analysis (2012-2022) by Feed Type – Swine, Poultry, Ruminants, Aqua and Others in Metric Tons
Chart 95: Glance at 2012, 2017 and 2022 Canada Feed Amino Acids Volume Market Share (%) by Feed Type – Swine, Poultry, Ruminants, Aqua and Others
Chart 96: Canada Feed Amino Acids Market Analysis (2012-2022) by Feed Type – Swine, Poultry, Ruminants, Aqua and Others in USD Million
Chart 97: Glance at 2012, 2017 and 2022 Canada Feed Amino Acids Value Market Share (%) by Feed Type – Swine, Poultry, Ruminants, Aqua and Others
Mexico
Chart 98: Mexico Feed Amino Acids Market Analysis (2012-2022) by Volume in Metric Tons and Value in USD Million
Chart 99: Mexico Feed Amino Acids Market Analysis (2012-2022) by Product Type – L-Lysine, Methionine, L-Threonine, L-Tryptophan, L-Valine and Glycine in Metric Tons
Chart 100: Glance at 2012, 2017 and 2022 Mexico Feed Amino Acids Volume Market Share (%) by Product Type – L-Lysine, Methionine, L-Threonine, L-Tryptophan, L-Valine and Glycine
Chart 101: Mexico Feed Amino Acids Market Analysis (2012-2022) by Product Type – L-Lysine, Methionine, L-Threonine, L-Tryptophan, L-Valine and Glycine in USD Million
Chart 102: Glance at 2012, 2017 and 2022 Mexico Feed Amino Acids Value Market Share (%) by Product Type – L-Lysine, Methionine, L-Threonine, L-Tryptophan, L-Valine and Glycine
Chart 103: Mexico Feed Amino Acids Market Analysis (2012-2022) by Feed Type – Swine, Poultry, Ruminants, Aqua and Others in Metric Tons
Chart 104: Glance at 2012, 2017 and 2022 Mexico Feed Amino Acids Volume Market Share (%) by Feed Type – Swine, Poultry, Ruminants, Aqua and Others
Chart 105: Mexico Feed Amino Acids Market Analysis (2012-2022) by Feed Type – Swine, Poultry, Ruminants, Aqua and Others in USD Million
Chart 106: Glance at 2012, 2017 and 2022 Mexico Feed Amino Acids Value Market Share (%) by Feed Type – Swine, Poultry, Ruminants, Aqua and Others
EUROPE
Chart 107: European Feed Amino Acids Market Analysis (2012-2022) by Volume in Metric Tons and Value in USD Million
Chart 108: European Feed Amino Acids Market Analysis (2012-2022) by Geographic Region – France, Germany, Italy, Netherlands, Poland, Russia, Spain, UK and Rest of Europe in Metric Tons
Chart 109: Glance at 2012, 2017 and 2022 European Feed Amino Acids Volume Market Share (%) by Geographic Region – France, Germany, Italy, Netherlands, Poland, Russia, Spain, UK and Rest of Europe
Chart 110: European Feed Amino Acids Market Analysis (2012-2022) by Geographic Region – France, Germany, Italy, Netherlands, Poland, Russia, Spain, UK and Rest of Europe in USD Million
Chart 111: Glance at 2012, 2017 and 2022 European Feed Amino Acids Value Market Share (%) by Geographic Region – France, Germany, Italy, Netherlands, Poland, Russia, Spain, UK and Rest of Europe
Chart 112: European Feed Amino Acids Market Analysis (2012-2022) by Product Type – L-Lysine, Methionine, L-Threonine, L-Tryptophan, L-Valine and Glycine in Metric Tons
Chart 113: Glance at 2012, 2017 and 2022 European Feed Amino Acids Volume Market Share (%) by Product Type – L-Lysine, Methionine, L-Threonine, L-Tryptophan, L-Valine and Glycine
Chart 114: European Feed Amino Acids Market Analysis (2012-2022) by Product Type – L-Lysine, Methionine, L-Threonine, L-Tryptophan, L-Valine and Glycine in USD Million
Chart 115: Glance at 2012, 2017 and 2022 European Feed Amino Acids Value Market Share (%) by Product Type – L-Lysine, Methionine, L-Threonine, L-Tryptophan, L-Valine and Glycine
Chart 116: European Feed Amino Acids Market Analysis (2012-2022) by Feed Type – Swine, Poultry, Ruminants, Aqua and Others in Metric Tons
Chart 117: Glance at 2012, 2017 and 2022 European Feed Amino Acids Volume Market Share (%) by Feed Type – Swine, Poultry, Ruminants, Aqua and Others
Chart 118: European Feed Amino Acids Market Analysis (2012-2022) by Feed Type – Swine, Poultry, Ruminants, Aqua and Others in USD Million
Chart 119: Glance at 2012, 2017 and 2022 European Feed Amino Acids Value Market Share (%) by Feed Type – Swine, Poultry, Ruminants, Aqua and Others
France
Chart 120: France Feed Amino Acids Market Analysis (2012-2022) by Volume in Metric Tons and Value in USD Million
Chart 121: France Feed Amino Acids Market Analysis (2012-2022) by Product Type – L-Lysine, Methionine, L-Threonine, L-Tryptophan, L-Valine and Glycine in Metric Tons
Chart 122: Glance at 2012, 2017 and 2022 France Feed Amino Acids Volume Market Share (%) by Product Type – L-Lysine, Methionine, L-Threonine, L-Tryptophan, L-Valine and Glycine
Chart 123: France Feed Amino Acids Market Analysis (2012-2022) by Product Type – L-Lysine, Methionine, L-Threonine, L-Tryptophan, L-Valine and Glycine in USD Million
Chart 124: Glance at 2012, 2017 and 2022 France Feed Amino Acids Value Market Share (%) by Product Type – L-Lysine, Methionine, L-Threonine, L-Tryptophan, L-Valine and Glycine
Chart 125: France Feed Amino Acids Market Analysis (2012-2022) by Feed Type – Swine, Poultry, Ruminants, Aqua and Others in Metric Tons
Chart 126: Glance at 2012, 2017 and 2022 France Feed Amino Acids Volume Market Share (%) by Feed Type – Swine, Poultry, Ruminants, Aqua and Others
Chart 127: France Feed Amino Acids Market Analysis (2012-2022) by Feed Type – Swine, Poultry, Ruminants, Aqua and Others in USD Million
Chart 128: Glance at 2012, 2017 and 2022 France Feed Amino Acids Value Market Share (%) by Feed Type – Swine, Poultry, Ruminants, Aqua and Others
Germany
Chart 129: Germany Feed Amino Acids Market Analysis (2012-2022) by Volume in Metric Tons and Value in USD Million
Chart 130: Germany Feed Amino Acids Market Analysis (2012-2022) by Product Type – L-Lysine, Methionine, L-Threonine, L-Tryptophan, L-Valine and Glycine in Metric Tons
Chart 131: Glance at 2012, 2017 and 2022 Germany Feed Amino Acids Volume Market Share (%) by Product Type – L-Lysine, Methionine, L-Threonine, L-Tryptophan, L-Valine and Glycine
Chart 132: Germany Feed Amino Acids Market Analysis (2012-2022) by Product Type – L-Lysine, Methionine, L-Threonine, L-Tryptophan, L-Valine and Glycine in USD Million
Chart 133: Glance at 2012, 2017 and 2022 Germany Feed Amino Acids Value Market Share (%) by Product Type – L-Lysine, Methionine, L-Threonine, L-Tryptophan, L-Valine and Glycine
Chart 134: Germany Feed Amino Acids Market Analysis (2012-2022) by Feed Type – Swine, Poultry, Ruminants, Aqua and Others in Metric Tons
Chart 135: Glance at 2012, 2017 and 2022 Germany Feed Amino Acids Volume Market Share (%) by Feed Type – Swine, Poultry, Ruminants, Aqua and Others
Chart 136: Germany Feed Amino Acids Market Analysis (2012-2022) by Feed Type – Swine, Poultry, Ruminants, Aqua and Others in USD Million
Chart 137: Glance at 2012, 2017 and 2022 Germany Feed Amino Acids Value Market Share (%) by Feed Type – Swine, Poultry, Ruminants, Aqua and Others
Italy
Chart 138: Italy Feed Amino Acids Market Analysis (2012-2022) by Volume in Metric Tons and Value in USD Million
Chart 139: Italy Feed Amino Acids Market Analysis (2012-2022) by Product Type – L-Lysine, Methionine, L-Threonine, L-Tryptophan, L-Valine and Glycine in Metric Tons
Chart 140: Glance at 2012, 2017 and 2022 Italy Feed Amino Acids Volume Market Share (%) by Product Type – L-Lysine, Methionine, L-Threonine, L-Tryptophan, L-Valine and Glycine
Chart 141: Italy Feed Amino Acids Market Analysis (2012-2022) by Product Type – L-Lysine, Methionine, L-Threonine, L-Tryptophan, L-Valine and Glycine in USD Million
Chart 142: Glance at 2012, 2017 and 2022 Italy Feed Amino Acids Value Market Share (%) by Product Type – L-Lysine, Methionine, L-Threonine, L-Tryptophan, L-Valine and Glycine
Chart 143: Italy Feed Amino Acids Market Analysis (2012-2022) by Feed Type – Swine, Poultry, Ruminants, Aqua and Others in Metric Tons
Chart 144: Glance at 2012, 2017 and 2022 Italy Feed Amino Acids Volume Market Share (%) by Feed Type – Swine, Poultry, Ruminants, Aqua and Others
Chart 145: Italy Feed Amino Acids Market Analysis (2012-2022) by Feed Type – Swine, Poultry, Ruminants, Aqua and Others in USD Million
Chart 146: Glance at 2012, 2017 and 2022 Italy Feed Amino Acids Value Market Share (%) by Feed Type – Swine, Poultry, Ruminants, Aqua and Others
The Netherlands
Chart 147: Netherlands Feed Amino Acids Market Analysis (2012-2022) by Volume in Metric Tons and Value in USD Million
Chart 148: Netherlands Feed Amino Acids Market Analysis (2012-2022) by Product Type – L-Lysine, Methionine, L-Threonine, L-Tryptophan, L-Valine and Glycine in Metric Tons
Chart 149: Glance at 2012, 2017 and 2022 Netherlands Feed Amino Acids Volume Market Share (%) by Product Type – L-Lysine, Methionine, L-Threonine, L-Tryptophan, L-Valine and Glycine
Chart 150: Netherlands Feed Amino Acids Market Analysis (2012-2022) by Product Type – L-Lysine, Methionine, L-Threonine, L-Tryptophan, L-Valine and Glycine in USD Million
Chart 151: Glance at 2012, 2017 and 2022 Netherlands Feed Amino Acids Value Market Share (%) by Product Type – L-Lysine, Methionine, L-Threonine, L-Tryptophan, L-Valine and Glycine
Chart 152: Netherlands Feed Amino Acids Market Analysis (2012-2022) by Feed Type – Swine, Poultry, Ruminants, Aqua and Others in Metric Tons
Chart 153: Glance at 2012, 2017 and 2022 Netherlands Feed Amino Acids Volume Market Share (%) by Feed Type – Swine, Poultry, Ruminants, Aqua and Others
Chart 154: Netherlands Feed Amino Acids Market Analysis (2012-2022) by Feed Type – Swine, Poultry, Ruminants, Aqua and Others in USD Million
Chart 155: Glance at 2012, 2017 and 2022 Netherlands Feed Amino Acids Value Market Share (%) by Feed Type – Swine, Poultry, Ruminants, Aqua and Others
Poland
Chart 156: Poland Feed Amino Acids Market Analysis (2012-2022) by Volume in Metric Tons and Value in USD Million
Chart 157: Poland Feed Amino Acids Market Analysis (2012-2022) by Product Type – L-Lysine, Methionine, L-Threonine, L-Tryptophan, L-Valine and Glycine in Metric Tons
Chart 158: Glance at 2012, 2017 and 2022 Poland Feed Amino Acids Volume Market Share (%) by Product Type – L-Lysine, Methionine, L-Threonine, L-Tryptophan, L-Valine and Glycine
Chart 159: Poland Feed Amino Acids Market Analysis (2012-2022) by Product Type – L-Lysine, Methionine, L-Threonine, L-Tryptophan, L-Valine and Glycine in USD Million
Chart 160: Glance at 2012, 2017 and 2022 Poland Feed Amino Acids Value Market Share (%) by Product Type – L-Lysine, Methionine, L-Threonine, L-Tryptophan, L-Valine and Glycine
Chart 161: Poland Feed Amino Acids Market Analysis (2012-2022) by Feed Type – Swine, Poultry, Ruminants, Aqua and Others in Metric Tons
Chart 162: Glance at 2012, 2017 and 2022 Poland Feed Amino Acids Volume Market Share (%) by Feed Type – Swine, Poultry, Ruminants, Aqua and Others
Chart 163: Poland Feed Amino Acids Market Analysis (2012-2022) by Feed Type – Swine, Poultry, Ruminants, Aqua and Others in USD Million
Chart 164: Glance at 2012, 2017 and 2022 Poland Feed Amino Acids Value Market Share (%) by Feed Type – Swine, Poultry, Ruminants, Aqua and Others
Russia
Chart 165: Russia Feed Amino Acids Market Analysis (2012-2022) by Volume in Metric Tons and Value in USD Million
Chart 166: Russia Feed Amino Acids Market Analysis (2012-2022) by Product Type – L-Lysine, Methionine, L-Threonine, L-Tryptophan, L-Valine and Glycine in Metric Tons
Chart 167: Glance at 2012, 2017 and 2022 Russia Feed Amino Acids Volume Market Share (%) by Product Type – L-Lysine, Methionine, L-Threonine, L-Tryptophan, L-Valine and Glycine
Chart 168: Russia Feed Amino Acids Market Analysis (2012-2022) by Product Type – L-Lysine, Methionine, L-Threonine, L-Tryptophan, L-Valine and Glycine in USD Million
Chart 169: Glance at 2012, 2017 and 2022 Russia Feed Amino Acids Value Market Share (%) by Product Type – L-Lysine, Methionine, L-Threonine, L-Tryptophan, L-Valine and Glycine
Chart 170: Russia Feed Amino Acids Market Analysis (2012-2022) by Feed Type – Swine, Poultry, Ruminants, Aqua and Others in Metric Tons
Chart 171: Glance at 2012, 2017 and 2022 Russia Feed Amino Acids Volume Market Share (%) by Feed Type – Swine, Poultry, Ruminants, Aqua and Others
Chart 172: Russia Feed Amino Acids Market Analysis (2012-2022) by Feed Type – Swine, Poultry, Ruminants, Aqua and Others in USD Million
Chart 173: Glance at 2012, 2017 and 2022 Russia Feed Amino Acids Value Market Share (%) by Feed Type – Swine, Poultry, Ruminants, Aqua and Others
Spain
Chart 174: Spain Feed Amino Acids Market Analysis (2012-2022) by Volume in Metric Tons and Value in USD Million
Chart 175: Spain Feed Amino Acids Market Analysis (2012-2022) by Product Type – L-Lysine, Methionine, L-Threonine, L-Tryptophan, L-Valine and Glycine in Metric Tons
Chart 176: Glance at 2012, 2017 and 2022 Spain Feed Amino Acids Volume Market Share (%) by Product Type – L-Lysine, Methionine, L-Threonine, L-Tryptophan, L-Valine and Glycine
Chart 177: Spain Feed Amino Acids Market Analysis (2012-2022) by Product Type – L-Lysine, Methionine, L-Threonine, L-Tryptophan, L-Valine and Glycine in USD Million
Chart 178: Glance at 2012, 2017 and 2022 Spain Feed Amino Acids Value Market Share (%) by Product Type – L-Lysine, Methionine, L-Threonine, L-Tryptophan, L-Valine and Glycine
Chart 179: Spain Feed Amino Acids Market Analysis (2012-2022) by Feed Type – Swine, Poultry, Ruminants, Aqua and Others in Metric Tons
Chart 180: Glance at 2012, 2017 and 2022 Spain Feed Amino Acids Volume Market Share (%) by Feed Type – Swine, Poultry, Ruminants, Aqua and Others
Chart 181: Spain Feed Amino Acids Market Analysis (2012-2022) by Feed Type – Swine, Poultry, Ruminants, Aqua and Others in USD Million
Chart 182: Glance at 2012, 2017 and 2022 Spain Feed Amino Acids Value Market Share (%) by Feed Type – Swine, Poultry, Ruminants, Aqua and Others
The United Kingdom
Chart 183: United Kingdom Feed Amino Acids Market Analysis (2012-2022) by Volume in Metric Tons and Value in USD Million
Chart 184: United Kingdom Feed Amino Acids Market Analysis (2012-2022) by Product Type – L-Lysine, Methionine, L-Threonine, L-Tryptophan, L-Valine and Glycine in Metric Tons
Chart 185: Glance at 2012, 2017 and 2022 United Kingdom Feed Amino Acids Volume Market Share (%) by Product Type – L-Lysine, Methionine, L-Threonine, L-Tryptophan, L-Valine and Glycine
Chart 186: United Kingdom Feed Amino Acids Market Analysis (2012-2022) by Product Type – L-Lysine, Methionine, L-Threonine, L-Tryptophan, L-Valine and Glycine in USD Million
Chart 187: Glance at 2012, 2017 and 2022 United Kingdom Feed Amino Acids Value Market Share (%) by Product Type – L-Lysine, Methionine, L-Threonine, L-Tryptophan, L-Valine and Glycine
Chart 188: United Kingdom Feed Amino Acids Market Analysis (2012-2022) by Feed Type – Swine, Poultry, Ruminants, Aqua and Others in Metric Tons
Chart 189: Glance at 2012, 2017 and 2022 United Kingdom Feed Amino Acids Volume Market Share (%) by Feed Type – Swine, Poultry, Ruminants, Aqua and Others
Chart 190: United Kingdom Feed Amino Acids Market Analysis (2012-2022) by Feed Type – Swine, Poultry, Ruminants, Aqua and Others in USD Million
Chart 191: Glance at 2012, 2017 and 2022 United Kingdom Feed Amino Acids Value Market Share (%) by Feed Type – Swine, Poultry, Ruminants, Aqua and Others
Rest of Europe
Chart 192: Rest of Europe Feed Amino Acids Market Analysis (2012-2022) by Volume in Metric Tons and Value in USD Million
Chart 193: Rest of Europe Feed Amino Acids Market Analysis (2012-2022) by Product Type – L-Lysine, Methionine, L-Threonine, L-Tryptophan, L-Valine and Glycine in Metric Tons
Chart 194: Glance at 2012, 2017 and 2022 Rest of Europe Feed Amino Acids Volume Market Share (%) by Product Type – L-Lysine, Methionine, L-Threonine, L-Tryptophan, L-Valine and Glycine
Chart 195: Rest of Europe Feed Amino Acids Market Analysis (2012-2022) by Product Type – L-Lysine, Methionine, L-Threonine, L-Tryptophan, L-Valine and Glycine in USD Million
Chart 196: Glance at 2012, 2017 and 2022 Rest of Europe Feed Amino Acids Value Market Share (%) by Product Type – L-Lysine, Methionine, L-Threonine, L-Tryptophan, L-Valine and Glycine
Chart 197: Rest of Europe Feed Amino Acids Market Analysis (2012-2022) by Feed Type – Swine, Poultry, Ruminants, Aqua and Others in Metric Tons
Chart 198: Glance at 2012, 2017 and 2022 Rest of Europe Feed Amino Acids Volume Market Share (%) by Feed Type – Swine, Poultry, Ruminants, Aqua and Others
Chart 199: Rest of Europe Feed Amino Acids Market Analysis (2012-2022) by Feed Type – Swine, Poultry, Ruminants, Aqua and Others in USD Million
Chart 200: Glance at 2012, 2017 and 2022 Rest of Europe Feed Amino Acids Value Market Share (%) by Feed Type – Swine, Poultry, Ruminants, Aqua and Others
ASIA-PACIFIC
Chart 201: Asia-Pacific Feed Amino Acids Market Analysis (2012-2022) by Volume in Metric Tons and Value in USD Million
Chart 202: Asia-Pacific Feed Amino Acids Market Analysis (2012-2022) by Geographic Region – China, India, Indonesia, Japan, South Korea and Rest of Asia-Pacific in Metric Tons
Chart 203: Glance at 2012, 2017 and 2022 Asia-Pacific Feed Amino Acids Volume Market Share (%) by Geographic Region – China, India, Indonesia, Japan, South Korea and Rest of Asia-Pacific
Chart 204: Asia-Pacific Feed Amino Acids Market Analysis (2012-2022) by Geographic Region – China, India, Indonesia, Japan, South Korea and Rest of Asia-Pacific in USD Million
Chart 205: Glance at 2012, 2017 and 2022 Asia-Pacific Feed Amino Acids Value Market Share (%) by Geographic Region – China, India, Indonesia, Japan, South Korea and Rest of Asia-Pacific
Chart 206: Asia-Pacific Feed Amino Acids Market Analysis (2012-2022) by Product Type – L-Lysine, Methionine, L-Threonine, L-Tryptophan, L-Valine and Glycine in Metric Tons
Chart 207: Glance at 2012, 2017 and 2022 Asia-Pacific Feed Amino Acids Volume Market Share (%) by Product Type – L-Lysine, Methionine, L-Threonine, L-Tryptophan, L-Valine and Glycine
Chart 208: Asia-Pacific Feed Amino Acids Market Analysis (2012-2022) by Product Type – L-Lysine, Methionine, L-Threonine, L-Tryptophan, L-Valine and Glycine in USD Million
Chart 209: Glance at 2012, 2017 and 2022 Asia-Pacific Feed Amino Acids Value Market Share (%) by Product Type – L-Lysine, Methionine, L-Threonine, L-Tryptophan, L-Valine and Glycine
Chart 210: Asia-Pacific Feed Amino Acids Market Analysis (2012-2022) by Feed Type – Swine, Poultry, Ruminants, Aqua and Others in Metric Tons
Chart 211: Glance at 2012, 2017 and 2022 Asia-Pacific Feed Amino Acids Volume Market Share (%) by Feed Type – Swine, Poultry, Ruminants, Aqua and Others
Chart 212: Asia-Pacific Feed Amino Acids Market Analysis (2012-2022) by Feed Type – Swine, Poultry, Ruminants, Aqua and Others in USD Million
Chart 213: Glance at 2012, 2017 and 2022 Asia-Pacific Feed Amino Acids Value Market Share (%) by Feed Type – Swine, Poultry, Ruminants, Aqua and Others
China
Chart 214: China Feed Amino Acids Market Analysis (2012-2022) by Volume in Metric Tons and Value in USD Million
Chart 215: China Feed Amino Acids Market Analysis (2012-2022) by Product Type – L-Lysine, Methionine, L-Threonine, L-Tryptophan, L-Valine and Glycine in Metric Tons
Chart 216: Glance at 2012, 2017 and 2022 China Feed Amino Acids Volume Market Share (%) by Product Type – L-Lysine, Methionine, L-Threonine, L-Tryptophan, L-Valine and Glycine
Chart 217: China Feed Amino Acids Market Analysis (2012-2022) by Product Type – L-Lysine, Methionine, L-Threonine, L-Tryptophan, L-Valine and Glycine in USD Million
Chart 218: Glance at 2012, 2017 and 2022 China Feed Amino Acids Value Market Share (%) by Product Type – L-Lysine, Methionine, L-Threonine, L-Tryptophan, L-Valine and Glycine
Chart 219: China Feed Amino Acids Market Analysis (2012-2022) by Feed Type – Swine, Poultry, Ruminants, Aqua and Others in Metric Tons
Chart 220: Glance at 2012, 2017 and 2022 China Feed Amino Acids Volume Market Share (%) by Feed Type – Swine, Poultry, Ruminants, Aqua and Others
Chart 221: China Feed Amino Acids Market Analysis (2012-2022) by Feed Type – Swine, Poultry, Ruminants, Aqua and Others in USD Million
Chart 222: Glance at 2012, 2017 and 2022 China Feed Amino Acids Value Market Share (%) by Feed Type – Swine, Poultry, Ruminants, Aqua and Others
India
Chart 223: India Feed Amino Acids Market Analysis (2012-2022) by Volume in Metric Tons and Value in USD Million
Chart 224: India Feed Amino Acids Market Analysis (2012-2022) by Product Type – L-Lysine, Methionine, L-Threonine, L-Tryptophan, L-Valine and Glycine in Metric Tons
Chart 225: Glance at 2012, 2017 and 2022 India Feed Amino Acids Volume Market Share (%) by Product Type – L-Lysine, Methionine, L-Threonine, L-Tryptophan, L-Valine and Glycine
Chart 226: India Feed Amino Acids Market Analysis (2012-2022) by Product Type – L-Lysine, Methionine, L-Threonine, L-Tryptophan, L-Valine and Glycine in USD Million
Chart 227: Glance at 2012, 2017 and 2022 India Feed Amino Acids Value Market Share (%) by Product Type – L-Lysine, Methionine, L-Threonine, L-Tryptophan, L-Valine and Glycine
Chart 228: India Feed Amino Acids Market Analysis (2012-2022) by Feed Type – Poultry, Ruminants and Aqua & Other in Metric Tons
Chart 229: Glance at 2012, 2017 and 2022 India Feed Amino Acids Volume Market Share (%) by Feed Type – Poultry, Ruminants and Aqua & Other
Chart 230: India Feed Amino Acids Market Analysis (2012-2022) by Feed Type – Poultry, Ruminants and Aqua & Other in USD Million
Chart 231: Glance at 2012, 2017 and 2022 India Feed Amino Acids Value Market Share (%) by Feed Type – Poultry, Ruminants and Aqua & Other
Indonesia
Chart 232: Indonesia Feed Amino Acids Market Analysis (2012-2022) by Volume in Metric Tons and Value in USD Million
Chart 233: Indonesia Feed Amino Acids Market Analysis (2012-2022) by Product Type – L-Lysine, Methionine, L-Threonine, L-Tryptophan, L-Valine and Glycine in Metric Tons
Chart 234: Glance at 2012, 2017 and 2022 Indonesia Feed Amino Acids Volume Market Share (%) by Product Type – L-Lysine, Methionine, L-Threonine, L-Tryptophan, L-Valine and Glycine
Chart 235: Indonesia Feed Amino Acids Market Analysis (2012-2022) by Product Type – L-Lysine, Methionine, L-Threonine, L-Tryptophan, L-Valine and Glycine in USD Million
Chart 236: Glance at 2012, 2017 and 2022 Indonesia Feed Amino Acids Value Market Share (%) by Product Type – L-Lysine, Methionine, L-Threonine, L-Tryptophan, L-Valine and Glycine
Chart 237: Indonesia Feed Amino Acids Market Analysis (2012-2022) by Feed Type – Swine, Poultry, Ruminants and Aqua & Other in Metric Tons
Chart 238: Glance at 2012, 2017 and 2022 Indonesia Feed Amino Acids Volume Market Share (%) by Feed Type – Swine, Poultry, Ruminants and Aqua & Other
Chart 239: Indonesia Feed Amino Acids Market Analysis (2012-2022) by Feed Type – Swine, Poultry, Ruminants and Aqua & Other in USD Million
Chart 240: Glance at 2012, 2017 and 2022 Indonesia Feed Amino Acids Value Market Share (%) by Feed Type – Swine, Poultry, Ruminants and Aqua & Other
Japan
Chart 241: Japan Feed Amino Acids Market Analysis (2012-2022) by Volume in Metric Tons and Value in USD Million
Chart 242: Japan Feed Amino Acids Market Analysis (2012-2022) by Product Type – L-Lysine, Methionine, L-Threonine, L-Tryptophan, L-Valine and Glycine in Metric Tons
Chart 243: Glance at 2012, 2017 and 2022 Japan Feed Amino Acids Volume Market Share (%) by Product Type – L-Lysine, Methionine, L-Threonine, L-Tryptophan, L-Valine and Glycine
Chart 244: Japan Feed Amino Acids Market Analysis (2012-2022) by Product Type – L-Lysine, Methionine, L-Threonine, L-Tryptophan, L-Valine and Glycine in USD Million
Chart 245: Glance at 2012, 2017 and 2022 Japan Feed Amino Acids Value Market Share (%) by Product Type – L-Lysine, Methionine, L-Threonine, L-Tryptophan, L-Valine and Glycine
Chart 246: Japan Feed Amino Acids Market Analysis (2012-2022) by Feed Type – Swine, Poultry, Ruminants, Aqua and Others in Metric Tons
Chart 247: Glance at 2012, 2017 and 2022 Japan Feed Amino Acids Volume Market Share (%) by Feed Type – Swine, Poultry, Ruminants, Aqua and Others
Chart 248: Japan Feed Amino Acids Market Analysis (2012-2022) by Feed Type – Swine, Poultry, Ruminants, Aqua and Others in USD Million
Chart 249: Glance at 2012, 2017 and 2022 Japan Feed Amino Acids Value Market Share (%) by Feed Type – Swine, Poultry, Ruminants, Aqua and Others
South Korea
Chart 250: South Korea Feed Amino Acids Market Analysis (2012-2022) by Volume in Metric Tons and Value in USD Million
Chart 251: South Korea Feed Amino Acids Market Analysis (2012-2022) by Product Type – L-Lysine, Methionine, L-Threonine, L-Tryptophan, L-Valine and Glycine in Metric Tons
Chart 252: Glance at 2012, 2017 and 2022 South Korea Feed Amino Acids Volume Market Share (%) by Product Type – L-Lysine, Methionine, L-Threonine, L-Tryptophan, L-Valine and Glycine
Chart 253: South Korea Feed Amino Acids Market Analysis (2012-2022) by Product Type – L-Lysine, Methionine, L-Threonine, L-Tryptophan, L-Valine and Glycine in USD Million
Chart 254: Glance at 2012, 2017 and 2022 South Korea Feed Amino Acids Value Market Share (%) by Product Type – L-Lysine, Methionine, L-Threonine, L-Tryptophan, L-Valine and Glycine
Chart 255: South Korea Feed Amino Acids Market Analysis (2012-2022) by Feed Type – Swine, Poultry, Ruminants, Aqua and Others in Metric Tons
Chart 256: Glance at 2012, 2017 and 2022 South Korea Feed Amino Acids Volume Market Share (%) by Feed Type – Swine, Poultry, Ruminants, Aqua and Others
Chart 257: South Korea Feed Amino Acids Market Analysis (2012-2022) by Feed Type – Swine, Poultry, Ruminants, Aqua and Others in USD Million
Chart 258: Glance at 2012, 2017 and 2022 South Korea Feed Amino Acids Value Market Share (%) by Feed Type – Swine, Poultry, Ruminants, Aqua and Others
Rest of Asia-Pacific
Chart 259: Rest of Asia-Pacific Feed Amino Acids Market Analysis (2012-2022) by Volume in Metric Tons and Value in USD Million
Chart 260: Rest of Asia-Pacific Feed Amino Acids Market Analysis (2012-2022) by Product Type – L-Lysine, Methionine, L-Threonine, L-Tryptophan, L-Valine and Glycine in Metric Tons
Chart 261: Glance at 2012, 2017 and 2022 Rest of Asia-Pacific Feed Amino Acids Volume Market Share (%) by Product Type – L-Lysine, Methionine, L-Threonine, L-Tryptophan, L-Valine and Glycine
Chart 262: Rest of Asia-Pacific Feed Amino Acids Market Analysis (2012-2022) by Product Type – L-Lysine, Methionine, L-Threonine, L-Tryptophan, L-Valine and Glycine in USD Million
Chart 263: Glance at 2012, 2017 and 2022 Rest of Asia-Pacific Feed Amino Acids Value Market Share (%) by Product Type – L-Lysine, Methionine, L-Threonine, L-Tryptophan, L-Valine and Glycine
Chart 264: Rest of Asia-Pacific Feed Amino Acids Market Analysis (2012-2022) by Feed Type – Swine, Poultry, Ruminants, Aqua and Others in Metric Tons
Chart 265: Glance at 2012, 2017 and 2022 Rest of Asia-Pacific Feed Amino Acids Volume Market Share (%) by Feed Type – Swine, Poultry, Ruminants, Aqua and Others
Chart 266: Rest of Asia-Pacific Feed Amino Acids Market Analysis (2012-2022) by Feed Type – Swine, Poultry, Ruminants, Aqua and Others in USD Million
Chart 267: Glance at 2012, 2017 and 2022 Rest of Asia-Pacific Feed Amino Acids Value Market Share (%) by Feed Type – Swine, Poultry, Ruminants, Aqua and Others
SOUTH AMERICA
Chart 268: South America Feed Amino Acids Market Analysis (2012-2022) by Volume in Metric Tons and Value in USD Million
Chart 269: South America Feed Amino Acids Market Analysis (2012-2022) by Geographic Region – Brazil, Argentina and Rest of South America in Metric Tons
Chart 270: Glance at 2012, 2017 and 2022 South America Feed Amino Acids Volume Market Share (%) by Geographic Region – Brazil, Argentina and Rest of South America
Chart 271: South America Feed Amino Acids Market Analysis (2012-2022) by Geographic Region – Brazil, Argentina and Rest of South America in USD Million
Chart 272: Glance at 2012, 2017 and 2022 South America Feed Amino Acids Value Market Share (%) by Geographic Region – Brazil, Argentina and Rest of South America
Chart 273: South America Feed Amino Acids Market Analysis (2012-2022) by Product Type – L-Lysine, Methionine, L-Threonine, L-Tryptophan, L-Valine and Glycine in Metric Tons
Chart 274: Glance at 2012, 2017 and 2022 South America Feed Amino Acids Volume Market Share (%) by Product Type – L-Lysine, Methionine, L-Threonine, L-Tryptophan, L-Valine and Glycine
Chart 275: South America Feed Amino Acids Market Analysis (2012-2022) by Product Type – L-Lysine, Methionine, L-Threonine, L-Tryptophan, L-Valine and Glycine in USD Million
Chart 276: Glance at 2012, 2017 and 2022 South America Feed Amino Acids Value Market Share (%) by Product Type – L-Lysine, Methionine, L-Threonine, L-Tryptophan, L-Valine and Glycine
Chart 277: South America Feed Amino Acids Market Analysis (2012-2022) by Feed Type – Swine, Poultry, Ruminants, Aqua and Others in Metric Tons
Chart 278: Glance at 2012, 2017 and 2022 South America Feed Amino Acids Volume Market Share (%) by Feed Type – Swine, Poultry, Ruminants, Aqua and Others
Chart 279: South America Feed Amino Acids Market Analysis (2012-2022) by Feed Type – Swine, Poultry, Ruminants, Aqua and Others in USD Million
Chart 280: Glance at 2012, 2017 and 2022 South America Feed Amino Acids Value Market Share (%) by Feed Type – Swine, Poultry, Ruminants, Aqua and Others
Brazil
Chart 281: Brazil Feed Amino Acids Market Analysis (2012-2022) by Volume in Metric Tons and Value in USD Million
Chart 282: Brazil Feed Amino Acids Market Analysis (2012-2022) by Product Type – L-Lysine, Methionine, L-Threonine, L-Tryptophan, L-Valine and Glycine in Metric Tons
Chart 283: Glance at 2012, 2017 and 2022 Brazil Feed Amino Acids Volume Market Share (%) by Product Type – L-Lysine, Methionine, L-Threonine, L-Tryptophan, L-Valine and Glycine
Chart 284: Brazil Feed Amino Acids Market Analysis (2012-2022) by Product Type – L-Lysine, Methionine, L-Threonine, L-Tryptophan, L-Valine and Glycine in USD Million
Chart 285: Glance at 2012, 2017 and 2022 Brazil Feed Amino Acids Value Market Share (%) by Product Type – L-Lysine, Methionine, L-Threonine, L-Tryptophan, L-Valine and Glycine
Chart 286: Brazil Feed Amino Acids Market Analysis (2012-2022) by Feed Type – Swine, Poultry, Ruminants, Aqua and Others in Metric Tons
Chart 287: Glance at 2012, 2017 and 2022 Brazil Feed Amino Acids Volume Market Share (%) by Feed Type – Swine, Poultry, Ruminants, Aqua and Others
Chart 288: Brazil Feed Amino Acids Market Analysis (2012-2022) by Feed Type – Swine, Poultry, Ruminants, Aqua and Others in USD Million
Chart 289: Glance at 2012, 2017 and 2022 Brazil Feed Amino Acids Value Market Share (%) by Feed Type – Swine, Poultry, Ruminants, Aqua and Others
Argentina
Chart 290: Argentina Feed Amino Acids Market Analysis (2012-2022) by Volume in Metric Tons and Value in USD Million
Chart 291: Argentina Feed Amino Acids Market Analysis (2012-2022) by Product Type – L-Lysine, Methionine, L-Threonine, L-Tryptophan, L-Valine and Glycine in Metric Tons
Chart 292: Glance at 2012, 2017 and 2022 Argentina Feed Amino Acids Volume Market Share (%) by Product Type – L-Lysine, Methionine, L-Threonine, L-Tryptophan, L-Valine and Glycine
Chart 293: Argentina Feed Amino Acids Market Analysis (2012-2022) by Product Type – L-Lysine, Methionine, L-Threonine, L-Tryptophan, L-Valine and Glycine in USD Million
Chart 294: Glance at 2012, 2017 and 2022 Argentina Feed Amino Acids Value Market Share (%) by Product Type – L-Lysine, Methionine, L-Threonine, L-Tryptophan, L-Valine and Glycine
Chart 295: Argentina Feed Amino Acids Market Analysis (2012-2022) by Feed Type – Swine, Poultry, Ruminants, Aqua and Others in Metric Tons
Chart 296: Glance at 2012, 2017 and 2022 Argentina Feed Amino Acids Volume Market Share (%) by Feed Type – Swine, Poultry, Ruminants, Aqua and Others
Chart 297: Argentina Feed Amino Acids Market Analysis (2012-2022) by Feed Type – Swine, Poultry, Ruminants, Aqua and Others in USD Million
Chart 298: Glance at 2012, 2017 and 2022 Argentina Feed Amino Acids Value Market Share (%) by Feed Type – Swine, Poultry, Ruminants, Aqua and Others
Rest of South America
Chart 299: Rest of South America Feed Amino Acids Market Analysis (2012-2022) by Volume in Metric Tons and Value in USD Million
Chart 300: Rest of South America Feed Amino Acids Market Analysis (2012-2022) by Product Type – L-Lysine, Methionine, L-Threonine, L-Tryptophan, L-Valine and Glycine in Metric Tons
Chart 301: Glance at 2012, 2017 and 2022 Rest of South America Feed Amino Acids Volume Market Share (%) by Product Type – L-Lysine, Methionine, L-Threonine, L-Tryptophan, L-Valine and Glycine
Chart 302: Rest of South America Feed Amino Acids Market Analysis (2012-2022) by Product Type – L-Lysine, Methionine, L-Threonine, L-Tryptophan, L-Valine and Glycine in USD Million
Chart 303: Glance at 2012, 2017 and 2022 Rest of South America Feed Amino Acids Value Market Share (%) by Product Type – L-Lysine, Methionine, L-Threonine, L-Tryptophan, L-Valine and Glycine
Chart 304: Rest of South America Feed Amino Acids Market Analysis (2012-2022) by Feed Type – Swine, Poultry, Ruminants, Aqua and Others in Metric Tons
Chart 305: Glance at 2012, 2017 and 2022 Rest of South America Feed Amino Acids Volume Market Share (%) by Feed Type – Swine, Poultry, Ruminants, Aqua and Others
Chart 306: Rest of South America Feed Amino Acids Market Analysis (2012-2022) by Feed Type – Swine, Poultry, Ruminants, Aqua and Others in USD Million
Chart 307: Glance at 2012, 2017 and 2022 Rest of South America Feed Amino Acids Value Market Share (%) by Feed Type – Swine, Poultry, Ruminants, Aqua and Others
REST OF WORLD
Chart 308: Rest of World Feed Amino Acids Market Analysis (2012-2022) by Volume in Metric Tons and Value in USD Million
Chart 309: Rest of World Feed Amino Acids Market Analysis (2012-2022) by Geographic Region – Middle East and Africa in Metric Tons
Chart 310: Glance at 2012, 2017 and 2022 Rest of World Feed Amino Acids Volume Market Share (%) by Geographic Region – Middle East and Africa
Chart 311: Rest of World Feed Amino Acids Market Analysis (2012-2022) by Geographic Region – Middle East and Africa in USD Million
Chart 312: Glance at 2012, 2017 and 2022 Rest of World Feed Amino Acids Value Market Share (%) by Geographic Region – Middle East and Africa
Chart 313: Rest of World Feed Amino Acids Market Analysis (2012-2022) by Product Type – L-Lysine, Methionine, L-Threonine, L-Tryptophan, L-Valine and Glycine in Metric Tons
Chart 314: Glance at 2012, 2017 and 2022 Rest of World Feed Amino Acids Volume Market Share (%) by Product Type – L-Lysine, Methionine, L-Threonine, L-Tryptophan, L-Valine and Glycine
Chart 315: Rest of World Feed Amino Acids Market Analysis (2012-2022) by Product Type – L-Lysine, Methionine, L-Threonine, L-Tryptophan, L-Valine and Glycine in USD Million
Chart 316: Glance at 2012, 2017 and 2022 Rest of World Feed Amino Acids Value Market Share (%) by Product Type – L-Lysine, Methionine, L-Threonine, L-Tryptophan, L-Valine and Glycine
Chart 317: Rest of World Feed Amino Acids Market Analysis (2012-2022) by Feed Type – Swine, Poultry, Ruminants, Aqua and Others in Metric Tons
Chart 318: Glance at 2012, 2017 and 2022 Rest of World Feed Amino Acids Volume Market Share (%) by Feed Type – Swine, Poultry, Ruminants, Aqua and Others
Chart 319: Rest of World Feed Amino Acids Market Analysis (2012-2022) by Feed Type – Swine, Poultry, Ruminants, Aqua and Others in USD Million
Chart 320: Glance at 2012, 2017 and 2022 Rest of World Feed Amino Acids Value Market Share (%) by Feed Type – Swine, Poultry, Ruminants, Aqua and Others
Tables:
Table 1: 20 Core Protein-Building Amino Acids
Table 2: Essential and Non-Essential Amino Acids
Table 3: Amino Acids Classification based on Charge and Polarity of Side Chains (R Group)
Table 4: Glycogenic and/or Ketogenic Amino Acids
Table 5: Amino Acids Classification based on their Structure of Side Chains
Table 6: Amino Acids Classification based on their Functionality
Table 7: Amino Acids Production Processes
Table 8: Classification of the 20 Amino Acids for Pigs and Broiler
Table 9: Limiting Amino Acids in Growing Pigs and Broiler
Table 10: Comparison of arable land required for soybean meal, corn and L-Lysine HCl
Table 11: True Ideal Digestible Amino Acids Ratios for Broilers
Table 12: Recommendations for True Digestible Amino Acid Content of Complete Diets for Broilers
Table 13: Recommendations for True Digestible Amino Acids for Layers
Table 14: Recommendations for Digestible Amino Acids for Male Heavy Turkeys
Table 15: Recommendations for the Total Amino Acid Content of Complete Diets for Ducks (Muscovy)
Table 16: Standardized Ideal Digestible Amino Acid Ratios for Pigs
Table 17- Recommendations for Digestible Amino Acids Content in Feed for Pigs
Table 18: Recommended Amino Acid Ratios in % of Lysine for Calves
Table 19: Amino acid requirements (g/d) in calves
Table 20: Methionine and Lysine Requirements for Dairy Cows
Table 21: Amino Acid Content in Diets of Growing Fish and Crustacean
Adisseo France S.A.S
Ajinomoto Co., Inc.
Archer Daniels Midland Company
Chongqing Unisplendour Chemical Co., Ltd.
CJ CheilJedang Corporation
Daesang Corporation
Evonik Industries AG
Global Bio-Chem Technology Group Company Limited
Hebei Donghua Chemical Group
Linghua Group Limited
Meihua Holdings Group Co., Ltd.
Newtrend Group
Novus International, Inc.
Shijiazhuang Donghua Jinlong Chemical Co., Ltd.
Sumitomo Chemical Company, Limited
SINGLE USER/ENTERPRISE LICENSE
Electronic (PDF)
Latest Version Available!
Latest version of this report is available. Click below to view report.
Latest Publication
avialable for this report
OTHER ARCHIVED REPORTS
Natural Source Vitamin E (Tocopherols and Tocotrienols) – A Global Market Overview
Report Code: PH002ARCH | Pages: 278 | Price: $2700
Published
Oct 2021
Vacuum Insulation Panels (VIPs) – A Global Market Overview-2021
Report Code: MG023ARCH | Pages: 272 | Price: $1800
Published
Jan 2021
Powder Metallurgy – A Global Market Overview
Report Code: CP057ARCH | Pages: 567 | Price: $2187
Published
Oct 2020
Hydraulic Components – A Global Market Overview
Report Code: MG014ARCH | Pages: 464 | Price: $2475
Published
Aug 2020

Global Zeolites Market – Products and Applications | Covid-19 Impact
Report Code: CP091ARCH | Pages: 450 | Price: $2475
Published
Jul 2020