Global Polyols (Sugar Alcohols) Market Trends and Outlook
Polyols, also known as sugar alcohols, are widely used as low-calorie sweeteners and functional ingredients across food, beverages, confectionery, personal care, and pharmaceutical applications. Beyond sweetness, they provide bulk, texture, moisture retention, and stability, making them highly versatile in product formulations. Common polyols such as sorbitol, xylitol, erythritol, and maltitol are increasingly gaining traction as consumers shift toward healthier sugar alternatives driven by rising concerns around diabetes, obesity, and overall calorie intake.
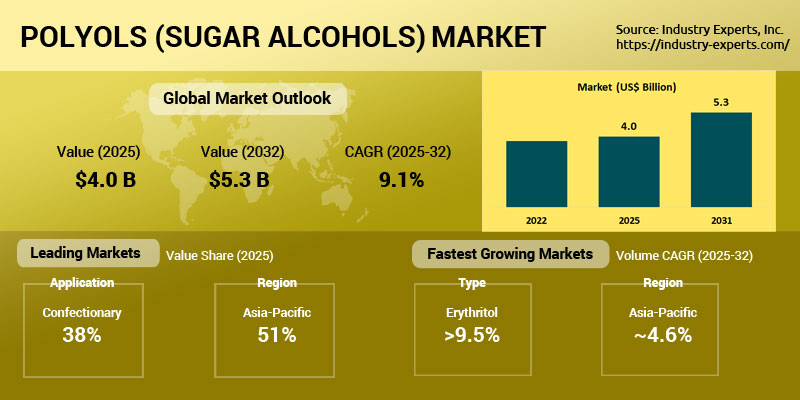
The global polyols (sugar alcohols) market reached US$4 billion in 2025, and is projected to grow to 2.8 million metric tons and US$5.3 billion by 2032, registering CAGRs of 4.3% in value during 2025-2032. Growth is being fueled by increasing demand for sugar-free and low-calorie food products, expanding applications in functional foods and beverages, and rising adoption in oral care and pharmaceutical formulations. The faster growth in value compared to volume highlights a shift toward higher-value polyols such as erythritol and xylitol, supported by clean-label trends and premium product positioning.
Market trends indicate a structural shift from traditional applications like confectionery toward broader food and beverage use, alongside growing demand in emerging markets. Asia-Pacific continues to dominate both production and consumption due to strong industrial base and rising health awareness, while innovation in product formulations and ingredient blends is enhancing functionality and taste profiles. Overall, the market is poised for steady expansion, supported by health-driven consumer behavior, regulatory support for sugar reduction, and increasing penetration of polyols across diverse end-use industries.
The global polyols market is highly competitive, with key players including Archer Daniels Midland Company, Cargill, Inc., Ingredion Incorporated, Roquette Freres S.A., Jungbunzlauer S.A., BENEO GmbH, and Tereos Starch & Sweeteners.
Polyols (Sugar Alcohols) Regional Market Analysis
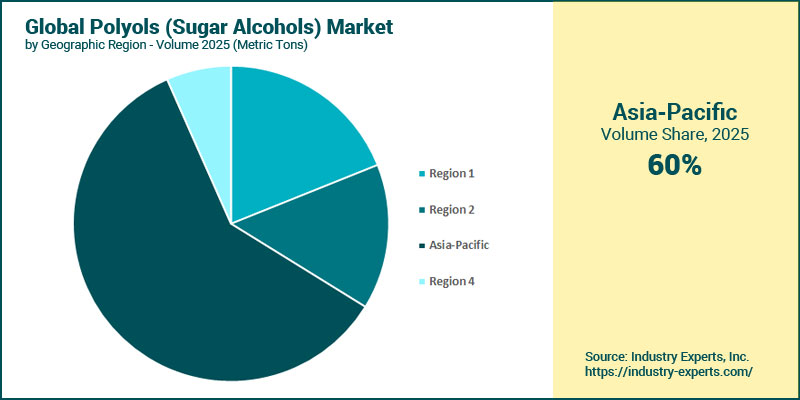
Asia-Pacific dominates the global market with 59.6% in 2025, driven by large-scale production capacity, strong demand from food processing industries, and high consumption in countries such as China and India, while North America is the second-largest region at 405 thousand metric tons, supported by mature markets for sugar-free foods and personal care products. Asia-Pacific is also the fastest-growing region at a CAGR of 4.6%, further increasing its share to 62.3% by 2032, fueled by expanding middle-class populations, rising health awareness, and growing adoption of low-calorie sweeteners. Meanwhile, North America (2.6%) and Europe (2.5%) show slower growth due to market maturity, leading to a continued geographic shift toward Asia-Pacific as the dominant consumption and production hub.
Polyols (Sugar Alcohols) Market Analysis by Polyol Type
Sorbitol dominates the global market with 56.5% share in 2025, driven by its widespread use across food, oral care, and pharmaceutical applications due to cost-effectiveness and versatility, while Xylitol ranks as the second-largest segment at 271 thousand metric tons, supported by its strong positioning in dental care and premium sugar-free products. Erythritol is the fastest-growing segment at a CAGR of 9.7%, significantly increasing its share from 11% in 2025 to 16.1% by 2032, fueled by rising demand for zero-calorie, clean-label sweeteners in beverages and functional foods; Xylitol follows as the second-fastest at 4.5% CAGR, benefiting from expanding applications in health-focused confectionery. Meanwhile, Sorbitol, Maltitol, Mannitol, Isomalt, and Lactitol show relatively moderate growth due to maturity in traditional applications, leading to a gradual shift in market composition toward high-growth, next-generation sweeteners like erythritol.
Polyols (Sugar Alcohols) Market Analysis by End-use Application
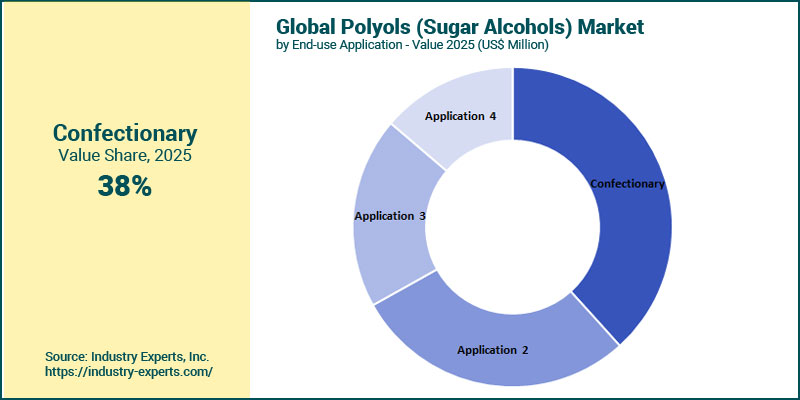
Personal Care dominates in volume with 34% share, supported by strong usage in oral care and cosmetic formulations, while Confectionery leads in value at US$1.51 billion (38.3%), driven by higher pricing in sugar-free confectionery products. Food & Beverages is the fastest-growing segment across both metrics (6.3% CAGR), expanding its share to 29.1% in volume and 32.8% in value by 2032, fueled by rising demand for low-calorie, diabetic-friendly, and functional food products, making it the clear second-fastest evolving segment approaching leadership. Meanwhile, Confectionery shows moderate growth, whereas Personal Care and Other applications grow at a slower pace.
Polyols (Sugar Alcohols) Market Report Scope
This global report on Polyols (Sugar Alcohols) analyzes the market based on end-use application for the period 2022-2032 with projections from 2025 to 2032 in terms of volume in metric tons and value in US$. In addition to providing profiles of major companies operating in the Polyols (Sugar Alcohols) industry, the latest corporate, product, production capacity and industrial developments have been covered to offer a clear panorama of Polyols (Sugar Alcohols) industry.
Key Metrics
| Historical Period: | 2022-2025 | |
| Base Year: | 2025 | |
| Forecast Period: | 2025-2032 | |
| Units: | Volume consumption in Metric Tons and Value market in US$ | |
| Companies Mentioned: | 50+ |
Global Polyols (Sugar Alcohols) Market by Geographic Region
- North America (The United States, Canada and Mexico)
- Europe (Germany, France, Italy, Spain, the United Kingdom, Russia and Rest of Europe)
- Asia-Pacific (China, Japan, South Korea, India and Rest of Asia-Pacific)
- Rest of World (South America and Middle-East & Africa)
Global Polyols (Sugar Alcohols) Market by Polyol Type
- Sorbitol
- Xylitol
- Mannitol
- Maltitol
- Erythritol
- Isomalt
- Lactitol
Global Polyols (Sugar Alcohols) Market by End-use Application
- Confectionary
- Food & Beverages
- Personal Care
- Others
Polyols (Sugar Alcohols) Market Frequently Asked Questions (FAQs)
Polyols are low-calorie sweeteners used as sugar substitutes in food, beverages, pharmaceuticals, and personal care products.
Growth is driven by increasing demand for sugar-free products, rising diabetes awareness, and growing health-conscious consumer behavior.
Erythritol is the fastest-growing polyol due to its zero-calorie profile and clean-label appeal.
Asia-Pacific dominates the market due to strong production capacity and high consumption.
Major applications include food & beverages, confectionery, personal care, and pharmaceuticals.
The market is projected to reach US$5.3 billion and 2.8 million metric tons by 2032.
Key players include ADM, Cargill, Roquette, Ingredion, Jungbunzlauer, and BENEO.
PART A: GLOBAL MARKET PERSPECTIVE
1. INTRODUCTION
- Product Outline
- Categorization of Sweeteners
- Caloric Sweeteners
- High Intense Sweeteners (HIS)
- Polyols (Sugar Alcohols)
- High Intense Sweeteners
- Applications for Artificial High Intense Sweeteners
- Potential Health Benefits Offered by Artificial Sweeteners
- Controlling Weight
- Controlling Diabetes
- Potential Health Issues Associated with Artificial High Intense Sweeteners
- Categories of Artificial High Intense Sweeteners
- Saccharin
- Acesulfame Potassium (Acesulfame K)
- Sucralose
- Aspartame
- Neotame
- Cyclamates
- Categories of Natural High Intense Sweeteners
- Stevia Sweetener
- Luo Han Guo
- Polyols (Sugar Alcohols)
- Potential Health Benefits Offered by Polyols/Sugar Alcohols
- Help in Controlling Weight
- Diabetes
- Tooth Decay
- Other Benefits
- Potential Health Concerns Associated with Polyols/Sugar Alcohols
- Polyols and Gastrointestinal (GI) Effects
- Industrial Production of Polyols
- Applications of Polyols/Sugar Alcohols
- Food Applications
- Pharmaceutical Applications
- Personal Hygiene Product Applications
- Sorbitol
- Applications for Sorbitol
- Mannitol
- Applications for Mannitol
- Maltitol
- Applications for Maltitol
- Xylitol
- Applications for Xylitol
- Erythritol
- Applications for Erythritol
- Isomalt
- Applications for Isomalt
- Lactitol
- Applications for Lactitol
2. KEY MARKET TRENDS
3. REGULATORY LANDSCAPE
- Polyols and High Intense Sweetener Regulations around the Globe
- European Union
- Purity Criteria
- Labeling
- Health Claims
- Nutrition Claims
- The United States
- Health Claims
- Labeling
- Japan
- Nutritional Claims
- Health Claims
- India
- Labeling
- Health Claims
- Nutritional Claims
- China
4. KEY MARKET PLAYERS
- Archer Daniels Midland Company
- B Food Science Co., Ltd.
- Baolingbao Biology Co., Ltd
- BENEO GmbH
- Cargill, Inc.
- DFI Corporation
- Dongxiao Biotechnology Co., Ltd
- Ecogreen Oleochemicals (Singapore) Pte., Ltd.
- Ingredion Incorporated
- International Flavors & Fragrances Inc.
- Jungbunzlauer S.A.
- Mitsubishi Corporation Life Sciences Limited
- Ningxia Eppen Biotech Co., Ltd
- O'laughlin Industries Co., Ltd.
- Roquette Freres S.A.
- SAPPI Limited
- Shandong Futaste Co., Ltd.
- Shandong Longlive Bio-Technology Co., Ltd.
- Shandong Sanyuan Biotechnology Co., Ltd
- Shandong Tianli Pharmaceutical Co., Ltd.
- Tereos Starch & Sweeteners s.a.s. (Tereos Syral)
- Zhejiang Huakang Pharmaceutical Co., Ltd.
- Zuchem Inc.
5. KEY BUSINESS AND PRODUCT TRENDS
6. GLOBAL MARKET OVERVIEW
- Global Polyols (Sugar Alcohols) Market Overview by End-Use Application
- Polyols (Sugar Alcohols) End-Use Application Market Overview by Global Region
- Confectionery
- Food & Beverages
- Personal Care
- Other Applications
- Global Polyols (Sugar Alcohols) Market Overview by Polyol Type
- Global Polyol Type Market Analysis
- Sorbitol
- Global Sorbitol Market Overview by Geographic Region
- Global Sorbitol Market Overview by End-Use Application
- Xylitol
- Global Xylitol Market Overview by Geographic Region
- Global Xylitol Market Overview by End-Use Application
- Mannitol
- Global Mannitol Market Overview by Geographic Region
- Global Mannitol Market Overview by End-Use Application
- Maltitol
- Global Maltitol Market Overview by Geographic Region
- Global Maltitol Market Overview by End-Use Application
- Erythritol
- Global Erythritol Market Overview by Geographic Region
- Global Erythritol Market Overview by End-Use Application
- Isomalt
- Global Isomalt Market Overview by Geographic Region
- Global Isomalt Market Overview by End-Use Application
- Lactitol
- Global Lactitol Market Overview by Geographic Region
- Global Lactitol Market Overview by End-Use Application
PART B: REGIONAL MARKET PERSPECTIVE
- Global Polyols (Sugar Alcohols) Market Overview by Geographic Region
REGIONAL MARKET OVERVIEW
7. NORTH AMERICA
- North American Polyols (Sugar Alcohols) Market Overview by Geographic Region
- North American Polyols (Sugar Alcohols) Market Overview by End-use Application
- North American Polyols (Sugar Alcohols) Market Overview by Product Type
- North American Polyol Type Market Analysis
- Sorbitol
- North American Sorbitol Market Overview by Geographic Region
- North American Sorbitol Market Overview by End-use Application
- Xylitol
- North American Xylitol Market Overview by Geographic Region
- North American Xylitol Market Overview by End-use Application
- Mannitol
- North American Mannitol Market Overview by Geographic Region
- North American Mannitol Market Overview by End-use Application
- Maltitol
- North American Maltitol Market Overview by Geographic Region
- North American Maltitol Market Overview by End-use Application
- Erythritol
- North American Erythritol Market Overview by Geographic Region
- North American Erythritol Market Overview by End-use Application
- Isomalt
- North American Isomalt Market Overview by Geographic Region
- North American Isomalt Market Overview by End-use Application
- Lactitol
- North American Lactitol Market Overview by Geographic Region
- North American Lactitol Market Overview by End-use Application
- Country-wise Analysis of North American Polyols (Sugar Alcohols) Market
- The United States
- United States Polyols (Sugar Alcohols) Market Overview by Product Type
- United States Polyols (Sugar Alcohols) Market Overview by End-use Application
- United States Polyol Type Market Overview by End-Use Application
- Sorbitol
- Xylitol
- Mannitol
- Maltitol
- Erythritol
- Isomalt
- Lactitol
- Canada
- Canadian Polyols (Sugar Alcohols) Market Overview by Product Type
- Canadian Polyols (Sugar Alcohols) Market Overview by End-use Application
- Canadian Polyol Type Market Overview by End-Use Application
- Sorbitol
- Xylitol
- Mannitol
- Maltitol
- Erythritol
- Isomalt
- Lactitol
- Mexico
- Mexican Polyols (Sugar Alcohols) Market Overview by Product Type
- Mexican Polyols (Sugar Alcohols) Market Overview by End-use Application
- Mexican Polyol Type Market Overview by End-Use Application
- Sorbitol
- Xylitol
- Mannitol
- Maltitol
- Erythritol
- Isomalt
- Lactitol
8. EUROPE
- European Polyols (Sugar Alcohols) Market Overview by Geographic Region
- European Polyols (Sugar Alcohols) Market Overview by End-use Application
- European Polyols (Sugar Alcohols) Market Overview by Product Type
- European Polyol Type Market Analysis
- Sorbitol
- European Sorbitol Market Overview by Geographic Region
- European Sorbitol Market Overview by End-use Application
- Xylitol
- European Xylitol Market Overview by Geographic Region
- European Xylitol Market Overview by End-use Application
- Mannitol
- European Mannitol Market Overview by Geographic Region
- European Mannitol Market Overview by End-use Application
- Maltitol
- European Maltitol Market Overview by Geographic Region
- European Maltitol Market Overview by End-use Application
- Erythritol
- European Erythritol Market Overview by Geographic Region
- European Erythritol Market Overview by End-use Application
- Isomalt
- European Isomalt Market Overview by Geographic Region
- European Isomalt Market Overview by End-use Application
- Lactitol
- European Lactitol Market Overview by Geographic Region
- European Lactitol Market Overview by End-use Application
- Country-wise Analysis of European Polyols (Sugar Alcohols) Market
- France
- French Polyols (Sugar Alcohols) Market Overview by Product Type
- French Polyols (Sugar Alcohols) Market Overview by End-use Application
- French Polyol Type Market Overview by End-Use Application
- Sorbitol
- Xylitol
- Mannitol
- Maltitol
- Erythritol
- Isomalt
- Lactitol
- Germany
- German Polyols (Sugar Alcohols) Market Overview by Product Type
- German Polyols (Sugar Alcohols) Market Overview by End-use Application
- German Polyol Type Market Overview by End-Use Application
- Sorbitol
- Xylitol
- Mannitol
- Maltitol
- Erythritol
- Isomalt
- Lactitol
- Italy
- Italian Polyols (Sugar Alcohols) Market Overview by Product Type
- Italian Polyols (Sugar Alcohols) Market Overview by End-use Application
- Italian Polyol Type Market Overview by End-Use Application
- Sorbitol
- Xylitol
- Mannitol
- Maltitol
- Erythritol
- Isomalt
- Lactitol
- Spain
- Spanish Polyols (Sugar Alcohols) Market Overview by Product Type
- Spanish Polyols (Sugar Alcohols) Market Overview by End-use Application
- Spanish Polyol Type Market Overview by End-Use Application
- Sorbitol
- Xylitol
- Mannitol
- Maltitol
- Erythritol
- Isomalt
- Lactitol
- United Kingdom
- United Kingdom Polyols (Sugar Alcohols) Market Overview by Product Type
- United Kingdom Polyols (Sugar Alcohols) Market Overview by End-use Application
- United Kingdom Polyol Type Market Overview by End-Use Application
- Sorbitol
- Xylitol
- Mannitol
- Maltitol
- Erythritol
- Isomalt
- Lactitol
- Russia
- Russian Polyols (Sugar Alcohols) Market Overview by Product Type
- Russian Polyols (Sugar Alcohols) Market Overview by End-use Application
- Russian Polyol Type Market Overview by End-Use Application
- Sorbitol
- Xylitol
- Mannitol
- Maltitol
- Erythritol
- Isomalt
- Lactitol
- Rest of Europe
- Rest of Europe Polyols (Sugar Alcohols) Market Overview by Product Type
- Rest of Europe Polyols (Sugar Alcohols) Market Overview by End-use Application
- Rest of Europe Polyol Type Market Overview by End-Use Application
- Sorbitol
- Xylitol
- Mannitol
- Maltitol
- Erythritol
- Isomalt
- Lactitol
9. ASIA-PACIFIC
- Asia-Pacific Polyols (Sugar Alcohols) Market Overview by Geographic Region
- Asia-Pacific Polyols (Sugar Alcohols) Market Overview by End-Use Application
- Asia-Pacific Polyols (Sugar Alcohols) Market Overview by Product Type
- Asia-Pacific Polyol Type Market Analysis
- Sorbitol
- Asia-Pacific Sorbitol Market Overview by Geographic Region
- Asia-Pacific Sorbitol Market Overview by End-Use Application
- Xylitol
- Asia-Pacific Xylitol Market Overview by Geographic Region
- Asia-Pacific Xylitol Market Overview by End-Use Application
- Mannitol
- Asia-Pacific Mannitol Market Overview by Geographic Region
- Asia-Pacific Mannitol Market Overview by End-Use Application
- Maltitol
- Asia-Pacific Maltitol Market Overview by Geographic Region
- Asia-Pacific Maltitol Market Overview by End-Use Application
- Erythritol
- Asia-Pacific Erythritol Market Overview by Geographic Region
- Asia-Pacific Erythritol Market Overview by End-Use Application
- Isomalt
- Asia-Pacific Isomalt Market Overview by Geographic Region
- Asia-Pacific Isomalt Market Overview by End-Use Application
- Lactitol
- Asia-Pacific Lactitol Market Overview by Geographic Region
- Asia-Pacific Lactitol Market Overview by End-Use Application
- Country-wise Analysis of Asia-Pacific Polyols (Sugar Alcohols) Market
- China
- Chinese Polyols (Sugar Alcohols) Market Overview by Product Type
- Chinese Polyols (Sugar Alcohols) Market Overview by End-Use Application
- Chinese Polyol Type Market Overview by End-Use Application
- Sorbitol
- Xylitol
- Mannitol
- Maltitol
- Erythritol
- Isomalt
- Lactitol
- India
- Indian Polyols (Sugar Alcohols) Market Overview by Product Type
- Indian Polyols (Sugar Alcohols) Market Overview by End-Use Application
- Indian Polyol Type Market Overview by End-Use Application
- Sorbitol
- Xylitol
- Mannitol
- Maltitol
- Erythritol
- Isomalt
- Lactitol
- Japan
- Japanese Polyols (Sugar Alcohols) Market Overview by Product Type
- Japanese Polyols (Sugar Alcohols) Market Overview by End-Use Application
- Japanese Polyol Type Market Overview by End-Use Application
- Sorbitol
- Xylitol
- Mannitol
- Maltitol
- Erythritol
- Isomalt
- Lactitol
- South Korea
- South Korean Polyols (Sugar Alcohols) Market Overview by Product Type
- South Korean Polyols (Sugar Alcohols) Market Overview by End-Use Application
- South Korean Polyol Type Market Overview by End-Use Application
- Sorbitol
- Xylitol
- Mannitol
- Maltitol
- Erythritol
- Isomalt
- Lactitol
- Rest of Asia-Pacific
- Rest of Asia-Pacific Polyols (Sugar Alcohols) Market Overview by Product Type
- Rest of Asia-Pacific Polyols (Sugar Alcohols) Market Overview by End-Use Application
- Rest of Asia-Pacific Polyol Type Market Overview by End-Use Application
- Sorbitol
- Xylitol
- Mannitol
- Maltitol
- Erythritol
- Isomalt
- Lactitol
10. REST OF WORLD
- Rest of World Polyols (Sugar Alcohols) Market Overview by Geographic Region
- Rest of World Polyols (Sugar Alcohols) Market Overview by End-Use Application
- Rest of World Polyols (Sugar Alcohols) Market Overview by Product Type
- Rest of World Polyol Type Market Analysis
- Sorbitol
- Rest of World Sorbitol Market Overview by Geographic Region
- Rest of World Sorbitol Market Overview by End-Use Application
- Xylitol
- Rest of World Xylitol Market Overview by Geographic Region
- Rest of World Xylitol Market Overview by End-Use Application
- Mannitol
- Rest of World Mannitol Market Overview by Geographic Region
- Rest of World Mannitol Market Overview by End-Use Application
- Maltitol
- Rest of World Maltitol Market Overview by Geographic Region
- Rest of World Maltitol Market Overview by End-Use Application
- Erythritol
- Rest of World Erythritol Market Overview by Geographic Region
- Rest of World Erythritol Market Overview by End-Use Application
- Isomalt
- Rest of World Isomalt Market Overview by Geographic Region
- Rest of World Isomalt Market Overview by End-Use Application
- Lactitol
- Rest of World Lactitol Market Overview by End-Use Application
PART C: GUIDE TO THE INDUSTRY
- AMERICAS
- EUROPE
- ASIA-PACIFIC
PART D: ANNEXURE
- RESEARCH METHODOLOGY
- FEEDBACK
Archer Daniels Midland Company
B Food Science Co., Ltd.
Baolingbao Biology Co., Ltd
BENEO GmbH
Cargill, Inc.
DFI Corporation
Dongxiao Biotechnology Co., Ltd
Ecogreen Oleochemicals (Singapore) Pte., Ltd.
Ingredion Incorporated
International Flavors & Fragrances Inc.
Jungbunzlauer S.A.
Mitsubishi Corporation Life Sciences Limited
Ningxia Eppen Biotech Co., Ltd
O'laughlin Industries Co., Ltd.
Roquette Freres S.A.
SAPPI Limited
Shandong Futaste Co., Ltd.
Shandong Longlive Bio-Technology Co., Ltd.
Shandong Sanyuan Biotechnology Co., Ltd
Shandong Tianli Pharmaceutical Co., Ltd.
Tereos Starch & Sweeteners s.a.s. (Tereos Syral)
Zhejiang Huakang Pharmaceutical Co., Ltd.
Zuchem Inc.
RELATED REPORTS
Dairy Products Packaging - A Global Market Overview
Report Code: FNB002 | Pages: 382 | Price: $4050
Published
Jul 2026
Xanthan Gum - A Global Market Overview
Report Code: FNB014 | Pages: 310 | Price: $4500
Published
Jul 2026
Global Seaweed Hydrocolloids Market - Agar, Alginates and Carrageenan
Report Code: FNB021 | Pages: 515 | Price: $4500
Published
Jul 2026
Global Hydrocolloids Market – Raw Materials, Products and Applications
Report Code: FNB024 | Pages: 660 | Price: $4860
Published
Jul 2026