Global Pectin Market Trends and Outlook
Pectin is a naturally derived hydrocolloid sourced mainly from citrus fruit peels and apple pomace, widely used as a gelling, stabilizing, and texturizing ingredient in foods, beverages, pharmaceuticals, and personal care products. The ingredient benefits from strong consumer acceptance due to its natural origin, clean-label positioning, and compatibility with vegan, vegetarian, and plant-based formulations. Increasing utilization of fruit-processing by-products also aligns pectin with circular economy and sustainability goals.
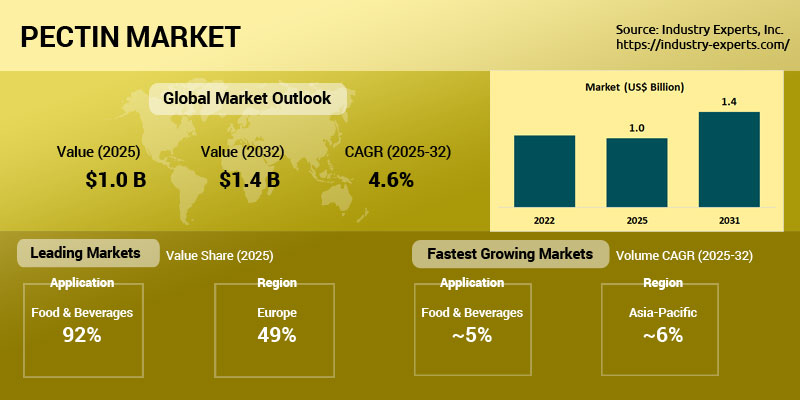
The global pectin market reached US$1.03 billion in 2025, and is projected to grow to 109 thousand metric tons valued at US$1.42 billion by 2032, registering 4.7% CAGR by volume during 2025-2032. Growth is supported by rising demand for reduced-sugar foods, natural stabilizers, functional ingredients, and reformulation activities across processed foods and beverages. Food & Beverages remains the dominant application segment, while Europe leads consumption and Asia-Pacific records the fastest expansion.
Long-term growth opportunities are expected from increasing adoption in plant-based dairy alternatives, functional nutrition, clean beauty products, and pharmaceutical formulations. Expanding demand in Asia, wider use of alternative feedstocks beyond citrus peel, and consumer preference for recognizable ingredients are expected to reshape future competitive dynamics in the global pectin industry. Major participants in the global pectin market include International Flavors & Fragrances (IFF), CP Kelco (Tate & Lyle), Cargill, CEAMSA, DSM-Firmenich, Herbstreith & Fox KG, and Silvateam.
Pectin Regional Market Analysis
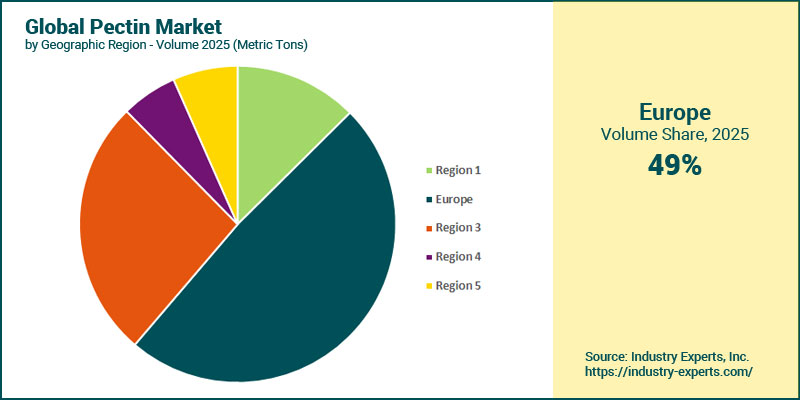
Europe remains the largest regional market for pectin consumption, accounting for 48.7% share in 2025, supported by the region's mature food processing industry, strong clean-label adoption, and established pectin manufacturing base. However, Europe is projected to grow at a moderate 4.2% CAGR during 2025-2032, causing its share to decline slightly to 47% by 2032 despite reaching around 51 thousand metric tons. Asia-Pacific holds the second-largest position and is also the fastest-growing region, and expected to expand at a notable 6.1% CAGR, reaching above 30 thousand metric tons by 2032, driven by increasing demand for processed foods, dairy beverages, and plant-based formulations across China, India, and Southeast Asia.
Pectin Market Analysis by Application
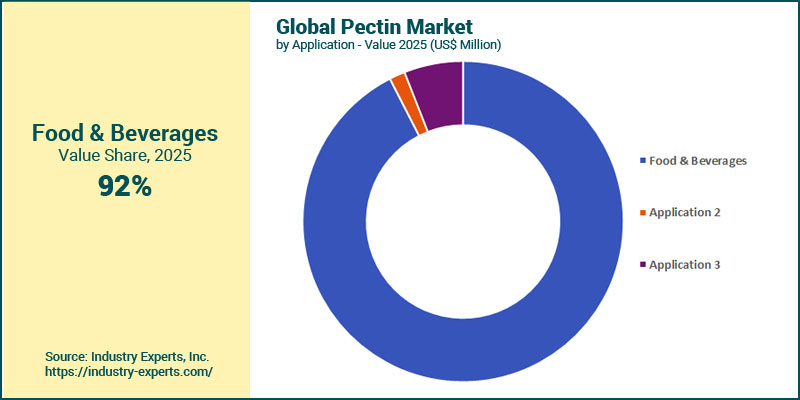
The Food & Beverages segment dominates the global pectin market across both volume and value, accounting for US$954.3 million in 2025, representing 92.5% of total market value, driven by extensive use in jams, dairy products, fruit beverages, confectionery, and clean-label formulations. The segment is also the fastest growing, projected to expand at a 4.7% CAGR by value during 2025-2032, reaching US$1.3 billion by 2032. Pharma & Healthcare ranks distantly second-largest application, with 6% value share, supported by increasing use in supplements and healthcare formulations while growing at 3.8% CAGR.
Pectin Market Analysis by Raw Material Source
Citrus Peel is the dominant raw material source for global pectin production, accounting for 81.3% share in 2025, reflecting its widespread availability from citrus juice processing and strong suitability for commercial pectin extraction. However, the segment is projected to grow at a relatively slower CAGR during 2025-2032. Apple Pomace holds the second-largest position, and is expected to expand at a 5.7% CAGR, supported by rising emphasis on circular economy practices and utilization of fruit processing waste streams. Meanwhile, the Others category (including sugar beet pulp and sunflower residues) is the fastest-growing segment, although from a smaller base, at a notable 12.9% CAGR, indicating growing interest in alternative and sustainable feedstocks for pectin extraction.
Pectin Market Report Scope
This global report on Pectin analyzes the market based on end-use application for the period 2022-2032 with projections from 2025 to 2032 in terms of volume in metric tons and value in US$. In addition to providing profiles of major companies operating in the Pectin industry, the latest corporate, product, production capacity and industrial developments have been covered to offer a clear panorama of Pectin industry.
Key Metrics
| Historical Period: | 2022-2025 | |
| Base Year: | 2025 | |
| Forecast Period: | 2025-2032 | |
| Units: | Volume consumption in metric tons and Value market in US$ | |
| Companies Mentioned: | 20+ |
Global Pectin Market by Geographic Region
- North America (The United States, Canada and Mexico)
- Europe (France, Germany, Italy, The Netherlands, Poland, Russia, Spain, The United Kingdom and Rest of Europe)
- Asia-Pacific (China, India, Indonesia, Japan, South Korea, Malaysia, Thailand and Rest of Asia-Pacific)
- South America (Brazil, Argentina and Rest of South America)
- Rest of World (Saudi Arabia, South Africa, Turkey, Ukraine and Other Rest of World)
Global Pectin Market by Application
- Food & Beverages
- Jams
- Dairy
- Non-dairy Beverages
- Confectionary
- Cosmetics & Personal Care
- Pharma & Healthcare
Global Pectin Market by Raw Material Source
- Citrus Peel
- Apple Pomace
- Others (Sugar Beet Pulp, Sunflower Heads/Stalks etc.)
Pectin Market Frequently Asked Questions (FAQs)
Pectin is a natural hydrocolloid extracted mainly from citrus peels and apple pomace, widely used in jams, dairy products, beverages, confectionery, pharmaceuticals, and cosmetics.
The market reached approximately US$1.03 billion in 2025 and is forecast to exceed US$1.42 billion by 2032.
Food & Beverages dominates, accounting for over 95% of total market volume due to extensive use in processed foods and beverages.
Europe is the largest regional market, while Asia-Pacific is expected to register the fastest growth through 2032.
Major drivers include clean-label trends, sugar reduction, plant-based foods, sustainable sourcing, and rising processed food demand.
Citrus peel remains the leading raw material source, representing more than 80% of total consumption.
Leading companies include IFF, CP Kelco, Cargill, CEAMSA, DSM-Firmenich, Herbstreith & Fox KG, and Silvateam.
PART A: GLOBAL MARKET PERSPECTIVE
1. INTRODUCTION
- Market Drivers, Opportunities and Restraints
- Product Outline
- Introduction to Hydrocolloids
- Types of Hydrocolloids
- Plant Hydrocolloids
- Pectin
- Structure & Properties
- Sources of Pectin
- Production Process
- Types of Pectins
- High Methylated Ester Pectins
- Low Methylated Ester pectins
- Amidated Pectin
- Applications of Pectin
- Food & Beverages
- Pharmaceuticals
- Cosmetics & Personal Care
- Other Applications
- Regulatory Status
2. KEY GLOBAL PLAYERS
- Cargill, Inc
- Compania Espanola de Algas Marinas, S.A. (CEAMSA)
- DSM-Firmenich (Yantai Andre Pectin)
- Herbstreith & Fox KG
- International Flavors & Fragrances Inc. (IFF)
- Silvateam S.p.A.
- Tate & Lyle Plc (CP Kelco)
3. KEY BUSINESS AND PRODUCT TRENDS
4. GLOBAL MARKET OVERVIEW
- Global Pectin Market Overview by End-use Application
- Global Food & Beverages Pectin Market Overview by Sub-segments
- Pectin Application Market Overview by Global Region
- Food & Beverages
- Cosmetics & Personal Care
- Pharmaceutical & Healthcare
PART B: REGIONAL MARKET PERSPECTIVE
- Global Pectin Market Overview by Geographic Region
REGIONAL MARKET OVERVIEW
5. NORTH AMERICA
- North American Pectin Market Overview by Geographic Region
- North American Pectin Market Overview by End-use Application
- Country-wise Analysis of North American Pectin Market
- The United States
- United States Pectin Market Overview by End-use Application
- Canada
- Canadian Pectin Market Overview by End-use Application
- Mexico
- Mexican Pectin Market Overview by End-use Application
6. EUROPE
- European Pectin Market Overview by Geographic Region
- European Pectin Market Overview by End-use Application
- Country-wise Analysis of European Pectin Market
- France
- French Pectin Market Overview by End-use Application
- Germany
- German Pectin Market Overview by End-use Application
- Italy
- Italian Pectin Market Overview by End-use Application
- The Netherlands
- Netherlands Pectin Market Overview by End-use Application
- Poland
- Polish Pectin Market Overview by End-use Application
- Russia
- Russian Pectin Market Overview by End-use Application
- Spain
- Spanish Pectin Market Overview by End-use Application
- The United Kingdom
- United Kingdom Pectin Market Overview by End-use Application
- Rest of Europe
- Rest of European Pectin Market Overview by End-use Application
7. ASIA-PACIFIC
- Asia-Pacific Pectin Market Overview by Geographic Region
- Asia-Pacific Pectin Market Overview by End-use Application
- Country-wise Analysis of Asia-Pacific Pectin Market
- China
- Chinese Pectin Market Overview by End-use Application
- India
- Indian Pectin Market Overview by End-use Application
- Indonesia
- Indonesia Pectin Market Overview by End-use Application
- Japan
- Japanese Pectin Market Overview by End-use Application
- South Korea
- South Korean Pectin Market Overview by End-use Application
- Malaysia
- Malaysian Pectin Market Overview by End-use Application
- Thailand
- Thailand Pectin Market Overview by End-use Application
- Rest of Asia-Pacific
- Rest of Asia-Pacific Pectin Market Overview by End-use Application
8. SOUTH AMERICA
- South American Pectin Market Overview by Geographic Region
- South American Pectin Market Overview by End-use Application
- Country-wise Analysis of South American Pectin Market
- Brazil
- Brazilian Pectin Market Overview by End-use Application
- Argentina
- Argentine Pectin Market Overview by End-use Application
- Rest of South America
- Rest of South American Pectin Market Overview by End-use Application
9. REST OF WORLD
- Rest of World Pectin Market Overview by Geographic Region
- Rest of World Pectin Market Overview by End-use Application
- Country-wise Analysis of Rest of World Pectin Market
- Saudi Arabia
- Saudi Arabian Pectin Market Overview by End-use Application
- South Africa
- South African Pectin Market Overview by End-use Application
- Turkey
- Turkish Pectin Market Overview by End-use Application
- Ukraine
- Ukrainian Pectin Market Overview by End-use Application
- Other Rest of World
- Other Rest of World Pectin Market Overview by End-use Application
PART C: GUIDE TO THE INDUSTRY
PART D: ANNEXURE
- RESEARCH METHODOLOGY
- FEEDBACK
Cargill, Inc
Compania Espanola de Algas Marinas, S.A. (CEAMSA)
DSM-Firmenich (Yantai Andre Pectin)
Herbstreith & Fox KG
International Flavors & Fragrances Inc. (IFF)
Silvateam S.p.A.
Tate & Lyle Plc (CP Kelco)
RELATED REPORTS
Dairy Products Packaging - A Global Market Overview
Report Code: FNB002 | Pages: 382 | Price: $4050
Published
Jul 2026
Xanthan Gum - A Global Market Overview
Report Code: FNB014 | Pages: 310 | Price: $4500
Published
Jul 2026
Global Seaweed Hydrocolloids Market - Agar, Alginates and Carrageenan
Report Code: FNB021 | Pages: 515 | Price: $4500
Published
Jul 2026
Global Hydrocolloids Market – Raw Materials, Products and Applications
Report Code: FNB024 | Pages: 660 | Price: $4860
Published
Jul 2026