Published Date: Mar 2019
Report Code: FB027
Pages: 406
Charts: 383
Report Synopsis
Asia-Pacific’s hydrocolloids demand is mainly driven by increasing demand from food & beverages, pharmaceuticals and oil & gas sectors. Increasing health consciousness, changing eating habits of consumers and growing working population in developing countries of Asia-Pacific region is anticipated to increase demand for convenience and processed food. Moreover, food additives are becoming a necessary part of food and beverages industry and natural clean label food additives such as hydrocolloids penetration is on the rise.
China is the largest market for hydrocolloids in Asia-Pacific, estimated at 328 thousand metric tons in 2018, which is also likely to post the fastest 2018-2024 CAGR of 5.6% in reaching a projected 456 thousand metric tons by 2024. The market for hydrocolloids in Asia-Pacific is expected to touch US$4.1 billion in 2019.
Research Findings & Coverage
- Asia-Pacific market for Hydrocolloids is analyzed in this report with respect to raw material sources, product types and end-use applications
- The study exclusively analyzes the market size for hydrocolloid raw material source by product type and end-use application in overall Asia-Pacific region. The report also analyzes the market for hydrocolloids by raw material source, product type and application in all major Asia-Pacific countries
- Mixed Opportunities for Seaweed Hydrocolloids
- Demand for Hydrocolloids Propelled by Trends in Fat and Sugar Reduction
- Restrained Demand for Select Hydrocolloids Due to Tighter Raw Material Supply in the Offing
- Key business trends focusing on product innovations/developments, M&As, JVs and other recent industry developments
- Major companies profiled – 140
- The industry guide includes the contact details for 258 companies
Product Outline
The following Hydrocolloid raw material sources are analyzed in this report:
- Animal-derived (Gelatin)
- Microbial-fermented
- Plant-derived
- Seaweed-derived
- Cellulose-based
The report analyzes the following key product types of Hydrocolloids:
- Gelatin
- Xanthan Gum
- Gellan Gum
- Guar Gum
- Gum Arabic
- LBG
- Tara Gum
- Pectin
- Agar-Agar
- Alginates
- Carrageenan
- CMC
- MC & HPMC
- MCC
The study explores the following major applications of Hydrocolloids:
- Animal Feed
- Food & Beverages
- Cosmetics & Personal Care
- Pharma & Healthcare
- Oil & Gas
- Industrial/Technical
Analysis Period, Units and Growth Rates
- The report reviews, analyzes and projects the Asia-Pacific market for Hydrocolloids for the period 2015-2024 in terms of volume in Metric Tons and value in US$ and the compound annual growth rates (CAGRs) projected from 2018 through 2024
Geographic Coverage
- China
- India
- Indonesia
- Japan
- South Korea
- Malaysia
- Thailand
- Rest of Asia-Pacific
1. INTRODUCTION
1.1 Product Outline
1.1.1 Hydrocolloids
1.1.1.1 Types of Hydrocolloids
1.1.1.1.1 Animal-derived Hydrocolloids
1.1.1.1.1.1 Gelatin
1.1.1.1.1.1.1 Applications
1.1.1.1.1.2 Casein/Caseinates
1.1.1.1.1.3 Chitin and Chitosan
1.1.1.1.2 Cellulose-derived Hydrocolloids
1.1.1.1.2.1 Carboxymethyl Cellulose (CMC)
1.1.1.1.2.1.1 Applications
1.1.1.1.2.2 Methyl Cellulose (MC) and Hydroxypropylmethyl Cellulose (HPMC)
1.1.1.1.2.2.1 Applications
1.1.1.1.2.3 Microcrystalline Cellulose (MCC)
1.1.1.1.2.3.1 Applications
1.1.1.1.2.4 Other Cellulose Ethers
1.1.1.1.3 Microbial-fermented Hydrocolloids
1.1.1.1.3.1 Xanthan Gum
1.1.1.1.3.1.1 Applications
1.1.1.1.3.2 Gellan Gum
1.1.1.1.3.2.1 Applications
1.1.1.1.3.3 Dextran
1.1.1.1.3.4 Curdlan
1.1.1.1.3.5 Pullulan
1.1.1.1.4 Plant-derived Hydrocolloids
1.1.1.1.4.1 Exudate Gums
1.1.1.1.4.1.1 Gum Arabic (Acacia Gum)
Applications
1.1.1.1.4.1.2 Gum Tragacanth
1.1.1.1.4.1.3 Karaya Gum
1.1.1.1.4.1.4 Gum Ghatti
1.1.1.1.4.2 Seed Extracts
1.1.1.1.4.2.1 Guar Gum
Applications
1.1.1.1.4.2.2 Locust Bean Gum (LBG)
Applications
1.1.1.1.4.2.3 Cassia gum
1.1.1.1.4.2.4 Tara Gum
Applications
1.1.1.1.4.2.5 Other Seed Extracts
1.1.1.1.4.3 Pectins
1.1.1.1.4.3.1 Types of Pectins
High Methylated Ester Pectins
Low Methylated Ester pectins
Amidated Pectin
1.1.1.1.4.3.2 Applications
1.1.1.1.5 Seaweed-derived Hydrocolloids
1.1.1.1.5.1 Types of Seaweed-derived Hydrocolloids
1.1.1.1.5.1.1 Agar-Agar
Applications
1.1.1.1.5.1.2 Alginates
Applications
1.1.1.1.5.1.3 Carrageenans
Applications
2. KEY MARKET TRENDS
2.1 Demand for Hydrocolloids in Food & Beverages Being Driven by Clean Label and Non-GMO Trends
2.2 Hydrocolloids Offer Potential for Making Edible Coatings and Films
2.3 Growth in Low-pH Dairy Beverages to Drive Pectin Demand
2.4 Mixed Opportunities for Seaweed Hydrocolloids
2.5 Restrained Demand for Select Hydrocolloids Due to Tighter Raw Material Supply in the Offing
2.6 Demand for Hydrocolloids Propelled by Trends in Fat and Sugar Reduction
2.7 Xanthan Gum’s Potential in the Oil & Gas Sector on an Upswing
2.8 Gelatin’s Application in Food & Beverages being Hindered by Alternatives
2.9 Capsule Production with Plant-Derived HPMC Gaining Ground
2.10 Demand for Hydrocolloids to be Bolstered by Firm Growth in Oil Drilling Activities
3. KEY MARKET PLAYERS
Abdullahbhai Abdul Kader Group (India)
Accel Carrageenan Corporation (formerly RICO Philippines) (Philippines)
Accent Microcell Pvt. Ltd. (India)
Agro Gums (India)
Altrafine Gums (India)
Amar Cellulose Industries (India)
Andi-Johnson Group (China)
Anqiu Eagle Cellulose Co., Ltd (China)
Asahi Gelatine Industrial Co., Ltd. (Japan)
Asahi Kasei Corporation (Japan)
Baotou Dongbao Bio-Tech Co., Ltd. (China)
Cargill, Inc. (United States)
Cellulose Solutions Private Limited (India)
Changshu Wealthy Science and Technology Co., Ltd. (China)
Compania Espanola De Algas Marinas, S.A. (CEAMSA) (Spain)
CP Kelco U.S., Inc. (United States)
Daicel FineChem Ltd. (Japan)
Daiichi-Kasei Co., Ltd. (Japan)
Dancheng CAIXIN Sugar Industry Co., Ltd. (China)
Devson Impex Private Limited (India)
DFE Pharma India LLP (India)
Dipti Cellulose Pvt. Ltd. (India)
DKS Co. Ltd. (Japan)
Drytech Processes (I) Pvt. Ltd. (India)
DSM Hydrocolloids (China)
Yantai Andre Pectin Co., Ltd. (China)
DSM Zhongken Biotechnology Co., Ltd. (China)
DSM Rainbow (Inner Mongolia) Biotechnology Co., Ltd. (China)
Dupont Nutrition & Health (Denmark)
Fufeng Group Limited (China)
Fujian Global Ocean Biotechnology Co., Ltd. (China)
Gelita AG (Germany)
Geltech Co., Ltd. (South Korea)
Godavari Biorefineries Ltd. (India)
Guangrao Liuhe Chemical Co., Ltd. (China)
Haji Dossa Nutralgum (Pvt) Ltd. (Pakistan)
Hangzhou Gellan Solutions Biotec Co., Ltd. (China)
Hebei Xinhe Biochemical Co., Ltd (China)
Hindustan Gum & Chemicals Ltd. (India)
Ina Food Industry Co., Ltd. (Japan)
India Gelatine & Chemicals Ltd (India)
India Glycols Limited (India)
Indian Hydrocolloids (IHC) (India)
Inter Chemical (Shijiazhuang) Co., Ltd. (China)
IRO Alginate Industry Co., Ltd. (China)
Jai Bharat Gum & Chemicals Ltd (India)
Java Biocolloid (Indonesia)
Jellice Corporation (Japan)
JianLong Biotechnology Co., LTD. (China)
Kantilal Brothers (India)
Kapadia Gum Industries Pvt. Ltd. (India)
Karagen Indonesia, CV (Indonesia)
KIMICA Corporation (Japan)
Koei Chemical Co., Ltd. (Japan)
Krishna Pectins Pvt. Ltd. (India)
Lamberti Hydrocolloids Private Ltd (India)
Lianyungang Zhongda Seaweed Industrial Co., Ltd. (China)
Lotus Gums & Chemicals (India)
Lucid Colloids Ltd. (India)
Madhu Hydrocolloids Pvt. Ltd. (India)
Marcel Trading Corporation (Philippines)
Marine Science Co., Ltd. (Japan)
MC Food Specialties Inc. (Japan)
MCPI Corporation (Philippines)
MeiHua Holdings Group Co., Ltd (China)
Meron Group (India)
Mingtai Chemical Co., Ltd. (Taiwan)
MSC Co., Ltd. (South Korea)
Nanjing Laienda Biotechnology Co., Ltd. (Lauta) (China)
Narmada Gelatines Ltd. (India)
NB Entrepreneurs (India)
Neelkanth Polymers (India)
New Zealand Seaweeds Limited (New Zealand)
Nippi, Inc. (Japan)
Nippon Paper Industries Co., Ltd. (Japan)
Nitta Gelatin Inc. (Japan)
Nouryon (Netherlands)
OPAL Biotech Ltd. (China)
Patel Industries (India)
PB Leiner (Belgium)
Philippine Bio Industries, Inc. (Philippines)
Prasmo Agri (India)
Premcem Gums Pvt. Ltd (India)
PT. Agar Swallow (Indonesia)
PT. Agarindo Bogatama (Indonesia)
PT. Algalindo Perdana (Indonesia)
PT. Amarta Carrageenan Indonesia (Indonesia)
PT. Arbe Chemindo (Indonesia)
PT. Cahaya Cemerlang (Indonesia)
PT. Dunia Bintang Walet (Indonesia)
PT. Galic Artabahari (Indonesia)
PT. Gumindo Perkasa Industri (Indogum) (Indonesia)
PT. Hydrocolloid Indonesia (Indonesia)
PT. Indo Seaweed (Indonesia)
PT. Indoking Aneka Agar-Agar Industri (Indonesia)
PT. Kappa Carrageenan Nusantara (Indonesia)
PT. Surya Indoalgas (Indonesia)
PT. Wahyu Putra Bimasakti (Indonesia)
Puning Huey Shyang Seaweed Industrial Co., Ltd. (China)
Qingdao Bright Moon Seaweed Group Co., Ltd. (China)
Qingdao Fengrun Seaweed Co., Ltd. (China)
Qingdao Gather Great Ocean Algae Industry Group (China)
Qingdao Great Chemical Inc. (China)
Qingdao Hyzlin Biology Development Co., Ltd. (China)
Qingdao Unichem International Trade Co., Ltd. (China)
Qingdao Zoranoc Oilfield Chemical Co., Ltd. (China)
Quzhou Pectin Co., Ltd. (China)
Rama Gum Industries (India) Ltd (India)
Rousselot BV (Netherlands)
Sammi Industry Co., Ltd. (South Korea)
Shandong Head Co., Ltd. (China)
Shandong Jiejing Group Corporation (China)
Shanghai Brilliant Gum Co., Ltd. (BLG) (China)
Shanghai ShenGuang Edible Chemicals Co., Ltd. (China)
Shemberg Corporation (Philippines)
Shin-Etsu Chemical Co., Ltd. (Japan)
Shree Ram Gum and Chemicals (India)
Shubhlaxmi Industries (India)
Sichuan Longrun-Newstar Group Co., Ltd. (China)
Sidley Chemical Co., Ltd. (China)
Sigachi Industries Pvt. Ltd. (India)
SNAP Natural & Alginate Products Pvt. Ltd. (India)
Solvay SA (Belgium)
SOMAR Corporation (Japan)
Sterling Gelatin (India)
Sunita Hydrocolloids Private Limited (India)
Supreme Gums Pvt. Ltd. (India)
Tacara Sdn Bhd (Malaysia)
TBK Manufacturing Corporation (Philippines)
The Dow Chemical Company (United States)
Urakami Kasei Limited (Japan)
Vasundhara Industries (India)
Vikas WSP Limited (India)
W Hydrocolloids, Inc. (RICO Carrageenan) (Philippines)
Xiamen Gelken Gelatin Co., Ltd. (China)
Xuzhou Liyuan Cellulose Technology Co. Ltd. (China)
Yantai Sheli Hydrocolloids Co., Ltd. (China)
Yantai Xinwang Seaweed Co., Ltd. (China)
Yasu Chemical Inc. (Japan)
Yixing Tongda Chemical Co., Ltd. (China)
Zhejiang Chuangfeng Chemical Co., Ltd. (China)
Zhenpai Hydrocolloids Co., Ltd. (China)
Zibo Zhongxuan Biochemical Co., Ltd. (Deosen Biochemical Co., Ltd.) (China)
4. KEY BUSINESS AND PRODUCT TRENDS
DSM to Purchase an Additional 46% Stake in Andre Pectin
CP Kelco's Carboxymethyl Cellulose Plant for Sale in China
Launch of New Brand Identities for DSM's Gellan Gum and Xanthan Gum
Solvay's Hydrocolloid Product Line Acquired by PMC Group International
CP Kelco’s GENU® Pectin Products Receive Non-GMO Project Verification
Accent Microcell Private Limited is EXCiPACT Certified
Expansion of Dow's Methyl Cellulose Capacity in Germany
CP Kelco Launches Label-Friendly GENU® Explorer Pectin ND-200 for Neutral Desserts
NOP Organic Certification for Java Biocolloid's Seaweed GracilariaVerrucosa Extracts
PB Leiner is the New Company Brand Name of PB Gelatins/PB Leiner
Joint Venture Formed by Alland& Robert and Sayaji for Spray Dried Acacia Gum Production
Nouryon is the New Name for AkzoNobel Specialty Chemicals
CP Kelco's 30 CEKOL® Cellulose Gum products Verified by Non-GMO Project
Jellice Pioneer Expands the Most Modern Gelatin Factory in Europe
DuPont™ Danisco® Lactogel® FC 5200 Recognized by Fi South America Innovation Awards
ADM Opens New Technical Innovation Centre, Regional Office in Shanghai
Cargill Plans to Construct $150 million HM Pectin Plant in Brazil
DSM Hydrocolloids Opens DSM Zhongken Biotechnology to Broaden Biogum Innovation Capability
AkzoNobel and Renmatix Partner to Create a New Form of Crystalline Cellulose
Cargill Partners with BioHope and Sanrise China for the Cosmetics Ingredients Distribution in China
Cargill Expands its Seabrid™ Portfolio of Carrageenans for Creamy Dairy Desserts
Mitsubishi Corporation Consolidates its Life Sciences Business
Marcel Trading Corporation Acquired CP Kelco’s Philippines Carrageenan Plant
DuPont Nutrition & Health Divests Alginates Business to JRS Group
Rousselot Launches X-Pure® Medical Grade Gelatin Range for In-Body Usage
CP Kelco’s Xanthan Gum Products Receives Non-GMO Project Verification
CP Kelco to Enter Indonesian Distribution Partnership with Azelis
Non-GMO Project Verification for CP Kelco's Four New KELCOGEL® Gellan Gum Products
PT. Azelis Indonesia Distribusi Selected as CP Kelco's Exclusive Distributor in Indonesia
DRG Gelatin, Nitta Gelatin's New Pharmaceutical Gelatin
DuPont Nutrition & Health Launches Pectin for Reduced Sugar Fruit Spreads
Java Biocolloid Establishes an Operative Branch in Trieste
DSM and Haixing to Acquire Inner Mongolia Rainbow Biotechnology
DowDuPont Completes FMC Corporation’s Health & Nutrition Business Acquisition
Shin-Etsu Chemical Invests to Strengthen its Cellulose Derivatives Business
AkzoNobel Increases EHEC Cellulosic Ethers Production
SE Tylose Starts New Technical Centre at the Science Park II in Singapore
Successful Completion of the Merger between Dow and DuPont
Cargill Introduced New Seabrid™ Carrageenans for Gelled Dairy Desserts
CP Kelco's KELCOGEL® Gellan Gum Production Capacity Increased to Meet the Growing Market Demand
Cargill’s Alginates Business is Acquired by Algaia
Inauguration of Ashland's New Pharmaceutical Excipient Manufacturing Unit in China
Introduction of DuPont's New Range of GRINDSTED® JU Systems for the South Asia Market
W Hydrocolloids Acquired Kerry Group’s Seaweed Processing Facility in Philippines
Samsung Group's Chemical Businesses Acquired by Lotte Chemical Group
5. GLANCE AT GLOBAL HYDROCOLLOIDS MARKET
5.1 Global Hydrocolloids Market Overview by Geographic Region
6. ASIA-PACIFIC MARKET OVERVIEW
6.1 Asia-Pacific Hydrocolloids Market Overview by Geographic Region
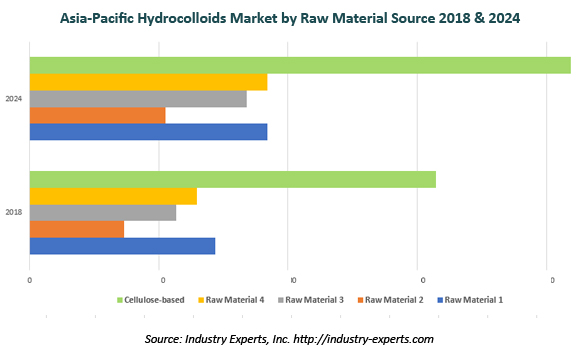
6.2 Asia-Pacific Hydrocolloids Market Overview by Raw Material Source
6.3 Asia-Pacific Hydrocolloids Market Overview by End-use Application
6.4 Country-wise Analysis of Asia-Pacific Hydrocolloids Market
6.4.1 CHINA
6.4.1.1 Chinese Hydrocolloids Market Overview by End-use Application
6.4.1.2 Chinese Hydrocolloids Market Overview by Raw Material Source
6.4.1.2.1 Animal-derived Hydrocolloid (Gelatin)
6.4.1.2.1.1 Chinese Gelatin Market Overview by End-use Application
6.4.1.2.2 Microbial-fermented Hydrocolloids
6.4.1.2.2.1 Chinese Microbial-fermented Hydrocolloids Market Overview by Product Type
6.4.1.2.2.2 Chinese Microbial-fermented Hydrocolloids Market Overview by End-use Application
6.4.1.2.3 Plant-derived Hydrocolloids
6.4.1.2.3.1 Chinese Plant-derived Hydrocolloids Market Overview by Product Type
6.4.1.2.3.2 Chinese Plant-derived Hydrocolloids Market Overview by End-use Application
6.4.1.2.4 Seaweed-derived Hydrocolloids
6.4.1.2.4.1 Chinese Seaweed Hydrocolloids Market Overview by Product Type
6.4.1.2.4.2 Chinese Seaweed Hydrocolloids Market Overview by End-use Application
6.4.1.2.5 Cellulose-based Hydrocolloids
6.4.1.2.5.1 Chinese Cellulose-based Hydrocolloids Market Overview by Product Type
6.4.1.2.5.2 Chinese Cellulose-based Hydrocolloids Market Overview by End-use Application
6.4.2 INDIA
6.4.2.1 Indian Hydrocolloids Market Overview by End-use Application
6.4.2.2 Indian Hydrocolloids Market Overview by Raw Material Source
6.4.2.2.1 Animal-derived Hydrocolloid (Gelatin)
6.4.2.2.1.1 Indian Gelatin Market Overview by End-use Application
6.4.2.2.2 Microbial-fermented Hydrocolloids
6.4.2.2.2.1 Indian Microbial-fermented Hydrocolloids Market Overview by Product Type
6.4.2.2.2.2 Indian Microbial-fermented Hydrocolloids Market Overview by End-use Application
6.4.2.2.3 Plant-derived Hydrocolloids
6.4.2.2.3.1 Indian Plant-derived Hydrocolloids Market Overview by Product Type
6.4.2.2.3.2 Indian Plant-derived Hydrocolloids Market Overview by End-use Application
6.4.2.2.4 Seaweed-derived Hydrocolloids
6.4.2.2.4.1 Indian Seaweed Hydrocolloids Market Overview by Product Type
6.4.2.2.4.2 Indian Seaweed Hydrocolloids Market Overview by End-use Application
6.4.2.2.5 Cellulose-based Hydrocolloids
6.4.2.2.5.1 Indian Cellulose-based Hydrocolloids Market Overview by Product Type
6.4.2.2.5.2 Indian Cellulose-based Hydrocolloids Market Overview by End-use Application
6.4.3 INDONESIA
6.4.3.1 Indonesian Hydrocolloids Market Overview by End-use Application
6.4.3.2 Indonesian Hydrocolloids Market Overview by Raw Material Source
6.4.3.2.1 Animal-derived Hydrocolloid (Gelatin)
6.4.3.2.1.1 Indonesian Gelatin Market Overview by End-use Application
6.4.3.2.2 Microbial-fermented Hydrocolloids
6.4.3.2.2.1 Indonesian Microbial-fermented Hydrocolloids Market Overview by Product Type
6.4.3.2.2.2 Indonesian Microbial-fermented Hydrocolloids Market Overview by End-use Application
6.4.3.2.3 Plant-derived Hydrocolloids
6.4.3.2.3.1 Indonesian Plant-derived Hydrocolloids Market Overview by Product Type
6.4.3.2.3.2 Indonesian Plant-derived Hydrocolloids Market Overview by End-use Application
6.4.3.2.4 Seaweed-derived Hydrocolloids
6.4.3.2.4.1 Indonesian Seaweed Hydrocolloids Market Overview by Product Type
6.4.3.2.4.2 Indonesian Seaweed Hydrocolloids Market Overview by End-use Application
6.4.3.2.5 Cellulose-based Hydrocolloids
6.4.3.2.5.1 Indonesian Cellulose-based Hydrocolloids Market Overview by Product Type
6.4.3.2.5.2 Indonesian Cellulose-based Hydrocolloids Market Overview by End-use Application
6.4.4 JAPAN
6.4.4.1 Japanese Hydrocolloids Market Overview by End-use Application
6.4.4.2 Japanese Hydrocolloids Market Overview by Raw Material Source
6.4.4.2.1 Animal-derived Hydrocolloid (Gelatin)
6.4.4.2.1.1 Japanese Gelatin Market Overview by End-use Application
6.4.4.2.2 Microbial-fermented Hydrocolloids
6.4.4.2.2.1 Japanese Microbial-fermented Hydrocolloids Market Overview by Product Type
6.4.4.2.2.2 Japanese Microbial-fermented Hydrocolloids Market Overview by End-use Application
6.4.4.2.3 Plant-derived Hydrocolloids
6.4.4.2.3.1 Japanese Plant-derived Hydrocolloids Market Overview by Product Type
6.4.4.2.3.2 Japanese Plant-derived Hydrocolloids Market Overview by End-use Application
6.4.4.2.4 Seaweed-derived Hydrocolloids
6.4.4.2.4.1 Japanese Seaweed Hydrocolloids Market Overview by Product Type
6.4.4.2.4.2 Japanese Seaweed Hydrocolloids Market Overview by End-use Application
6.4.4.2.5 Cellulose-based Hydrocolloids
6.4.4.2.5.1 Japanese Cellulose-based Hydrocolloids Market Overview by Product Type
6.4.4.2.5.2 Japanese Cellulose-based Hydrocolloids Market Overview by End-use Application
6.4.5 SOUTH KOREA
6.4.5.1 South Korean Hydrocolloids Market Overview by End-use Application
6.4.5.2 South Korean Hydrocolloids Market Overview by Raw Material Source
6.4.5.2.1 Animal-derived Hydrocolloid (Gelatin)
6.4.5.2.1.1 South Korean Gelatin Market Overview by End-use Application
6.4.5.2.2 Microbial-fermented Hydrocolloids
6.4.5.2.2.1 South Korean Microbial-fermented Hydrocolloids Market Overview by Product Type
6.4.5.2.2.2 South Korean Microbial-fermented Hydrocolloids Market Overview by End-use Application
6.4.5.2.3 Plant-derived Hydrocolloids
6.4.5.2.3.1 South Korean Plant-derived Hydrocolloids Market Overview by Product Type
6.4.5.2.3.2 South Korean Plant-derived Hydrocolloids Market Overview by End-use Application
6.4.5.2.4 Seaweed-derived Hydrocolloids
6.4.5.2.4.1 South Korean Seaweed Hydrocolloids Market Overview by Product Type
6.4.5.2.4.2 South Korean Seaweed Hydrocolloids Market Overview by End-use Application
6.4.5.2.5 Cellulose-based Hydrocolloids
6.4.5.2.5.1 South Korean Cellulose-based Hydrocolloids Market Overview by Product Type
6.4.5.2.5.2 South Korean Cellulose-based Hydrocolloids Market Overview by End-use Application
6.4.6 MALAYSIA
6.4.6.1 Malaysian Hydrocolloids Market Overview by End-use Application
6.4.6.2 Malaysian Hydrocolloids Market Overview by Raw Material Source
6.4.6.2.1 Animal-derived Hydrocolloid (Gelatin)
6.4.6.2.1.1 Malaysian Gelatin Market Overview by End-use Application
6.4.6.2.2 Microbial-fermented Hydrocolloids
6.4.6.2.2.1 Malaysian Microbial-fermented Hydrocolloids Market Overview by Product Type
6.4.6.2.2.2 Malaysian Microbial-fermented Hydrocolloids Market Overview by End-use Application
6.4.6.2.3 Plant-derived Hydrocolloids
6.4.6.2.3.1 Malaysian Plant-derived Hydrocolloids Market Overview by Product Type
6.4.6.2.3.2 Malaysian Plant-derived Hydrocolloids Market Overview by End-use Application
6.4.6.2.4 Seaweed-derived Hydrocolloids
6.4.6.2.4.1 Malaysian Seaweed Hydrocolloids Market Overview by Product Type
6.4.6.2.4.2 Malaysian Seaweed Hydrocolloids Market Overview by End-use Application
6.4.6.2.5 Cellulose-based Hydrocolloids
6.4.6.2.5.1 Malaysian Cellulose-based Hydrocolloids Market Overview by Product Type
6.4.6.2.5.2 Malaysian Cellulose-based Hydrocolloids Market Overview by End-use Application
6.4.7 THAILAND
6.4.7.1 Thailand Hydrocolloids Market Overview by End-use Application
6.4.7.2 Thailand Hydrocolloids Market Overview by Raw Material Source
6.4.7.2.1 Animal-derived Hydrocolloid (Gelatin)
6.4.7.2.1.1 Thailand Gelatin Market Overview by End-use Application
6.4.7.2.2 Microbial-fermented Hydrocolloids
6.4.7.2.2.1 Thailand Microbial-fermented Hydrocolloids Market Overview by Product Type
6.4.7.2.2.2 Thailand Microbial-fermented Hydrocolloids Market Overview by End-use Application
6.4.7.2.3 Plant-derived Hydrocolloids
6.4.7.2.3.1 Thailand Plant-derived Hydrocolloids Market Overview by Product Type
6.4.7.2.3.2 Thailand Plant-derived Hydrocolloids Market Overview by End-use Application
6.4.7.2.4 Seaweed-derived Hydrocolloids
6.4.7.2.4.1 Thailand Seaweed Hydrocolloids Market Overview by Product Type
6.4.7.2.4.2 Thailand Seaweed Hydrocolloids Market Overview by End-use Application
6.4.7.2.5 Cellulose-based Hydrocolloids
6.4.7.2.5.1 Thailand Cellulose-based Hydrocolloids Market Overview by Product Type
6.4.7.2.5.2 Thailand Cellulose-based Hydrocolloids Market Overview by End-use Application
6.4.8 REST OF ASIA-PACIFIC
6.4.8.1 Rest of Asia-Pacific Hydrocolloids Market Overview by End-use Application
6.4.8.2 Rest of Asia-Pacific Hydrocolloids Market Overview by Raw Material Source
6.4.8.2.1 Animal-derived Hydrocolloid (Gelatin)
6.4.8.2.1.1 Rest of Asia-Pacific Gelatin Market Overview by End-use Application
6.4.8.2.2 Microbial-fermented Hydrocolloids
6.4.8.2.2.1 Rest of Asia-Pacific Microbial-fermented Hydrocolloids Market Overview by Product Type
6.4.8.2.2.2 Rest of Asia-Pacific Microbial-fermented Hydrocolloids Market Overview by End-use Application
6.4.8.2.3 Plant-derived Hydrocolloids
6.4.8.2.3.1 Rest of Asia-Pacific Plant-derived Hydrocolloids Market Overview by Product Type
6.4.8.2.3.2 Rest of Asia-Pacific Plant-derived Hydrocolloids Market Overview by End-use Application
6.4.8.2.4 Seaweed-derived Hydrocolloids
6.4.8.2.4.1 Rest of Asia-Pacific Seaweed Hydrocolloids Market Overview by Product Type
6.4.8.2.4.2 Rest of Asia-Pacific Seaweed Hydrocolloids Market Overview by End-use Application
6.4.8.2.5 Cellulose-based Hydrocolloids
6.4.8.2.5.1 Rest of Asia-Pacific Cellulose-based Hydrocolloids Market Overview by Product Type
6.4.8.2.5.2 Rest of Asia-Pacific Cellulose-based Hydrocolloids Market Overview by End-use Application
7. GUIDE TO THE INDUSTRY
8. ANNEXURE
8.1 RESEARCH METHODOLOGY
8.2 FEEDBACK
Charts & Graphs
Chart 1: Asia-Pacific Hydrocolloids Market 2015, 2018 and 2024
Chart 2: Asia-Pacific Hydrocolloids Market (2018 & 2024) by Raw Material Source
Chart 3: Asia-Pacific Hydrocolloids Market (2018 & 2024) by Product Type
Chart 4: Asia-Pacific Hydrocolloids Market (2018 & 2024) by End-use Application
Chart 5: Asia-Pacific Hydrocolloids Market (2018 & 2024) by Geographic Region
Chart 6: Global Hydrocolloids Market Analysis (2015-2024) by Volume in Metric Tons and Value in USD Million
Chart 7: Global Hydrocolloids Market Analysis (2015-2024) by Geographic Region – North America, Europe, Asia-Pacific, South America and Rest of World in Metric Tons
Chart 8: Glance at 2015, 2018 and 2024 Global Hydrocolloids Volume Market Share (%) by Geographic Region – North America, Europe, Asia-Pacific, South America and Rest of World
Chart 9: Global Hydrocolloids Market Analysis (2015-2024) by Geographic Region – North America, Europe, Asia-Pacific, South America and Rest of World in USD Million
Chart 10: Glance at 2015, 2018 and 2024 Global Hydrocolloids Value Market Share (%) by Geographic Region – North America, Europe, Asia-Pacific, South America and Rest of World
Chart 11: Asia-Pacific Hydrocolloids Market Analysis (2015-2024) by Volume in Metric Tons and Value in USD Million
Chart 12: Asia-Pacific Hydrocolloids Market Analysis (2015-2024) by Geographic Region – China, India, Indonesia, Japan, South Korea, Malaysia, Thailand and Rest of Asia-Pacific in Metric Tons
Chart 13: Glance at 2015, 2018 and 2024 Asia-Pacific Hydrocolloids Volume Market Share (%) by Geographic Region – China, India, Indonesia, Japan, South Korea, Malaysia, Thailand and Rest of Asia-Pacific
Chart 14: Asia-Pacific Hydrocolloids Market Analysis (2015-2024) by Geographic Region – China, India, Indonesia, Japan, South Korea, Malaysia, Thailand and Rest of Asia-Pacific in USD Million
Chart 15: Glance at 2015, 2018 and 2024 Asia-Pacific Hydrocolloids Value Market Share (%) by Geographic Region – China, India, Indonesia, Japan, South Korea, Malaysia, Thailand and Rest of Asia-Pacific
Chart 16: Asia-Pacific Hydrocolloids Market Analysis (2015-2024) by Raw Material Source – Animal-derived (Gelatin), Microbial-fermented, Plant-derived, Seaweed-derived and Cellulose-based in Metric Tons
Chart 17: Glance at 2015, 2018 and 2024 Asia-Pacific Hydrocolloids Volume Market Share (%) by Raw Material Source – Animal-derived (Gelatin), Microbial-fermented, Plant-derived, Seaweed-derived and Cellulose-based
Chart 18: Asia-Pacific Hydrocolloids Market Analysis (2015-2024) by Raw Material Source – Animal-derived (Gelatin), Microbial-fermented, Plant-derived, Seaweed-derived and Cellulose-based in USD Million
Chart 19: Glance at 2015, 2018 and 2024 Asia-Pacific Hydrocolloids Value Market Share (%) by Raw Material Source – Animal-derived (Gelatin), Microbial-fermented, Plant-derived, Seaweed-derived and Cellulose-based
Chart 20: Asia-Pacific Hydrocolloids Market Analysis (2015-2024) by End-use Application – Animal Feed, Food & Beverages, Cosmetics & Personal Care, Pharma & Healthcare, Oil & Gas and Industrial/Technical in Metric Tons
Chart 21: Glance at 2015, 2018 and 2024 Asia-Pacific Hydrocolloids Volume Market Share (%) by End-use Application – Animal Feed, Food & Beverages, Cosmetics & Personal Care, Pharma & Healthcare, Oil & Gas and Industrial/Technical
Chart 22: Asia-Pacific Hydrocolloids Market Analysis (2015-2024) by End-use Application – Animal Feed, Food & Beverages, Cosmetics & Personal Care, Pharma & Healthcare, Oil & Gas and Industrial/Technical in USD Million
Chart 23: Glance at 2015, 2018 and 2024 Asia-Pacific Hydrocolloids Value Market Share (%) by End-use Application – Animal Feed, Food & Beverages, Cosmetics & Personal Care, Pharma & Healthcare, Oil & Gas and Industrial/Technical
CHINA
Chart 24: Chinese Hydrocolloids Market Analysis (2015-2024) by Volume in Metric Tons and Value in USD Million
Chart 25: Chinese Hydrocolloids Market Analysis (2015-2024) by End-use Application – Animal Feed, Food & Beverages, Cosmetics & Personal Care, Pharma & Healthcare, Oil & Gas and Industrial/Technical in Metric Tons
Chart 26: Glance at 2015, 2018 and 2024 Chinese Hydrocolloids Volume Market Share (%) by End-use Application – Animal Feed, Food & Beverages, Cosmetics & Personal Care, Pharma & Healthcare, Oil & Gas and Industrial/Technical
Chart 27: Chinese Hydrocolloids Market Analysis (2015-2024) by End-use Application – Animal Feed, Food & Beverages, Cosmetics & Personal Care, Pharma & Healthcare, Oil & Gas and Industrial/Technical in USD Million
Chart 28: Glance at 2015, 2018 and 2024 Chinese Hydrocolloids Value Market Share (%) by End-use Application – Animal Feed, Food & Beverages, Cosmetics & Personal Care, Pharma & Healthcare, Oil & Gas and Industrial/Technical
Chart 29: Chinese Hydrocolloids Market Analysis (2015-2024) by Raw Material Source – Animal-derived (Gelatin), Microbial-fermented, Plant-derived, Seaweed-derived and Cellulose-based in Metric Tons
Chart 30: Glance at 2015, 2018 and 2024 Chinese Hydrocolloids Volume Market Share (%) by Raw Material Source – Animal-derived (Gelatin), Microbial-fermented, Plant-derived, Seaweed-derived and Cellulose-based
Chart 31: Chinese Hydrocolloids Market Analysis (2015-2024) by Raw Material Source – Animal-derived (Gelatin), Microbial-fermented, Plant-derived, Seaweed-derived and Cellulose-based in USD Million
Chart 32: Glance at 2015, 2018 and 2024 Chinese Hydrocolloids Value Market Share (%) by Raw Material Source – Animal-derived (Gelatin), Microbial-fermented, Plant-derived, Seaweed-derived and Cellulose-based
Chart 33: Chinese Gelatin Market Analysis (2015-2024) by End-use Application – Food & Beverages, Cosmetics & Personal Care, Pharmaceuticals, Nutraceuticals, Technical and Animal Feed in Metric Tons
Chart 34: Glance at 2015, 2018 and 2024 Chinese Gelatin Volume Market Share (%) by End-use Application – Food & Beverages, Cosmetics & Personal Care, Pharmaceuticals, Nutraceuticals, Technical and Animal Feed
Chart 35: Chinese Gelatin Market Analysis (2015-2024) by End-use Application – Food & Beverages, Cosmetics & Personal Care, Pharmaceuticals, Nutraceuticals, Technical and Animal Feed in USD Million
Chart 36: Glance at 2015, 2018 and 2024 Chinese Gelatin Value Market Share (%) by End-use Application – Food & Beverages, Cosmetics & Personal Care, Pharmaceuticals, Nutraceuticals, Technical and Animal Feed
Chart 37: Chinese Microbial-fermented Hydrocolloids Market Analysis (2015-2024) by Product Type – Xanthan Gum and Gellan Gum in Metric Tons
Chart 38: Glance at 2015, 2018 and 2024 Chinese Microbial-fermented Hydrocolloids Volume Market Share (%) by Product Type – Xanthan Gum and Gellan Gum
Chart 39: Chinese Microbial-fermented Hydrocolloids Market Analysis (2015-2024) by Product Type – Xanthan Gum and Gellan Gum in USD Million
Chart 40: Glance at 2015, 2018 and 2024 Chinese Microbial-fermented Hydrocolloids Value Market Share (%) by Product Type – Xanthan Gum and Gellan Gum
Chart 41: Chinese Microbial-fermented Hydrocolloids Market Analysis (2015-2024) by End-use Application – Food & Beverages, Cosmetics & Personal Care, Pharma & Health Care, Oil & Gas and Other Industrial/Technical in Metric Tons
Chart 42: Glance at 2015, 2018 and 2024 Chinese Microbial-fermented Hydrocolloids Volume Market Share (%) by End-use Application – Food & Beverages, Cosmetics & Personal Care, Pharma & Health Care, Oil & Gas and Other Industrial/Technical
Chart 43: Chinese Microbial-fermented Hydrocolloids Market Analysis (2015-2024) by End-use Application – Food & Beverages, Cosmetics & Personal Care, Pharma & Health Care, Oil & Gas and Other Industrial/Technical in USD Million
Chart 44: Glance at 2015, 2018 and 2024 Chinese Microbial-fermented Hydrocolloids Value Market Share (%) by End-use Application – Food & Beverages, Cosmetics & Personal Care, Pharma & Health Care, Oil & Gas and Other Industrial/Technical
Chart 45: Chinese Plant-derived Hydrocolloids Market Analysis (2015-2024) by Product Type – Guar Gum, Gum Arabic, LBG, Tara Gum and Pectin in Metric Tons
Chart 46: Glance at 2015, 2018 and 2024 Chinese Plant-derived Hydrocolloids Volume Market Share (%) by Product Type – Guar Gum, Gum Arabic, LBG, Tara Gum and Pectin
Chart 47: Chinese Plant-derived Hydrocolloids Market Analysis (2015-2024) by Product Type – Guar Gum, Gum Arabic, LBG, Tara Gum and Pectin in USD Million
Chart 48: Glance at 2015, 2018 and 2024 Chinese Plant-derived Hydrocolloids Value Market Share (%) by Product Type – Guar Gum, Gum Arabic, LBG, Tara Gum and Pectin
Chart 49: Chinese Plant-derived Hydrocolloids Market Analysis (2015-2024) by End-use Application – Animal Feed, Food & Beverages, Cosmetics & Personal Care, Pharma & Healthcare, Oil & Gas and Other Industrial/Technical in Metric Tons
Chart 50: Glance at 2015, 2018 and 2024 Chinese Plant-derived Hydrocolloids Volume Market Share (%) by End-use Application – Animal Feed, Food & Beverages, Cosmetics & Personal Care, Pharma & Healthcare, Oil & Gas and Other Industrial/Technical
Chart 51: Chinese Plant-derived Hydrocolloids Market Analysis (2015-2024) by End-use Application – Animal Feed, Food & Beverages, Cosmetics & Personal Care, Pharma & Healthcare, Oil & Gas and Other Industrial/Technical in USD Million
Chart 52: Glance at 2015, 2018 and 2024 Chinese Plant-derived Hydrocolloids Value Market Share (%) by End-use Application – Animal Feed, Food & Beverages, Cosmetics & Personal Care, Pharma & Healthcare, Oil & Gas and Other Industrial/Technical
Chart 53: Chinese Seaweed Hydrocolloids Market Analysis (2015-2024) by Product Type – Agar-Agar, Alginates and Carrageenan in Metric Tons
Chart 54: Glance at 2015, 2018 and 2024 Chinese Seaweed Hydrocolloids Volume Market Share (%) by Product Type – Agar-Agar, Alginates and Carrageenan
Chart 55: Chinese Seaweed Hydrocolloids Market Analysis (2015-2024) by Product Type – Agar-Agar, Alginates and Carrageenan in USD Million
Chart 56: Glance at 2015, 2018 and 2024 Chinese Seaweed Hydrocolloids Value Market Share (%) by Product Type – Agar-Agar, Alginates and Carrageenan
Chart 57: Chinese Seaweed Hydrocolloids Market Analysis (2015-2024) by End-use Application – Animal Feed, Food & Beverages, Cosmetics & Personal Care, Pharma & Health Care and Industrial/Technical in Metric Tons
Chart 58: Glance at 2015, 2018 and 2024 Chinese Seaweed Hydrocolloids Volume Market Share (%) by End-use Application – Animal Feed, Food & Beverages, Cosmetics & Personal Care, Pharma & Health Care and Industrial/Technical
Chart 59: Chinese Seaweed Hydrocolloids Market Analysis (2015-2024) by End-use Application – Animal Feed, Food & Beverages, Cosmetics & Personal Care, Pharma & Health Care and Industrial/Technical in USD Million
Chart 60: Glance at 2015, 2018 and 2024 Chinese Seaweed Hydrocolloids Value Market Share (%) by End-use Application – Animal Feed, Food & Beverages, Cosmetics & Personal Care, Pharma & Health Care and Industrial/Technical
Chart 61: Chinese Cellulose-based Hydrocolloids Market Analysis (2015-2024) by Product Type – CMC, MC/HPMC and MCC in Metric Tons
Chart 62: Glance at 2015, 2018 and 2024 Chinese Cellulose-based Hydrocolloids Volume Market Share (%) by Product Type – CMC, MC/HPMC and MCC
Chart 63: Chinese Cellulose-based Hydrocolloids Market Analysis (2015-2024) by Product Type – CMC, MC/HPMC and MCC in USD Million
Chart 64: Glance at 2015, 2018 and 2024 Chinese Cellulose-based Hydrocolloids Value Market Share (%) by Product Type – CMC, MC/HPMC and MCC
Chart 65: Chinese Cellulose-based Hydrocolloids Market Analysis (2015-2024) by End-use Application – Construction, Food & Beverages, Cosmetics & Personal Care, Pharma & Nutraceuticals, Oil & Gas and Other Industrial/Technical in Metric Tons
Chart 66: Glance at 2015, 2018 and 2024 Chinese Cellulose-based Hydrocolloids Volume Market Share (%) by End-use Application – Construction, Food & Beverages, Cosmetics & Personal Care, Pharma & Nutraceuticals, Oil & Gas and Other Industrial/Technical
Chart 67: Chinese Cellulose-based Hydrocolloids Market Analysis (2015-2024) by End-use Application – Construction, Food & Beverages, Cosmetics & Personal Care, Pharma & Nutraceuticals, Oil & Gas and Other Industrial/Technical in USD Million
Chart 68: Glance at 2015, 2018 and 2024 Chinese Cellulose-based Hydrocolloids Value Market Share (%) by End-use Application – Construction, Food & Beverages, Cosmetics & Personal Care, Pharma & Nutraceuticals, Oil & Gas and Other Industrial/Technical
INDIA
Chart 69: Indian Hydrocolloids Market Analysis (2015-2024) by Volume in Metric Tons and Value in USD Million
Chart 70: Indian Hydrocolloids Market Analysis (2015-2024) by End-use Application – Animal Feed, Food & Beverages, Cosmetics & Personal Care, Pharma & Healthcare, Oil & Gas and Industrial/Technical in Metric Tons
Chart 71: Glance at 2015, 2018 and 2024 Indian Hydrocolloids Volume Market Share (%) by End-use Application – Animal Feed, Food & Beverages, Cosmetics & Personal Care, Pharma & Healthcare, Oil & Gas and Industrial/Technical
Chart 72: Indian Hydrocolloids Market Analysis (2015-2024) by End-use Application – Animal Feed, Food & Beverages, Cosmetics & Personal Care, Pharma & Healthcare, Oil & Gas and Industrial/Technical in USD Million
Chart 73: Glance at 2015, 2018 and 2024 Indian Hydrocolloids Value Market Share (%) by End-use Application – Animal Feed, Food & Beverages, Cosmetics & Personal Care, Pharma & Healthcare, Oil & Gas and Industrial/Technical
Chart 74: Indian Hydrocolloids Market Analysis (2015-2024) by Raw Material Source – Animal-derived (Gelatin), Microbial-fermented, Plant-derived, Seaweed-derived and Cellulose-based in Metric Tons
Chart 75: Glance at 2015, 2018 and 2024 Indian Hydrocolloids Volume Market Share (%) by Raw Material Source – Animal-derived (Gelatin), Microbial-fermented, Plant-derived, Seaweed-derived and Cellulose-based
Chart 76: Indian Hydrocolloids Market Analysis (2015-2024) by Raw Material Source – Animal-derived (Gelatin), Microbial-fermented, Plant-derived, Seaweed-derived and Cellulose-based in USD Million
Chart 77: Glance at 2015, 2018 and 2024 Indian Hydrocolloids Value Market Share (%) by Raw Material Source – Animal-derived (Gelatin), Microbial-fermented, Plant-derived, Seaweed-derived and Cellulose-based
Chart 78: Indian Gelatin Market Analysis (2015-2024) by End-use Application – Food & Beverages, Cosmetics & Personal Care, Pharmaceuticals, Nutraceuticals, Technical and Animal Feed in Metric Tons
Chart 79: Glance at 2015, 2018 and 2024 Indian Gelatin Volume Market Share (%) by End-use Application – Food & Beverages, Cosmetics & Personal Care, Pharmaceuticals, Nutraceuticals, Technical and Animal Feed
Chart 80: Indian Gelatin Market Analysis (2015-2024) by End-use Application – Food & Beverages, Cosmetics & Personal Care, Pharmaceuticals, Nutraceuticals, Technical and Animal Feed in USD Million
Chart 81: Glance at 2015, 2018 and 2024 Indian Gelatin Value Market Share (%) by End-use Application – Food & Beverages, Cosmetics & Personal Care, Pharmaceuticals, Nutraceuticals, Technical and Animal Feed
Chart 82: Indian Microbial-fermented Hydrocolloids Market Analysis (2015-2024) by Product Type – Xanthan Gum and Gellan Gum in Metric Tons
Chart 83: Glance at 2015, 2018 and 2024 Indian Microbial-fermented Hydrocolloids Volume Market Share (%) by Product Type – Xanthan Gum and Gellan Gum
Chart 84: Indian Microbial-fermented Hydrocolloids Market Analysis (2015-2024) by Product Type – Xanthan Gum and Gellan Gum in USD Million
Chart 85: Glance at 2015, 2018 and 2024 Indian Microbial-fermented Hydrocolloids Value Market Share (%) by Product Type – Xanthan Gum and Gellan Gum
Chart 86: Indian Microbial-fermented Hydrocolloids Market Analysis (2015-2024) by End-use Application – Food & Beverages, Cosmetics & Personal Care, Pharma & Health Care, Oil & Gas and Other Industrial/Technical in Metric Tons
Chart 87: Glance at 2015, 2018 and 2024 Indian Microbial-fermented Hydrocolloids Volume Market Share (%) by End-use Application – Food & Beverages, Cosmetics & Personal Care, Pharma & Health Care, Oil & Gas and Other Industrial/Technical
Chart 88: Indian Microbial-fermented Hydrocolloids Market Analysis (2015-2024) by End-use Application – Food & Beverages, Cosmetics & Personal Care, Pharma & Health Care, Oil & Gas and Other Industrial/Technical in USD Million
Chart 89: Glance at 2015, 2018 and 2024 Indian Microbial-fermented Hydrocolloids Value Market Share (%) by End-use Application – Food & Beverages, Cosmetics & Personal Care, Pharma & Health Care, Oil & Gas and Other Industrial/Technical
Chart 90: Indian Plant-derived Hydrocolloids Market Analysis (2015-2024) by Product Type – Guar Gum, Gum Arabic, LBG, Tara Gum and Pectin in Metric Tons
Chart 91: Glance at 2015, 2018 and 2024 Indian Plant-derived Hydrocolloids Volume Market Share (%) by Product Type – Guar Gum, Gum Arabic, LBG, Tara Gum and Pectin
Chart 92: Indian Plant-derived Hydrocolloids Market Analysis (2015-2024) by Product Type – Guar Gum, Gum Arabic, LBG, Tara Gum and Pectin in USD Million
Chart 93: Glance at 2015, 2018 and 2024 Indian Plant-derived Hydrocolloids Value Market Share (%) by Product Type – Guar Gum, Gum Arabic, LBG, Tara Gum and Pectin
Chart 94: Indian Plant-derived Hydrocolloids Market Analysis (2015-2024) by End-use Application – Animal Feed, Food & Beverages, Cosmetics & Personal Care, Pharma & Healthcare, Oil & Gas and Other Industrial/Technical in Metric Tons
Chart 95: Glance at 2015, 2018 and 2024 Indian Plant-derived Hydrocolloids Volume Market Share (%) by End-use Application – Animal Feed, Food & Beverages, Cosmetics & Personal Care, Pharma & Healthcare, Oil & Gas and Other Industrial/Technical
Chart 96: Indian Plant-derived Hydrocolloids Market Analysis (2015-2024) by End-use Application – Animal Feed, Food & Beverages, Cosmetics & Personal Care, Pharma & Healthcare, Oil & Gas and Other Industrial/Technical in USD Million
Chart 97: Glance at 2015, 2018 and 2024 Indian Plant-derived Hydrocolloids Value Market Share (%) by End-use Application – Animal Feed, Food & Beverages, Cosmetics & Personal Care, Pharma & Healthcare, Oil & Gas and Other Industrial/Technical
Chart 98: Indian Seaweed Hydrocolloids Market Analysis (2015-2024) by Product Type – Agar-Agar, Alginates and Carrageenan in Metric Tons
Chart 99: Glance at 2015, 2018 and 2024 Indian Seaweed Hydrocolloids Volume Market Share (%) by Product Type – Agar-Agar, Alginates and Carrageenan
Chart 100: Indian Seaweed Hydrocolloids Market Analysis (2015-2024) by Product Type – Agar-Agar, Alginates and Carrageenan in USD Million
Chart 101: Glance at 2015, 2018 and 2024 Indian Seaweed Hydrocolloids Value Market Share (%) by Product Type – Agar-Agar, Alginates and Carrageenan
Chart 102: Indian Seaweed Hydrocolloids Market Analysis (2015-2024) by End-use Application – Animal Feed, Food & Beverages, Cosmetics & Personal Care, Pharma & Health Care and Industrial/Technical in Metric Tons
Chart 103: Glance at 2015, 2018 and 2024 Indian Seaweed Hydrocolloids Volume Market Share (%) by End-use Application – Animal Feed, Food & Beverages, Cosmetics & Personal Care, Pharma & Health Care and Industrial/Technical
Chart 104: Indian Seaweed Hydrocolloids Market Analysis (2015-2024) by End-use Application – Animal Feed, Food & Beverages, Cosmetics & Personal Care, Pharma & Health Care and Industrial/Technical in USD Million
Chart 105: Glance at 2015, 2018 and 2024 Indian Seaweed Hydrocolloids Value Market Share (%) by End-use Application – Animal Feed, Food & Beverages, Cosmetics & Personal Care, Pharma & Health Care and Industrial/Technical
Chart 106: Indian Cellulose-based Hydrocolloids Market Analysis (2015-2024) by Product Type – CMC, MC/HPMC and MCC in Metric Tons
Chart 107: Glance at 2015, 2018 and 2024 Indian Cellulose-based Hydrocolloids Volume Market Share (%) by Product Type – CMC, MC/HPMC and MCC
Chart 108: Indian Cellulose-based Hydrocolloids Market Analysis (2015-2024) by Product Type – CMC, MC/HPMC and MCC in USD Million
Chart 109: Glance at 2015, 2018 and 2024 Indian Cellulose-based Hydrocolloids Value Market Share (%) by Product Type – CMC, MC/HPMC and MCC
Chart 110: Indian Cellulose-based Hydrocolloids Market Analysis (2015-2024) by End-use Application – Construction, Food & Beverages, Cosmetics & Personal Care, Pharma & Nutraceuticals, Oil & Gas and Other Industrial/Technical in Metric Tons
Chart 111: Glance at 2015, 2018 and 2024 Indian Cellulose-based Hydrocolloids Volume Market Share (%) by End-use Application – Construction, Food & Beverages, Cosmetics & Personal Care, Pharma & Nutraceuticals, Oil & Gas and Other Industrial/Technical
Chart 112: Indian Cellulose-based Hydrocolloids Market Analysis (2015-2024) by End-use Application – Construction, Food & Beverages, Cosmetics & Personal Care, Pharma & Nutraceuticals, Oil & Gas and Other Industrial/Technical in USD Million
Chart 113: Glance at 2015, 2018 and 2024 Indian Cellulose-based Hydrocolloids Value Market Share (%) by End-use Application – Construction, Food & Beverages, Cosmetics & Personal Care, Pharma & Nutraceuticals, Oil & Gas and Other Industrial/Technical
INDONESIA
Chart 114: Indonesian Hydrocolloids Market Analysis (2015-2024) by Volume in Metric Tons and Value in USD Million
Chart 115: Indonesian Hydrocolloids Market Analysis (2015-2024) by End-use Application – Animal Feed, Food & Beverages, Cosmetics & Personal Care, Pharma & Healthcare, Oil & Gas and Industrial/Technical in Metric Tons
Chart 116: Glance at 2015, 2018 and 2024 Indonesian Hydrocolloids Volume Market Share (%) by End-use Application – Animal Feed, Food & Beverages, Cosmetics & Personal Care, Pharma & Healthcare, Oil & Gas and Industrial/Technical
Chart 117: Indonesian Hydrocolloids Market Analysis (2015-2024) by End-use Application – Animal Feed, Food & Beverages, Cosmetics & Personal Care, Pharma & Healthcare, Oil & Gas and Industrial/Technical in USD Million
Chart 118: Glance at 2015, 2018 and 2024 Indonesian Hydrocolloids Value Market Share (%) by End-use Application – Animal Feed, Food & Beverages, Cosmetics & Personal Care, Pharma & Healthcare, Oil & Gas and Industrial/Technical
Chart 119: Indonesian Hydrocolloids Market Analysis (2015-2024) by Raw Material Source – Animal-derived (Gelatin), Microbial-fermented, Plant-derived, Seaweed-derived and Cellulose-based in Metric Tons
Chart 120: Glance at 2015, 2018 and 2024 Indonesian Hydrocolloids Volume Market Share (%) by Raw Material Source – Animal-derived (Gelatin), Microbial-fermented, Plant-derived, Seaweed-derived and Cellulose-based
Chart 121: Indonesian Hydrocolloids Market Analysis (2015-2024) by Raw Material Source – Animal-derived (Gelatin), Microbial-fermented, Plant-derived, Seaweed-derived and Cellulose-based in USD Million
Chart 122: Glance at 2015, 2018 and 2024 Indonesian Hydrocolloids Value Market Share (%) by Raw Material Source – Animal-derived (Gelatin), Microbial-fermented, Plant-derived, Seaweed-derived and Cellulose-based
Chart 123: Indonesia Gelatin Market Analysis (2015-2024) by End-use Application – Food & Beverages, Cosmetics & Personal Care, Pharmaceuticals, Nutraceuticals, Technical and Animal Feed in Metric Tons
Chart 124: Glance at 2015, 2018 and 2024 Indonesia Gelatin Volume Market Share (%) by End-use Application – Food & Beverages, Cosmetics & Personal Care, Pharmaceuticals, Nutraceuticals, Technical and Animal Feed
Chart 125: Indonesia Gelatin Market Analysis (2015-2024) by End-use Application – Food & Beverages, Cosmetics & Personal Care, Pharmaceuticals, Nutraceuticals, Technical and Animal Feed in USD Million
Chart 126: Glance at 2015, 2018 and 2024 Indonesia Gelatin Value Market Share (%) by End-use Application – Food & Beverages, Cosmetics & Personal Care, Pharmaceuticals, Nutraceuticals, Technical and Animal Feed
Chart 127: Indonesian Microbial-fermented Hydrocolloids Market Analysis (2015-2024) by Product Type – Xanthan Gum and Gellan Gum in Metric Tons
Chart 128: Glance at 2015, 2018 and 2024 Indonesian Microbial-fermented Hydrocolloids Volume Market Share (%) by Product Type – Xanthan Gum and Gellan Gum
Chart 129: Indonesian Microbial-fermented Hydrocolloids Market Analysis (2015-2024) by Product Type – Xanthan Gum and Gellan Gum in USD Million
Chart 130: Glance at 2015, 2018 and 2024 Indonesian Microbial-fermented Hydrocolloids Value Market Share (%) by Product Type – Xanthan Gum and Gellan Gum
Chart 131: Indonesian Microbial-fermented Hydrocolloids Market Analysis (2015-2024) by End-use Application – Food & Beverages, Cosmetics & Personal Care, Pharma & Health Care, Oil & Gas and Other Industrial/Technical in Metric Tons
Chart 132: Glance at 2015, 2018 and 2024 Indonesian Microbial-fermented Hydrocolloids Volume Market Share (%) by End-use Application – Food & Beverages, Cosmetics & Personal Care, Pharma & Health Care, Oil & Gas and Other Industrial/Technical
Chart 133: Indonesian Microbial-fermented Hydrocolloids Market Analysis (2015-2024) by End-use Application – Food & Beverages, Cosmetics & Personal Care, Pharma & Health Care, Oil & Gas and Other Industrial/Technical in USD Million
Chart 134: Glance at 2015, 2018 and 2024 Indonesian Microbial-fermented Hydrocolloids Value Market Share (%) by End-use Application – Food & Beverages, Cosmetics & Personal Care, Pharma & Health Care, Oil & Gas and Other Industrial/Technical
Chart 135: Indonesian Plant-derived Hydrocolloids Market Analysis (2015-2024) by Product Type – Guar Gum, Gum Arabic, LBG, Tara Gum and Pectin in Metric Tons
Chart 136: Glance at 2015, 2018 and 2024 Indonesian Plant-derived Hydrocolloids Volume Market Share (%) by Product Type – Guar Gum, Gum Arabic, LBG, Tara Gum and Pectin
Chart 137: Indonesian Plant-derived Hydrocolloids Market Analysis (2015-2024) by Product Type – Guar Gum, Gum Arabic, LBG, Tara Gum and Pectin in USD Million
Chart 138: Glance at 2015, 2018 and 2024 Indonesian Plant-derived Hydrocolloids Value Market Share (%) by Product Type – Guar Gum, Gum Arabic, LBG, Tara Gum and Pectin
Chart 139: Indonesian Plant-derived Hydrocolloids Market Analysis (2015-2024) by End-use Application – Animal Feed, Food & Beverages, Cosmetics & Personal Care, Pharma & Healthcare, Oil & Gas and Other Industrial/Technical in Metric Tons
Chart 140: Glance at 2015, 2018 and 2024 Indonesian Plant-derived Hydrocolloids Volume Market Share (%) by End-use Application – Animal Feed, Food & Beverages, Cosmetics & Personal Care, Pharma & Healthcare, Oil & Gas and Other Industrial/Technical
Chart 141: Indonesian Plant-derived Hydrocolloids Market Analysis (2015-2024) by End-use Application – Animal Feed, Food & Beverages, Cosmetics & Personal Care, Pharma & Healthcare, Oil & Gas and Other Industrial/Technical in USD Million
Chart 142: Glance at 2015, 2018 and 2024 Indonesian Plant-derived Hydrocolloids Value Market Share (%) by End-use Application – Animal Feed, Food & Beverages, Cosmetics & Personal Care, Pharma & Healthcare, Oil & Gas and Other Industrial/Technical
Chart 143: Indonesian Seaweed Hydrocolloids Market Analysis (2015-2024) by Product Type – Agar-Agar, Alginates and Carrageenan in Metric Tons
Chart 144: Glance at 2015, 2018 and 2024 Indonesian Seaweed Hydrocolloids Volume Market Share (%) by Product Type – Agar-Agar, Alginates and Carrageenan
Chart 145: Indonesian Seaweed Hydrocolloids Market Analysis (2015-2024) by Product Type – Agar-Agar, Alginates and Carrageenan in USD Million
Chart 146: Glance at 2015, 2018 and 2024 Indonesian Seaweed Hydrocolloids Value Market Share (%) by Product Type – Agar-Agar, Alginates and Carrageenan
Chart 147: Indonesian Seaweed Hydrocolloids Market Analysis (2015-2024) by End-use Application – Animal Feed, Food & Beverages, Cosmetics & Personal Care, Pharma & Health Care and Industrial/Technical in Metric Tons
Chart 148: Glance at 2015, 2018 and 2024 Indonesian Seaweed Hydrocolloids Volume Market Share (%) by End-use Application – Animal Feed, Food & Beverages, Cosmetics & Personal Care, Pharma & Health Care and Industrial/Technical
Chart 149: Indonesian Seaweed Hydrocolloids Market Analysis (2015-2024) by End-use Application – Animal Feed, Food & Beverages, Cosmetics & Personal Care, Pharma & Health Care and Industrial/Technical in USD Million
Chart 150: Glance at 2015, 2018 and 2024 Indonesian Seaweed Hydrocolloids Value Market Share (%) by End-use Application – Animal Feed, Food & Beverages, Cosmetics & Personal Care, Pharma & Health Care and Industrial/Technical
Chart 151: Indonesian Cellulose-based Hydrocolloids Market Analysis (2015-2024) by Product Type – CMC, MC/HPMC and MCC in Metric Tons
Chart 152: Glance at 2015, 2018 and 2024 Indonesian Cellulose-based Hydrocolloids Volume Market Share (%) by Product Type – CMC, MC/HPMC and MCC
Chart 153: Indonesian Cellulose-based Hydrocolloids Market Analysis (2015-2024) by Product Type – CMC, MC/HPMC and MCC in USD Million
Chart 154: Glance at 2015, 2018 and 2024 Indonesian Cellulose-based Hydrocolloids Value Market Share (%) by Product Type – CMC, MC/HPMC and MCC
Chart 155: Indonesian Cellulose-based Hydrocolloids Market Analysis (2015-2024) by End-use Application – Construction, Food & Beverages, Cosmetics & Personal Care, Pharma & Nutraceuticals, Oil & Gas and Other Industrial/Technical in Metric Tons
Chart 156: Glance at 2015, 2018 and 2024 Indonesian Cellulose-based Hydrocolloids Volume Market Share (%) by End-use Application – Construction, Food & Beverages, Cosmetics & Personal Care, Pharma & Nutraceuticals, Oil & Gas and Other Industrial/Technical
Chart 157: Indonesian Cellulose-based Hydrocolloids Market Analysis (2015-2024) by End-use Application – Construction, Food & Beverages, Cosmetics & Personal Care, Pharma & Nutraceuticals, Oil & Gas and Other Industrial/Technical in USD Million
Chart 158: Glance at 2015, 2018 and 2024 Indonesian Cellulose-based Hydrocolloids Value Market Share (%) by End-use Application – Construction, Food & Beverages, Cosmetics & Personal Care, Pharma & Nutraceuticals, Oil & Gas and Other Industrial/Technical
JAPAN
Chart 159: Japanese Hydrocolloids Market Analysis (2015-2024) by Volume in Metric Tons and Value in USD Million
Chart 160: Japanese Hydrocolloids Market Analysis (2015-2024) by End-use Application – Animal Feed, Food & Beverages, Cosmetics & Personal Care, Pharma & Healthcare, Oil & Gas and Industrial/Technical in Metric Tons
Chart 161: Glance at 2015, 2018 and 2024 Japanese Hydrocolloids Volume Market Share (%) by End-use Application – Animal Feed, Food & Beverages, Cosmetics & Personal Care, Pharma & Healthcare, Oil & Gas and Industrial/Technical
Chart 162: Japanese Hydrocolloids Market Analysis (2015-2024) by End-use Application – Animal Feed, Food & Beverages, Cosmetics & Personal Care, Pharma & Healthcare, Oil & Gas and Industrial/Technical in USD Million
Chart 163: Glance at 2015, 2018 and 2024 Japanese Hydrocolloids Value Market Share (%) by End-use Application – Animal Feed, Food & Beverages, Cosmetics & Personal Care, Pharma & Healthcare, Oil & Gas and Industrial/Technical
Chart 164: Japanese Hydrocolloids Market Analysis (2015-2024) by Raw Material Source – Animal-derived (Gelatin), Microbial-fermented, Plant-derived, Seaweed-derived and Cellulose-based in Metric Tons
Chart 165: Glance at 2015, 2018 and 2024 Japanese Hydrocolloids Volume Market Share (%) by Raw Material Source – Animal-derived (Gelatin), Microbial-fermented, Plant-derived, Seaweed-derived and Cellulose-based
Chart 166: Japanese Hydrocolloids Market Analysis (2015-2024) by Raw Material Source – Animal-derived (Gelatin), Microbial-fermented, Plant-derived, Seaweed-derived and Cellulose-based in USD Million
Chart 167: Glance at 2015, 2018 and 2024 Japanese Hydrocolloids Value Market Share (%) by Raw Material Source – Animal-derived (Gelatin), Microbial-fermented, Plant-derived, Seaweed-derived and Cellulose-based
Chart 168: Japanese Gelatin Market Analysis (2015-2024) by End-use Application – Food & Beverages, Cosmetics & Personal Care, Pharmaceuticals, Nutraceuticals, Technical and Animal Feed in Metric Tons
Chart 169: Glance at 2015, 2018 and 2024 Japanese Gelatin Volume Market Share (%) by End-use Application – Food & Beverages, Cosmetics & Personal Care, Pharmaceuticals, Nutraceuticals, Technical and Animal Feed
Chart 170: Japanese Gelatin Market Analysis (2015-2024) by End-use Application – Food & Beverages, Cosmetics & Personal Care, Pharmaceuticals, Nutraceuticals, Technical and Animal Feed in USD Million
Chart 171: Glance at 2015, 2018 and 2024 Japanese Gelatin Value Market Share (%) by End-use Application – Food & Beverages, Cosmetics & Personal Care, Pharmaceuticals, Nutraceuticals, Technical and Animal Feed
Chart 172: Japanese Microbial-fermented Hydrocolloids Market Analysis (2015-2024) by Product Type – Xanthan Gum and Gellan Gum in Metric Tons
Chart 173: Glance at 2015, 2018 and 2024 Japanese Microbial-fermented Hydrocolloids Volume Market Share (%) by Product Type – Xanthan Gum and Gellan Gum
Chart 174: Japanese Microbial-fermented Hydrocolloids Market Analysis (2015-2024) by Product Type – Xanthan Gum and Gellan Gum in USD Million
Chart 175: Glance at 2015, 2018 and 2024 Japanese Microbial-fermented Hydrocolloids Value Market Share (%) by Product Type – Xanthan Gum and Gellan Gum
Chart 176: Japanese Microbial-fermented Hydrocolloids Market Analysis (2015-2024) by End-use Application – Food & Beverages, Cosmetics & Personal Care, Pharma & Health Care, Oil & Gas and Other Industrial/Technical in Metric Tons
Chart 177: Glance at 2015, 2018 and 2024 Japanese Microbial-fermented Hydrocolloids Volume Market Share (%) by End-use Application – Food & Beverages, Cosmetics & Personal Care, Pharma & Health Care, Oil & Gas and Other Industrial/Technical
Chart 178: Japanese Microbial-fermented Hydrocolloids Market Analysis (2015-2024) by End-use Application – Food & Beverages, Cosmetics & Personal Care, Pharma & Health Care, Oil & Gas and Other Industrial/Technical in USD Million
Chart 179: Glance at 2015, 2018 and 2024 Japanese Microbial-fermented Hydrocolloids Value Market Share (%) by End-use Application – Food & Beverages, Cosmetics & Personal Care, Pharma & Health Care, Oil & Gas and Other Industrial/Technical
Chart 180: Japanese Plant-derived Hydrocolloids Market Analysis (2015-2024) by Product Type – Guar Gum, Gum Arabic, LBG, Tara Gum and Pectin in Metric Tons
Chart 181: Glance at 2015, 2018 and 2024 Japanese Plant-derived Hydrocolloids Volume Market Share (%) by Product Type – Guar Gum, Gum Arabic, LBG, Tara Gum and Pectin
Chart 182: Japanese Plant-derived Hydrocolloids Market Analysis (2015-2024) by Product Type – Guar Gum, Gum Arabic, LBG, Tara Gum and Pectin in USD Million
Chart 183: Glance at 2015, 2018 and 2024 Japanese Plant-derived Hydrocolloids Value Market Share (%) by Product Type – Guar Gum, Gum Arabic, LBG, Tara Gum and Pectin
Chart 184: Japanese Plant-derived Hydrocolloids Market Analysis (2015-2024) by End-use Application – Animal Feed, Food & Beverages, Cosmetics & Personal Care, Pharma & Healthcare, Oil & Gas and Other Industrial/Technical in Metric Tons
Chart 185: Glance at 2015, 2018 and 2024 Japanese Plant-derived Hydrocolloids Volume Market Share (%) by End-use Application – Animal Feed, Food & Beverages, Cosmetics & Personal Care, Pharma & Healthcare, Oil & Gas and Other Industrial/Technical
Chart 186: Japanese Plant-derived Hydrocolloids Market Analysis (2015-2024) by End-use Application – Animal Feed, Food & Beverages, Cosmetics & Personal Care, Pharma & Healthcare, Oil & Gas and Other Industrial/Technical in USD Million
Chart 187: Glance at 2015, 2018 and 2024 Japanese Plant-derived Hydrocolloids Value Market Share (%) by End-use Application – Animal Feed, Food & Beverages, Cosmetics & Personal Care, Pharma & Healthcare, Oil & Gas and Other Industrial/Technical
Chart 188: Japanese Seaweed Hydrocolloids Market Analysis (2015-2024) by Product Type – Agar-Agar, Alginates and Carrageenan in Metric Tons
Chart 189: Glance at 2015, 2018 and 2024 Japanese Seaweed Hydrocolloids Volume Market Share (%) by Product Type – Agar-Agar, Alginates and Carrageenan
Chart 190: Japanese Seaweed Hydrocolloids Market Analysis (2015-2024) by Product Type – Agar-Agar, Alginates and Carrageenan in USD Million
Chart 191: Glance at 2015, 2018 and 2024 Japanese Seaweed Hydrocolloids Value Market Share (%) by Product Type – Agar-Agar, Alginates and Carrageenan
Chart 192: Japanese Seaweed Hydrocolloids Market Analysis (2015-2024) by End-use Application – Animal Feed, Food & Beverages, Cosmetics & Personal Care, Pharma & Health Care and Industrial/Technical in Metric Tons
Chart 193: Glance at 2015, 2018 and 2024 Japanese Seaweed Hydrocolloids Volume Market Share (%) by End-use Application – Animal Feed, Food & Beverages, Cosmetics & Personal Care, Pharma & Health Care and Industrial/Technical
Chart 194: Japanese Seaweed Hydrocolloids Market Analysis (2015-2024) by End-use Application – Animal Feed, Food & Beverages, Cosmetics & Personal Care, Pharma & Health Care and Industrial/Technical in USD Million
Chart 195: Glance at 2015, 2018 and 2024 Japanese Seaweed Hydrocolloids Value Market Share (%) by End-use Application – Animal Feed, Food & Beverages, Cosmetics & Personal Care, Pharma & Health Care and Industrial/Technical
Chart 196: Japanese Cellulose-based Hydrocolloids Market Analysis (2015-2024) by Product Type – CMC, MC/HPMC and MCC in Metric Tons
Chart 197: Glance at 2015, 2018 and 2024 Japanese Cellulose-based Hydrocolloids Volume Market Share (%) by Product Type – CMC, MC/HPMC and MCC
Chart 198: Japanese Cellulose-based Hydrocolloids Market Analysis (2015-2024) by Product Type – CMC, MC/HPMC and MCC in USD Million
Chart 199: Glance at 2015, 2018 and 2024 Japanese Cellulose-based Hydrocolloids Value Market Share (%) by Product Type – CMC, MC/HPMC and MCC
Chart 200: Japanese Cellulose-based Hydrocolloids Market Analysis (2015-2024) by End-use Application – Construction, Food & Beverages, Cosmetics & Personal Care, Pharma & Nutraceuticals, Oil & Gas and Other Industrial/Technical in Metric Tons
Chart 201: Glance at 2015, 2018 and 2024 Japanese Cellulose-based Hydrocolloids Volume Market Share (%) by End-use Application – Construction, Food & Beverages, Cosmetics & Personal Care, Pharma & Nutraceuticals, Oil & Gas and Other Industrial/Technical
Chart 202: Japanese Cellulose-based Hydrocolloids Market Analysis (2015-2024) by End-use Application – Construction, Food & Beverages, Cosmetics & Personal Care, Pharma & Nutraceuticals, Oil & Gas and Other Industrial/Technical in USD Million
Chart 203: Glance at 2015, 2018 and 2024 Japanese Cellulose-based Hydrocolloids Value Market Share (%) by End-use Application – Construction, Food & Beverages, Cosmetics & Personal Care, Pharma & Nutraceuticals, Oil & Gas and Other Industrial/Technical
SOUTH KOREA
Chart 204: South Korean Hydrocolloids Market Analysis (2015-2024) by Volume in Metric Tons and Value in USD Million
Chart 205: South Korean Hydrocolloids Market Analysis (2015-2024) by End-use Application – Animal Feed, Food & Beverages, Cosmetics & Personal Care, Pharma & Healthcare, Oil & Gas and Industrial/Technical in Metric Tons
Chart 206: Glance at 2015, 2018 and 2024 South Korean Hydrocolloids Volume Market Share (%) by End-use Application – Animal Feed, Food & Beverages, Cosmetics & Personal Care, Pharma & Healthcare, Oil & Gas and Industrial/Technical
Chart 207: South Korean Hydrocolloids Market Analysis (2015-2024) by End-use Application – Animal Feed, Food & Beverages, Cosmetics & Personal Care, Pharma & Healthcare, Oil & Gas and Industrial/Technical in USD Million
Chart 208: Glance at 2015, 2018 and 2024 South Korean Hydrocolloids Value Market Share (%) by End-use Application – Animal Feed, Food & Beverages, Cosmetics & Personal Care, Pharma & Healthcare, Oil & Gas and Industrial/Technical
Chart 209: South Korean Hydrocolloids Market Analysis (2015-2024) by Raw Material Source – Animal-derived (Gelatin), Microbial-fermented, Plant-derived, Seaweed-derived and Cellulose-based in Metric Tons
Chart 210: Glance at 2015, 2018 and 2024 South Korean Hydrocolloids Volume Market Share (%) by Raw Material Source – Animal-derived (Gelatin), Microbial-fermented, Plant-derived, Seaweed-derived and Cellulose-based
Chart 211: South Korean Hydrocolloids Market Analysis (2015-2024) by Raw Material Source – Animal-derived (Gelatin), Microbial-fermented, Plant-derived, Seaweed-derived and Cellulose-based in USD Million
Chart 212: Glance at 2015, 2018 and 2024 South Korean Hydrocolloids Value Market Share (%) by Raw Material Source – Animal-derived (Gelatin), Microbial-fermented, Plant-derived, Seaweed-derived and Cellulose-based
Chart 213: South Korean Gelatin Market Analysis (2015-2024) by End-use Application – Food & Beverages, Cosmetics & Personal Care, Pharmaceuticals, Nutraceuticals, Technical and Animal Feed in Metric Tons
Chart 214: Glance at 2015, 2018 and 2024 South Korean Gelatin Volume Market Share (%) by End-use Application – Food & Beverages, Cosmetics & Personal Care, Pharmaceuticals, Nutraceuticals, Technical and Animal Feed
Chart 215: South Korean Gelatin Market Analysis (2015-2024) by End-use Application – Food & Beverages, Cosmetics & Personal Care, Pharmaceuticals, Nutraceuticals, Technical and Animal Feed in USD Million
Chart 216: Glance at 2015, 2018 and 2024 South Korean Gelatin Value Market Share (%) by End-use Application – Food & Beverages, Cosmetics & Personal Care, Pharmaceuticals, Nutraceuticals, Technical and Animal Feed
Chart 217: South Korean Microbial-fermented Hydrocolloids Market Analysis (2015-2024) by Product Type – Xanthan Gum and Gellan Gum in Metric Tons
Chart 218: Glance at 2015, 2018 and 2024 South Korean Microbial-fermented Hydrocolloids Volume Market Share (%) by Product Type – Xanthan Gum and Gellan Gum
Chart 219: South Korean Microbial-fermented Hydrocolloids Market Analysis (2015-2024) by Product Type – Xanthan Gum and Gellan Gum in USD Million
Chart 220: Glance at 2015, 2018 and 2024 South Korean Microbial-fermented Hydrocolloids Value Market Share (%) by Product Type – Xanthan Gum and Gellan Gum
Chart 221: South Korean Microbial-fermented Hydrocolloids Market Analysis (2015-2024) by End-use Application – Food & Beverages, Cosmetics & Personal Care, Pharma & Health Care, Oil & Gas and Other Industrial/Technical in Metric Tons
Chart 222: Glance at 2015, 2018 and 2024 South Korean Microbial-fermented Hydrocolloids Volume Market Share (%) by End-use Application – Food & Beverages, Cosmetics & Personal Care, Pharma & Health Care, Oil & Gas and Other Industrial/Technical
Chart 223: South Korean Microbial-fermented Hydrocolloids Market Analysis (2015-2024) by End-use Application – Food & Beverages, Cosmetics & Personal Care, Pharma & Health Care, Oil & Gas and Other Industrial/Technical in USD Million
Chart 224: Glance at 2015, 2018 and 2024 South Korean Microbial-fermented Hydrocolloids Value Market Share (%) by End-use Application – Food & Beverages, Cosmetics & Personal Care, Pharma & Health Care, Oil & Gas and Other Industrial/Technical
Chart 225: South Korean Plant-derived Hydrocolloids Market Analysis (2015-2024) by Product Type – Guar Gum, Gum Arabic, LBG, Tara Gum and Pectin in Metric Tons
Chart 226: Glance at 2015, 2018 and 2024 South Korean Plant-derived Hydrocolloids Volume Market Share (%) by Product Type – Guar Gum, Gum Arabic, LBG, Tara Gum and Pectin
Chart 227: South Korean Plant-derived Hydrocolloids Market Analysis (2015-2024) by Product Type – Guar Gum, Gum Arabic, LBG, Tara Gum and Pectin in USD Million
Chart 228: Glance at 2015, 2018 and 2024 South Korean Plant-derived Hydrocolloids Value Market Share (%) by Product Type – Guar Gum, Gum Arabic, LBG, Tara Gum and Pectin
Chart 229: South Korean Plant-derived Hydrocolloids Market Analysis (2015-2024) by End-use Application – Animal Feed, Food & Beverages, Cosmetics & Personal Care, Pharma & Healthcare, Oil & Gas and Other Industrial/Technical in Metric Tons
Chart 230: Glance at 2015, 2018 and 2024 South Korean Plant-derived Hydrocolloids Volume Market Share (%) by End-use Application – Animal Feed, Food & Beverages, Cosmetics & Personal Care, Pharma & Healthcare, Oil & Gas and Other Industrial/Technical
Chart 231: South Korean Plant-derived Hydrocolloids Market Analysis (2015-2024) by End-use Application – Animal Feed, Food & Beverages, Cosmetics & Personal Care, Pharma & Healthcare, Oil & Gas and Other Industrial/Technical in USD Million
Chart 232: Glance at 2015, 2018 and 2024 South Korean Plant-derived Hydrocolloids Value Market Share (%) by End-use Application – Animal Feed, Food & Beverages, Cosmetics & Personal Care, Pharma & Healthcare, Oil & Gas and Other Industrial/Technical
Chart 233: South Korean Seaweed Hydrocolloids Market Analysis (2015-2024) by Product Type – Agar-Agar, Alginates and Carrageenan in Metric Tons
Chart 234: Glance at 2015, 2018 and 2024 South Korean Seaweed Hydrocolloids Volume Market Share (%) by Product Type – Agar-Agar, Alginates and Carrageenan
Chart 235: South Korean Seaweed Hydrocolloids Market Analysis (2015-2024) by Product Type – Agar-Agar, Alginates and Carrageenan in USD Million
Chart 236: Glance at 2015, 2018 and 2024 South Korean Seaweed Hydrocolloids Value Market Share (%) by Product Type – Agar-Agar, Alginates and Carrageenan
Chart 237: South Korean Seaweed Hydrocolloids Market Analysis (2015-2024) by End-use Application – Animal Feed, Food & Beverages, Cosmetics & Personal Care, Pharma & Health Care and Industrial/Technical in Metric Tons
Chart 238: Glance at 2015, 2018 and 2024 South Korean Seaweed Hydrocolloids Volume Market Share (%) by End-use Application – Animal Feed, Food & Beverages, Cosmetics & Personal Care, Pharma & Health Care and Industrial/Technical
Chart 239: South Korean Seaweed Hydrocolloids Market Analysis (2015-2024) by End-use Application – Animal Feed, Food & Beverages, Cosmetics & Personal Care, Pharma & Health Care and Industrial/Technical in USD Million
Chart 240: Glance at 2015, 2018 and 2024 South Korean Seaweed Hydrocolloids Value Market Share (%) by End-use Application – Animal Feed, Food & Beverages, Cosmetics & Personal Care, Pharma & Health Care and Industrial/Technical
Chart 241: South Korean Cellulose-based Hydrocolloids Market Analysis (2015-2024) by Product Type – CMC, MC/HPMC and MCC in Metric Tons
Chart 242: Glance at 2015, 2018 and 2024 South Korean Cellulose-based Hydrocolloids Volume Market Share (%) by Product Type – CMC, MC/HPMC and MCC
Chart 243: South Korean Cellulose-based Hydrocolloids Market Analysis (2015-2024) by Product Type – CMC, MC/HPMC and MCC in USD Million
Chart 244: Glance at 2015, 2018 and 2024 South Korean Cellulose-based Hydrocolloids Value Market Share (%) by Product Type – CMC, MC/HPMC and MCC
Chart 245: South Korean Cellulose-based Hydrocolloids Market Analysis (2015-2024) by End-use Application – Construction, Food & Beverages, Cosmetics & Personal Care, Pharma & Nutraceuticals, Oil & Gas and Other Industrial/Technical in Metric Tons
Chart 246: Glance at 2015, 2018 and 2024 South Korean Cellulose-based Hydrocolloids Volume Market Share (%) by End-use Application – Construction, Food & Beverages, Cosmetics & Personal Care, Pharma & Nutraceuticals, Oil & Gas and Other Industrial/Technical
Chart 247: South Korean Cellulose-based Hydrocolloids Market Analysis (2015-2024) by End-use Application – Construction, Food & Beverages, Cosmetics & Personal Care, Pharma & Nutraceuticals, Oil & Gas and Other Industrial/Technical in USD Million
Chart 248: Glance at 2015, 2018 and 2024 South Korean Cellulose-based Hydrocolloids Value Market Share (%) by End-use Application – Construction, Food & Beverages, Cosmetics & Personal Care, Pharma & Nutraceuticals, Oil & Gas and Other Industrial/Technical
MALAYSIA
Chart 249: Malaysian Hydrocolloids Market Analysis (2015-2024) by Volume in Metric Tons and Value in USD Million
Chart 250: Malaysian Hydrocolloids Market Analysis (2015-2024) by End-use Application – Animal Feed, Food & Beverages, Cosmetics & Personal Care, Pharma & Healthcare, Oil & Gas and Industrial/Technical in Metric Tons
Chart 251: Glance at 2015, 2018 and 2024 Malaysian Hydrocolloids Volume Market Share (%) by End-use Application – Animal Feed, Food & Beverages, Cosmetics & Personal Care, Pharma & Healthcare, Oil & Gas and Industrial/Technical
Chart 252: Malaysian Hydrocolloids Market Analysis (2015-2024) by End-use Application – Animal Feed, Food & Beverages, Cosmetics & Personal Care, Pharma & Healthcare, Oil & Gas and Industrial/Technical in USD Million
Chart 253: Glance at 2015, 2018 and 2024 Malaysian Hydrocolloids Value Market Share (%) by End-use Application – Animal Feed, Food & Beverages, Cosmetics & Personal Care, Pharma & Healthcare, Oil & Gas and Industrial/Technical
Chart 254: Malaysian Hydrocolloids Market Analysis (2015-2024) by Raw Material Source – Animal-derived (Gelatin), Microbial-fermented, Plant-derived, Seaweed-derived and Cellulose-based in Metric Tons
Chart 255: Glance at 2015, 2018 and 2024 Malaysian Hydrocolloids Volume Market Share (%) by Raw Material Source – Animal-derived (Gelatin), Microbial-fermented, Plant-derived, Seaweed-derived and Cellulose-based
Chart 256: Malaysian Hydrocolloids Market Analysis (2015-2024) by Raw Material Source – Animal-derived (Gelatin), Microbial-fermented, Plant-derived, Seaweed-derived and Cellulose-based in USD Million
Chart 257: Glance at 2015, 2018 and 2024 Malaysian Hydrocolloids Value Market Share (%) by Raw Material Source – Animal-derived (Gelatin), Microbial-fermented, Plant-derived, Seaweed-derived and Cellulose-based
Chart 258: Malaysian Gelatin Market Analysis (2015-2024) by End-use Application – Food & Beverages, Cosmetics & Personal Care, Pharmaceuticals, Nutraceuticals, Technical and Animal Feed in Metric Tons
Chart 259: Glance at 2015, 2018 and 2024 Malaysian Gelatin Volume Market Share (%) by End-use Application – Food & Beverages, Cosmetics & Personal Care, Pharmaceuticals, Nutraceuticals, Technical and Animal Feed
Chart 260: Malaysian Gelatin Market Analysis (2015-2024) by End-use Application – Food & Beverages, Cosmetics & Personal Care, Pharmaceuticals, Nutraceuticals, Technical and Animal Feed in USD Million
Chart 261: Glance at 2015, 2018 and 2024 Malaysian Gelatin Value Market Share (%) by End-use Application – Food & Beverages, Cosmetics & Personal Care, Pharmaceuticals, Nutraceuticals, Technical and Animal Feed
Chart 262: Malaysian Microbial-fermented Hydrocolloids Market Analysis (2015-2024) by Product Type – Xanthan Gum and Gellan Gum in Metric Tons
Chart 263: Glance at 2015, 2018 and 2024 Malaysian Microbial-fermented Hydrocolloids Volume Market Share (%) by Product Type – Xanthan Gum and Gellan Gum
Chart 264: Malaysian Microbial-fermented Hydrocolloids Market Analysis (2015-2024) by Product Type – Xanthan Gum and Gellan Gum in USD Million
Chart 265: Glance at 2015, 2018 and 2024 Malaysian Microbial-fermented Hydrocolloids Value Market Share (%) by Product Type – Xanthan Gum and Gellan Gum
Chart 266: Malaysian Microbial-fermented Hydrocolloids Market Analysis (2015-2024) by End-use Application – Food & Beverages, Cosmetics & Personal Care, Pharma & Health Care, Oil & Gas and Other Industrial/Technical in Metric Tons
Chart 267: Glance at 2015, 2018 and 2024 Malaysian Microbial-fermented Hydrocolloids Volume Market Share (%) by End-use Application – Food & Beverages, Cosmetics & Personal Care, Pharma & Health Care, Oil & Gas and Other Industrial/Technical
Chart 268: Malaysian Microbial-fermented Hydrocolloids Market Analysis (2015-2024) by End-use Application – Food & Beverages, Cosmetics & Personal Care, Pharma & Health Care, Oil & Gas and Other Industrial/Technical in USD Million
Chart 269: Glance at 2015, 2018 and 2024 Malaysian Microbial-fermented Hydrocolloids Value Market Share (%) by End-use Application – Food & Beverages, Cosmetics & Personal Care, Pharma & Health Care, Oil & Gas and Other Industrial/Technical
Chart 270: Malaysian Plant-derived Hydrocolloids Market Analysis (2015-2024) by Product Type – Guar Gum, Gum Arabic, LBG, Tara Gum and Pectin in Metric Tons
Chart 271: Glance at 2015, 2018 and 2024 Malaysian Plant-derived Hydrocolloids Volume Market Share (%) by Product Type – Guar Gum, Gum Arabic, LBG, Tara Gum and Pectin
Chart 272: Malaysian Plant-derived Hydrocolloids Market Analysis (2015-2024) by Product Type – Guar Gum, Gum Arabic, LBG, Tara Gum and Pectin in USD Million
Chart 273: Glance at 2015, 2018 and 2024 Malaysian Plant-derived Hydrocolloids Value Market Share (%) by Product Type – Guar Gum, Gum Arabic, LBG, Tara Gum and Pectin
Chart 274: Malaysian Plant-derived Hydrocolloids Market Analysis (2015-2024) by End-use Application – Animal Feed, Food & Beverages, Cosmetics & Personal Care, Pharma & Healthcare, Oil & Gas and Other Industrial/Technical in Metric Tons
Chart 275: Glance at 2015, 2018 and 2024 Malaysian Plant-derived Hydrocolloids Volume Market Share (%) by End-use Application – Animal Feed, Food & Beverages, Cosmetics & Personal Care, Pharma & Healthcare, Oil & Gas and Other Industrial/Technical
Chart 276: Malaysian Plant-derived Hydrocolloids Market Analysis (2015-2024) by End-use Application – Animal Feed, Food & Beverages, Cosmetics & Personal Care, Pharma & Healthcare, Oil & Gas and Other Industrial/Technical in USD Million
Chart 277: Glance at 2015, 2018 and 2024 Malaysian Plant-derived Hydrocolloids Value Market Share (%) by End-use Application – Animal Feed, Food & Beverages, Cosmetics & Personal Care, Pharma & Healthcare, Oil & Gas and Other Industrial/Technical
Chart 278: Malaysian Seaweed Hydrocolloids Market Analysis (2015-2024) by Product Type – Agar-Agar, Alginates and Carrageenan in Metric Tons
Chart 279: Glance at 2015, 2018 and 2024 Malaysian Seaweed Hydrocolloids Volume Market Share (%) by Product Type – Agar-Agar, Alginates and Carrageenan
Chart 280: Malaysian Seaweed Hydrocolloids Market Analysis (2015-2024) by Product Type – Agar-Agar, Alginates and Carrageenan in USD Million
Chart 281: Glance at 2015, 2018 and 2024 Malaysian Seaweed Hydrocolloids Value Market Share (%) by Product Type – Agar-Agar, Alginates and Carrageenan
Chart 282: Malaysian Seaweed Hydrocolloids Market Analysis (2015-2024) by End-use Application – Animal Feed, Food & Beverages, Cosmetics & Personal Care, Pharma & Health Care and Industrial/Technical in Metric Tons
Chart 283: Glance at 2015, 2018 and 2024 Malaysian Seaweed Hydrocolloids Volume Market Share (%) by End-use Application – Animal Feed, Food & Beverages, Cosmetics & Personal Care, Pharma & Health Care and Industrial/Technical
Chart 284: Malaysian Seaweed Hydrocolloids Market Analysis (2015-2024) by End-use Application – Animal Feed, Food & Beverages, Cosmetics & Personal Care, Pharma & Health Care and Industrial/Technical in USD Million
Chart 285: Glance at 2015, 2018 and 2024 Malaysian Seaweed Hydrocolloids Value Market Share (%) by End-use Application – Animal Feed, Food & Beverages, Cosmetics & Personal Care, Pharma & Health Care and Industrial/Technical
Chart 286: Malaysian Cellulose-based Hydrocolloids Market Analysis (2015-2024) by Product Type – CMC, MC/HPMC and MCC in Metric Tons
Chart 287: Glance at 2015, 2018 and 2024 Malaysian Cellulose-based Hydrocolloids Volume Market Share (%) by Product Type – CMC, MC/HPMC and MCC
Chart 288: Malaysian Cellulose-based Hydrocolloids Market Analysis (2015-2024) by Product Type – CMC, MC/HPMC and MCC in USD Million
Chart 289: Glance at 2015, 2018 and 2024 Malaysian Cellulose-based Hydrocolloids Value Market Share (%) by Product Type – CMC, MC/HPMC and MCC
Chart 290: Malaysian Cellulose-based Hydrocolloids Market Analysis (2015-2024) by End-use Application – Construction, Food & Beverages, Cosmetics & Personal Care, Pharma & Nutraceuticals, Oil & Gas and Other Industrial/Technical in Metric Tons
Chart 291: Glance at 2015, 2018 and 2024 Malaysian Cellulose-based Hydrocolloids Volume Market Share (%) by End-use Application – Construction, Food & Beverages, Cosmetics & Personal Care, Pharma & Nutraceuticals, Oil & Gas and Other Industrial/Technical
Chart 292: Malaysian Cellulose-based Hydrocolloids Market Analysis (2015-2024) by End-use Application – Construction, Food & Beverages, Cosmetics & Personal Care, Pharma & Nutraceuticals, Oil & Gas and Other Industrial/Technical in USD Million
Chart 293: Glance at 2015, 2018 and 2024 Malaysian Cellulose-based Hydrocolloids Value Market Share (%) by End-use Application – Construction, Food & Beverages, Cosmetics & Personal Care, Pharma & Nutraceuticals, Oil & Gas and Other Industrial/Technical
THAILAND
Chart 294: Thailand Hydrocolloids Market Analysis (2015-2024) by Volume in Metric Tons and Value in USD Million
Chart 295: Thailand Hydrocolloids Market Analysis (2015-2024) by End-use Application – Animal Feed, Food & Beverages, Cosmetics & Personal Care, Pharma & Healthcare, Oil & Gas and Industrial/Technical in Metric Tons
Chart 296: Glance at 2015, 2018 and 2024 Thailand Hydrocolloids Volume Market Share (%) by End-use Application – Animal Feed, Food & Beverages, Cosmetics & Personal Care, Pharma & Healthcare, Oil & Gas and Industrial/Technical
Chart 297: Thailand Hydrocolloids Market Analysis (2015-2024) by End-use Application – Animal Feed, Food & Beverages, Cosmetics & Personal Care, Pharma & Healthcare, Oil & Gas and Industrial/Technical in USD Million
Chart 298: Glance at 2015, 2018 and 2024 Thailand Hydrocolloids Value Market Share (%) by End-use Application – Animal Feed, Food & Beverages, Cosmetics & Personal Care, Pharma & Healthcare, Oil & Gas and Industrial/Technical
Chart 299: Thailand Hydrocolloids Market Analysis (2015-2024) by Raw Material Source – Animal-derived (Gelatin), Microbial-fermented, Plant-derived, Seaweed-derived and Cellulose-based in Metric Tons
Chart 300: Glance at 2015, 2018 and 2024 Thailand Hydrocolloids Volume Market Share (%) by Raw Material Source – Animal-derived (Gelatin), Microbial-fermented, Plant-derived, Seaweed-derived and Cellulose-based
Chart 301: Thailand Hydrocolloids Market Analysis (2015-2024) by Raw Material Source – Animal-derived (Gelatin), Microbial-fermented, Plant-derived, Seaweed-derived and Cellulose-based in USD Million
Chart 302: Glance at 2015, 2018 and 2024 Thailand Hydrocolloids Value Market Share (%) by Raw Material Source – Animal-derived (Gelatin), Microbial-fermented, Plant-derived, Seaweed-derived and Cellulose-based
Chart 303: Thailand Gelatin Market Analysis (2015-2024) by End-use Application – Food & Beverages, Cosmetics & Personal Care, Pharmaceuticals, Nutraceuticals, Technical and Animal Feed in Metric Tons
Chart 304: Glance at 2015, 2018 and 2024 Thailand Gelatin Volume Market Share (%) by End-use Application – Food & Beverages, Cosmetics & Personal Care, Pharmaceuticals, Nutraceuticals, Technical and Animal Feed
Chart 305: Thailand Gelatin Market Analysis (2015-2024) by End-use Application – Food & Beverages, Cosmetics & Personal Care, Pharmaceuticals, Nutraceuticals, Technical and Animal Feed in USD Million
Chart 306: Glance at 2015, 2018 and 2024 Thailand Gelatin Value Market Share (%) by End-use Application – Food & Beverages, Cosmetics & Personal Care, Pharmaceuticals, Nutraceuticals, Technical and Animal Feed
Chart 307: Thailand Microbial-fermented Hydrocolloids Market Analysis (2015-2024) by Product Type – Xanthan Gum and Gellan Gum in Metric Tons
Chart 308: Glance at 2015, 2018 and 2024 Thailand Microbial-fermented Hydrocolloids Volume Market Share (%) by Product Type – Xanthan Gum and Gellan Gum
Chart 309: Thailand Microbial-fermented Hydrocolloids Market Analysis (2015-2024) by Product Type – Xanthan Gum and Gellan Gum in USD Million
Chart 310: Glance at 2015, 2018 and 2024 Thailand Microbial-fermented Hydrocolloids Value Market Share (%) by Product Type – Xanthan Gum and Gellan Gum
Chart 311: Thailand Microbial-fermented Hydrocolloids Market Analysis (2015-2024) by End-use Application – Food & Beverages, Cosmetics & Personal Care, Pharma & Health Care, Oil & Gas and Other Industrial/Technical in Metric Tons
Chart 312: Glance at 2015, 2018 and 2024 Thailand Microbial-fermented Hydrocolloids Volume Market Share (%) by End-use Application – Food & Beverages, Cosmetics & Personal Care, Pharma & Health Care, Oil & Gas and Other Industrial/Technical
Chart 313: Thailand Microbial-fermented Hydrocolloids Market Analysis (2015-2024) by End-use Application – Food & Beverages, Cosmetics & Personal Care, Pharma & Health Care, Oil & Gas and Other Industrial/Technical in USD Million
Chart 314: Glance at 2015, 2018 and 2024 Thailand Microbial-fermented Hydrocolloids Value Market Share (%) by End-use Application – Food & Beverages, Cosmetics & Personal Care, Pharma & Health Care, Oil & Gas and Other Industrial/Technical
Chart 315: Thailand Plant-derived Hydrocolloids Market Analysis (2015-2024) by Product Type – Guar Gum, Gum Arabic, LBG, Tara Gum and Pectin in Metric Tons
Chart 316: Glance at 2015, 2018 and 2024 Thailand Plant-derived Hydrocolloids Volume Market Share (%) by Product Type – Guar Gum, Gum Arabic, LBG, Tara Gum and Pectin
Chart 317: Thailand Plant-derived Hydrocolloids Market Analysis (2015-2024) by Product Type – Guar Gum, Gum Arabic, LBG, Tara Gum and Pectin in USD Million
Chart 318: Glance at 2015, 2018 and 2024 Thailand Plant-derived Hydrocolloids Value Market Share (%) by Product Type – Guar Gum, Gum Arabic, LBG, Tara Gum and Pectin
Chart 319: Thailand Plant-derived Hydrocolloids Market Analysis (2015-2024) by End-use Application – Animal Feed, Food & Beverages, Cosmetics & Personal Care, Pharma & Healthcare, Oil & Gas and Other Industrial/Technical in Metric Tons
Chart 320: Glance at 2015, 2018 and 2024 Thailand Plant-derived Hydrocolloids Volume Market Share (%) by End-use Application – Animal Feed, Food & Beverages, Cosmetics & Personal Care, Pharma & Healthcare, Oil & Gas and Other Industrial/Technical
Chart 321: Thailand Plant-derived Hydrocolloids Market Analysis (2015-2024) by End-use Application – Animal Feed, Food & Beverages, Cosmetics & Personal Care, Pharma & Healthcare, Oil & Gas and Other Industrial/Technical in USD Million
Chart 322: Glance at 2015, 2018 and 2024 Thailand Plant-derived Hydrocolloids Value Market Share (%) by End-use Application – Animal Feed, Food & Beverages, Cosmetics & Personal Care, Pharma & Healthcare, Oil & Gas and Other Industrial/Technical
Chart 323: Thailand Seaweed Hydrocolloids Market Analysis (2015-2024) by Product Type – Agar-Agar, Alginates and Carrageenan in Metric Tons
Chart 324: Glance at 2015, 2018 and 2024 Thailand Seaweed Hydrocolloids Volume Market Share (%) by Product Type – Agar-Agar, Alginates and Carrageenan
Chart 325: Thailand Seaweed Hydrocolloids Market Analysis (2015-2024) by Product Type – Agar-Agar, Alginates and Carrageenan in USD Million
Chart 326: Glance at 2015, 2018 and 2024 Thailand Seaweed Hydrocolloids Value Market Share (%) by Product Type – Agar-Agar, Alginates and Carrageenan
Chart 327: Thailand Seaweed Hydrocolloids Market Analysis (2015-2024) by End-use Application – Animal Feed, Food & Beverages, Cosmetics & Personal Care, Pharma & Health Care and Industrial/Technical in Metric Tons
Chart 328: Glance at 2015, 2018 and 2024 Thailand Seaweed Hydrocolloids Volume Market Share (%) by End-use Application – Animal Feed, Food & Beverages, Cosmetics & Personal Care, Pharma & Health Care and Industrial/Technical
Chart 329: Thailand Seaweed Hydrocolloids Market Analysis (2015-2024) by End-use Application – Animal Feed, Food & Beverages, Cosmetics & Personal Care, Pharma & Health Care and Industrial/Technical in USD Million
Chart 330: Glance at 2015, 2018 and 2024 Thailand Seaweed Hydrocolloids Value Market Share (%) by End-use Application – Animal Feed, Food & Beverages, Cosmetics & Personal Care, Pharma & Health Care and Industrial/Technical
Chart 331: Thailand Cellulose-based Hydrocolloids Market Analysis (2015-2024) by Product Type – CMC, MC/HPMC and MCC in Metric Tons
Chart 332: Glance at 2015, 2018 and 2024 Thailand Cellulose-based Hydrocolloids Volume Market Share (%) by Product Type – CMC, MC/HPMC and MCC
Chart 333: Thailand Cellulose-based Hydrocolloids Market Analysis (2015-2024) by Product Type – CMC, MC/HPMC and MCC in USD Million
Chart 334: Glance at 2015, 2018 and 2024 Thailand Cellulose-based Hydrocolloids Value Market Share (%) by Product Type – CMC, MC/HPMC and MCC
Chart 335: Thailand Cellulose-based Hydrocolloids Market Analysis (2015-2024) by End-use Application – Construction, Food & Beverages, Cosmetics & Personal Care, Pharma & Nutraceuticals, Oil & Gas and Other Industrial/Technical in Metric Tons
Chart 336: Glance at 2015, 2018 and 2024 Thailand Cellulose-based Hydrocolloids Volume Market Share (%) by End-use Application – Construction, Food & Beverages, Cosmetics & Personal Care, Pharma & Nutraceuticals, Oil & Gas and Other Industrial/Technical
Chart 337: Thailand Cellulose-based Hydrocolloids Market Analysis (2015-2024) by End-use Application – Construction, Food & Beverages, Cosmetics & Personal Care, Pharma & Nutraceuticals, Oil & Gas and Other Industrial/Technical in USD Million
Chart 338: Glance at 2015, 2018 and 2024 Thailand Cellulose-based Hydrocolloids Value Market Share (%) by End-use Application – Construction, Food & Beverages, Cosmetics & Personal Care, Pharma & Nutraceuticals, Oil & Gas and Other Industrial/Technical
REST OF ASIA-PACIFIC
Chart 339: Rest of Asia-Pacific Hydrocolloids Market Analysis (2015-2024) by Volume in Metric Tons and Value in USD Million
Chart 340: Rest of Asia-Pacific Hydrocolloids Market Analysis (2015-2024) by End-use Application – Animal Feed, Food & Beverages, Cosmetics & Personal Care, Pharma & Healthcare, Oil & Gas and Industrial/Technical in Metric Tons
Chart 341: Glance at 2015, 2018 and 2024 Rest of Asia-Pacific Hydrocolloids Volume Market Share (%) by End-use Application – Animal Feed, Food & Beverages, Cosmetics & Personal Care, Pharma & Healthcare, Oil & Gas and Industrial/Technical
Chart 342: Rest of Asia-Pacific Hydrocolloids Market Analysis (2015-2024) by End-use Application – Animal Feed, Food & Beverages, Cosmetics & Personal Care, Pharma & Healthcare, Oil & Gas and Industrial/Technical in USD Million
Chart 343: Glance at 2015, 2018 and 2024 Rest of Asia-Pacific Hydrocolloids Value Market Share (%) by End-use Application – Animal Feed, Food & Beverages, Cosmetics & Personal Care, Pharma & Healthcare, Oil & Gas and Industrial/Technical
Chart 344: Rest of Asia-Pacific Hydrocolloids Market Analysis (2015-2024) by Raw Material Source – Animal-derived (Gelatin), Microbial-fermented, Plant-derived, Seaweed-derived and Cellulose-based in Metric Tons
Chart 345: Glance at 2015, 2018 and 2024 Rest of Asia-Pacific Hydrocolloids Volume Market Share (%) by Raw Material Source – Animal-derived (Gelatin), Microbial-fermented, Plant-derived, Seaweed-derived and Cellulose-based
Chart 346: Rest of Asia-Pacific Hydrocolloids Market Analysis (2015-2024) by Raw Material Source – Animal-derived (Gelatin), Microbial-fermented, Plant-derived, Seaweed-derived and Cellulose-based in USD Million
Chart 347: Glance at 2015, 2018 and 2024 Rest of Asia-Pacific Hydrocolloids Value Market Share (%) by Raw Material Source – Animal-derived (Gelatin), Microbial-fermented, Plant-derived, Seaweed-derived and Cellulose-based
Chart 348: Rest of Asia-Pacific Gelatin Market Analysis (2015-2024) by End-use Application – Food & Beverages, Cosmetics & Personal Care, Pharmaceuticals, Nutraceuticals, Technical and Animal Feed in Metric Tons
Chart 349: Glance at 2015, 2018 and 2024 Rest of Asia-Pacific Gelatin Volume Market Share (%) by End-use Application – Food & Beverages, Cosmetics & Personal Care, Pharmaceuticals, Nutraceuticals, Technical and Animal Feed
Chart 350: Rest of Asia-Pacific Gelatin Market Analysis (2015-2024) by End-use Application – Food & Beverages, Cosmetics & Personal Care, Pharmaceuticals, Nutraceuticals, Technical and Animal Feed in USD Million
Chart 351: Glance at 2015, 2018 and 2024 Rest of Asia-Pacific Gelatin Value Market Share (%) by End-use Application – Food & Beverages, Cosmetics & Personal Care, Pharmaceuticals, Nutraceuticals, Technical and Animal Feed
Chart 352: Rest of Asia-Pacific Microbial-fermented Hydrocolloids Market Analysis (2015-2024) by Product Type – Xanthan Gum and Gellan Gum in Metric Tons
Chart 353: Glance at 2015, 2018 and 2024 Rest of Asia-Pacific Microbial-fermented Hydrocolloids Volume Market Share (%) by Product Type – Xanthan Gum and Gellan Gum
Chart 354: Rest of Asia-Pacific Microbial-fermented Hydrocolloids Market Analysis (2015-2024) by Product Type – Xanthan Gum and Gellan Gum in USD Million
Chart 355: Glance at 2015, 2018 and 2024 Rest of Asia-Pacific Microbial-fermented Hydrocolloids Value Market Share (%) by Product Type – Xanthan Gum and Gellan Gum
Chart 356: Rest of Asia-Pacific Microbial-fermented Hydrocolloids Market Analysis (2015-2024) by End-use Application – Food & Beverages, Cosmetics & Personal Care, Pharma & Health Care, Oil & Gas and Other Industrial/Technical in Metric Tons
Chart 357: Glance at 2015, 2018 and 2024 Rest of Asia-Pacific Microbial-fermented Hydrocolloids Volume Market Share (%) by End-use Application – Food & Beverages, Cosmetics & Personal Care, Pharma & Health Care, Oil & Gas and Other Industrial/Technical
Chart 358: Rest of Asia-Pacific Microbial-fermented Hydrocolloids Market Analysis (2015-2024) by End-use Application – Food & Beverages, Cosmetics & Personal Care, Pharma & Health Care, Oil & Gas and Other Industrial/Technical in USD Million
Chart 359: Glance at 2015, 2018 and 2024 Rest of Asia-Pacific Microbial-fermented Hydrocolloids Value Market Share (%) by End-use Application – Food & Beverages, Cosmetics & Personal Care, Pharma & Health Care, Oil & Gas and Other Industrial/Technical
Chart 360: Rest of Asia-Pacific Plant-derived Hydrocolloids Market Analysis (2015-2024) by Product Type – Guar Gum, Gum Arabic, LBG, Tara Gum and Pectin in Metric Tons
Chart 361: Glance at 2015, 2018 and 2024 Rest of Asia-Pacific Plant-derived Hydrocolloids Volume Market Share (%) by Product Type – Guar Gum, Gum Arabic, LBG, Tara Gum and Pectin
Chart 362: Rest of Asia-Pacific Plant-derived Hydrocolloids Market Analysis (2015-2024) by Product Type – Guar Gum, Gum Arabic, LBG, Tara Gum and Pectin in USD Million
Chart 363: Glance at 2015, 2018 and 2024 Rest of Asia-Pacific Plant-derived Hydrocolloids Value Market Share (%) by Product Type – Guar Gum, Gum Arabic, LBG, Tara Gum and Pectin
Chart 364: Rest of Asia-Pacific Plant-derived Hydrocolloids Market Analysis (2015-2024) by End-use Application – Animal Feed, Food & Beverages, Cosmetics & Personal Care, Pharma & Healthcare, Oil & Gas and Other Industrial/Technical in Metric Tons
Chart 365: Glance at 2015, 2018 and 2024 Rest of Asia-Pacific Plant-derived Hydrocolloids Volume Market Share (%) by End-use Application – Animal Feed, Food & Beverages, Cosmetics & Personal Care, Pharma & Healthcare, Oil & Gas and Other Industrial/Technical
Chart 366: Rest of Asia-Pacific Plant-derived Hydrocolloids Market Analysis (2015-2024) by End-use Application – Animal Feed, Food & Beverages, Cosmetics & Personal Care, Pharma & Healthcare, Oil & Gas and Other Industrial/Technical in USD Million
Chart 367: Glance at 2015, 2018 and 2024 Rest of Asia-Pacific Plant-derived Hydrocolloids Value Market Share (%) by End-use Application – Animal Feed, Food & Beverages, Cosmetics & Personal Care, Pharma & Healthcare, Oil & Gas and Other Industrial/Technical
Chart 368: Rest of Asia-Pacific Seaweed Hydrocolloids Market Analysis (2015-2024) by Product Type – Agar-Agar, Alginates and Carrageenan in Metric Tons
Chart 369: Glance at 2015, 2018 and 2024 Rest of Asia-Pacific Seaweed Hydrocolloids Volume Market Share (%) by Product Type – Agar-Agar, Alginates and Carrageenan
Chart 370: Rest of Asia-Pacific Seaweed Hydrocolloids Market Analysis (2015-2024) by Product Type – Agar-Agar, Alginates and Carrageenan in USD Million
Chart 371: Glance at 2015, 2018 and 2024 Rest of Asia-Pacific Seaweed Hydrocolloids Value Market Share (%) by Product Type – Agar-Agar, Alginates and Carrageenan
Chart 372: Rest of Asia-Pacific Seaweed Hydrocolloids Market Analysis (2015-2024) by End-use Application – Animal Feed, Food & Beverages, Cosmetics & Personal Care, Pharma & Health Care and Industrial/Technical in Metric Tons
Chart 373: Glance at 2015, 2018 and 2024 Rest of Asia-Pacific Seaweed Hydrocolloids Volume Market Share (%) by End-use Application – Animal Feed, Food & Beverages, Cosmetics & Personal Care, Pharma & Health Care and Industrial/Technical
Chart 374: Rest of Asia-Pacific Seaweed Hydrocolloids Market Analysis (2015-2024) by End-use Application – Animal Feed, Food & Beverages, Cosmetics & Personal Care, Pharma & Health Care and Industrial/Technical in USD Million
Chart 375: Glance at 2015, 2018 and 2024 Rest of Asia-Pacific Seaweed Hydrocolloids Value Market Share (%) by End-use Application – Animal Feed, Food & Beverages, Cosmetics & Personal Care, Pharma & Health Care and Industrial/Technical
Chart 376: Rest of Asia-Pacific Cellulose-based Hydrocolloids Market Analysis (2015-2024) by Product Type – CMC, MC/HPMC and MCC in Metric Tons
Chart 377: Glance at 2015, 2018 and 2024 Rest of Asia-Pacific Cellulose-based Hydrocolloids Volume Market Share (%) by Product Type – CMC, MC/HPMC and MCC
Chart 378: Rest of Asia-Pacific Cellulose-based Hydrocolloids Market Analysis (2015-2024) by Product Type – CMC, MC/HPMC and MCC in USD Million
Chart 379: Glance at 2015, 2018 and 2024 Rest of Asia-Pacific Cellulose-based Hydrocolloids Value Market Share (%) by Product Type – CMC, MC/HPMC and MCC
Chart 380: Rest of Asia-Pacific Cellulose-based Hydrocolloids Market Analysis (2015-2024) by End-use Application – Construction, Food & Beverages, Cosmetics & Personal Care, Pharma & Nutraceuticals, Oil & Gas and Other Industrial/Technical in Metric Tons
Chart 381: Glance at 2015, 2018 and 2024 Rest of Asia-Pacific Cellulose-based Hydrocolloids Volume Market Share (%) by End-use Application – Construction, Food & Beverages, Cosmetics & Personal Care, Pharma & Nutraceuticals, Oil & Gas and Other Industrial/Technical
Chart 382: Rest of Asia-Pacific Cellulose-based Hydrocolloids Market Analysis (2015-2024) by End-use Application – Construction, Food & Beverages, Cosmetics & Personal Care, Pharma & Nutraceuticals, Oil & Gas and Other Industrial/Technical in USD Million
Chart 383: Glance at 2015, 2018 and 2024 Rest of Asia-Pacific Cellulose-based Hydrocolloids Value Market Share (%) by End-use Application – Construction, Food & Beverages, Cosmetics & Personal Care, Pharma & Nutraceuticals, Oil & Gas and Other Industrial/Technical
Abdullahbhai Abdul Kader Group
Accel Carrageenan Corporation (formerly RICO Philippines)
Accent Microcell Pvt. Ltd.
Agro Gums
Altrafine Gums
Amar Cellulose Industries
Andi-Johnson Group
Anqiu Eagle Cellulose Co., Ltd
Asahi Gelatine Industrial Co., Ltd.
Asahi Kasei Corporation
Baotou Dongbao Bio-Tech Co., Ltd.
Cargill, Inc.
Cellulose Solutions Private Limited
Changshu Wealthy Science and Technology Co., Ltd.
Compania Espanola De Algas Marinas, S.A. (CEAMSA)
CP Kelco U.S., Inc.
Daicel FineChem Ltd.
Daiichi-Kasei Co., Ltd.
Dancheng CAIXIN Sugar Industry Co., Ltd.
Devson Impex Private Limited
DFE Pharma India LLP
Dipti Cellulose Pvt. Ltd.
DKS Co. Ltd.
Drytech Processes (I) Pvt. Ltd.
DSM Hydrocolloids
Dupont Nutrition & Health
Fufeng Group Limited
Fujian Global Ocean Biotechnology Co., Ltd.
Gelita AG
Geltech Co., Ltd.
Godavari Biorefineries Ltd.
Guangrao Liuhe Chemical Co., Ltd.
Haji Dossa Nutralgum (Pvt) Ltd.
Hangzhou Gellan Solutions Biotec Co., Ltd.
Hebei Xinhe Biochemical Co., Ltd
Hindustan Gum & Chemicals Ltd.
Ina Food Industry Co., Ltd.
India Gelatine & Chemicals Ltd
India Glycols Limited
Indian Hydrocolloids (IHC)
Inter Chemical (Shijiazhuang) Co., Ltd.
IRO Alginate Industry Co., Ltd.
Jai Bharat Gum & Chemicals Ltd
Java Biocolloid
Jellice Corporation
JianLong Biotechnology Co., LTD.
Kantilal Brothers
Kapadia Gum Industries Pvt. Ltd.
Karagen Indonesia, CV
KIMICA Corporation
Koei Chemical Co., Ltd.
Krishna Pectins Pvt. Ltd.
Lamberti Hydrocolloids Private Ltd
Lianyungang Zhongda Seaweed Industrial Co., Ltd.
Lotus Gums & Chemicals
Lucid Colloids Ltd.
Madhu Hydrocolloids Pvt. Ltd.
Marcel Trading Corporation
Marine Science Co., Ltd.
MC Food Specialties Inc.
MCPI Corporation
MeiHua Holdings Group Co., Ltd
Meron Group
Mingtai Chemical Co., Ltd.
MSC Co., Ltd.
Nanjing Laienda Biotechnology Co., Ltd. (Lauta)
Narmada Gelatines Ltd.
NB Entrepreneurs
Neelkanth Polymers
New Zealand Seaweeds Limited
Nippi, Inc.
Nippon Paper Industries Co., Ltd.
Nitta Gelatin Inc.
Nouryon
OPAL Biotech Ltd.
Patel Industries
PB Leiner
Philippine Bio Industries, Inc.
Prasmo Agri
Premcem Gums Pvt. Ltd
PT. Agar Swallow
PT. Agarindo Bogatama
PT. Algalindo Perdana
PT. Amarta Carrageenan Indonesia
PT. Arbe Chemindo
PT. Cahaya Cemerlang
PT. Dunia Bintang Walet
PT. Galic Artabahari
PT. Gumindo Perkasa Industri (Indogum)
PT. Hydrocolloid Indonesia
PT. Indo Seaweed
PT. Indoking Aneka Agar-Agar Industri
PT. Kappa Carrageenan Nusantara
PT. Surya Indoalgas
PT. Wahyu Putra Bimasakti
Puning Huey Shyang Seaweed Industrial Co., Ltd.
Qingdao Bright Moon Seaweed Group Co., Ltd.
Qingdao Fengrun Seaweed Co., Ltd.
Qingdao Gather Great Ocean Algae Industry Group
Qingdao Great Chemical Inc.
Qingdao Hyzlin Biology Development Co., Ltd.
Qingdao Unichem International Trade Co., Ltd.
Qingdao Zoranoc Oilfield Chemical Co., Ltd.
Quzhou Pectin Co., Ltd.
Rama Gum Industries (India) Ltd
Rousselot BV
Sammi Industry Co., Ltd.
Shandong Head Co., Ltd.
Shandong Jiejing Group Corporation
Shanghai Brilliant Gum Co., Ltd. (BLG)
Shanghai ShenGuang Edible Chemicals Co., Ltd.
Shemberg Corporation
Shin-Etsu Chemical Co., Ltd.
Shree Ram Gum and Chemicals
Shubhlaxmi Industries
Sichuan Longrun-Newstar Group Co., Ltd.
Sidley Chemical Co., Ltd.
Sigachi Industries Pvt. Ltd.
SNAP Natural & Alginate Products Pvt. Ltd.
Solvay SA
SOMAR Corporation
Sterling Gelatin
Sunita Hydrocolloids Private Limited
Supreme Gums Pvt. Ltd.
Tacara Sdn Bhd
TBK Manufacturing Corporation
The Dow Chemical Company
Urakami Kasei Limited
Vasundhara Industries
Vikas WSP Limited
W Hydrocolloids, Inc. (RICO Carrageenan)
Xiamen Gelken Gelatin Co., Ltd.
Xuzhou Liyuan Cellulose Technology Co. Ltd.
Yantai Sheli Hydrocolloids Co., Ltd.
Yantai Xinwang Seaweed Co., Ltd.
Yasu Chemical Inc.
Yixing Tongda Chemical Co., Ltd.
Zhejiang Chuangfeng Chemical Co., Ltd.
Zhenpai Hydrocolloids Co., Ltd.
Zibo Zhongxuan Biochemical Co., Ltd. (Deosen Biochemical Co., Ltd.)
RELATED REPORTS
Dairy Products Packaging - A Global Market Overview
Report Code: FNB002 | Pages: 382 | Price: $4050
Published
Jul 2026
Xanthan Gum - A Global Market Overview
Report Code: FNB014 | Pages: 310 | Price: $4500
Published
Jul 2026
Global Seaweed Hydrocolloids Market - Agar, Alginates and Carrageenan
Report Code: FNB021 | Pages: 515 | Price: $4500
Published
Jul 2026
Global Hydrocolloids Market – Raw Materials, Products and Applications
Report Code: FNB024 | Pages: 660 | Price: $4860
Published
Jul 2026