Global Hydrocolloids Market Trends and Outlook
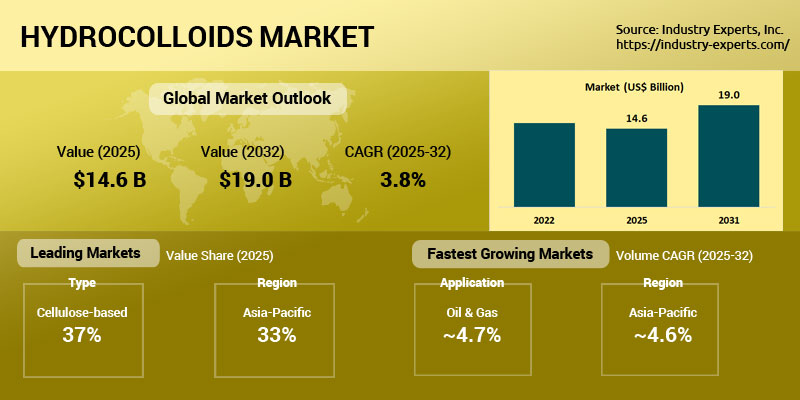
Hydrocolloids are multifunctional ingredients widely used as thickening, stabilizing, gelling, emulsifying, binding, and water-retention agents across food & beverages, pharmaceuticals, cosmetics, oil & gas, animal feed, and industrial applications. The global Hydrocolloids market reached US$14.6 billion in 2025 and is projected to achieve 3.5 million metric tons and nearly US$19 billion by 2032, expanding at CAGR of 3.8% in value. Increasing consumer preference for processed foods, convenience meals, clean-label products, plant-based formulations, and functional nutrition continues to strengthen long-term market demand globally.
The Food & Beverages industry remains the largest consumer of hydrocolloids, supported by rising demand for texture enhancement, shelf-life extension, fat replacement, and stabilization solutions in dairy, bakery, confectionery, beverages, sauces, and meat alternatives. Growing pharmaceutical and nutraceutical applications, including capsule production, controlled-release formulations, and dietary supplements, are further driving adoption of gelatin, cellulose derivatives, xanthan gum, pectin, carrageenan, alginates, and other specialty hydrocolloids. Meanwhile, Oil & Gas applications are witnessing strong expansion due to increasing use of rheology modifiers and drilling fluid additives in enhanced oil recovery operations.
Asia-Pacific dominates the global Hydrocolloids market owing to rapid industrialization, strong food manufacturing growth, expanding pharmaceutical production, and rising consumer demand for processed and convenience foods. Plant-derived and microbial-fermented hydrocolloids are emerging as the fastest-growing categories due to increasing preference for vegan, sustainable, and clean-label ingredients. Continuous innovation in multifunctional blends, bio-based formulations, and specialty hydrocolloid systems, along with increasing investments by major global manufacturers, is expected to create strong growth opportunities across both developed and emerging markets during the forecast period.
Top Companies in Hydrocolloids Industry
The Hydrocolloids market is highly competitive and includes major multinational ingredient manufacturers and specialty hydrocolloid producers such as Cargill, Inc., Ingredion Incorporated (TIC Gums), IFF, Tate & Lyle Plc (CP Kelco), GELITA AG, DSM-Firmenich AG, Ashland Global Holdings Inc., Darling Ingredients, Jungbunzlauer Suisse AG, Nexira SAS, CEAMSA, Fufeng Group Limited, and Shin-Etsu Chemical Co., Ltd.
Hydrocolloids Regional Market Analysis
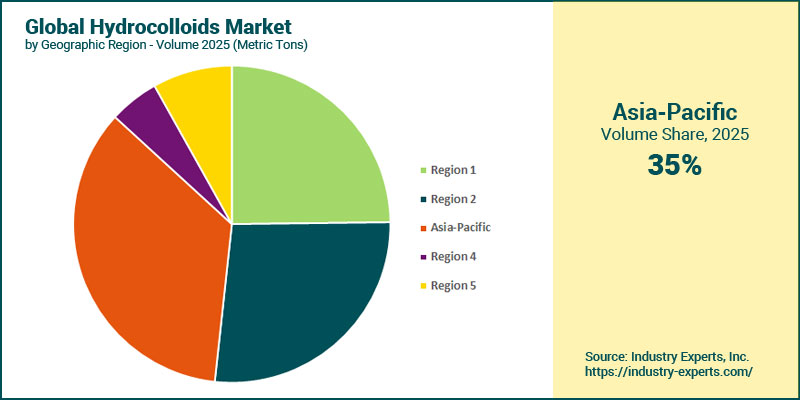
Asia-Pacific dominated the global market with a 35% share in 2025, totaling 935 thousand metric tons, supported by strong food processing industries, rapid industrialization, expanding pharmaceutical manufacturing, rising convenience food consumption, and growing demand for personal care products across China, India, Japan, South Korea, and Southeast Asia. Europe remained the second-largest regional market, closely followed by North America, reflecting mature food ingredient sectors and high adoption of specialty hydrocolloids in nutraceutical, industrial, and clean-label applications. Asia-Pacific also emerged as the fastest-growing region with a CAGR of 4.6% through 2032, driven by increasing investments in processed food production, oil & gas activities, and bio-based ingredient manufacturing, while Rest of World followed owing to rising industrial and energy-sector applications in the Middle East and Africa.
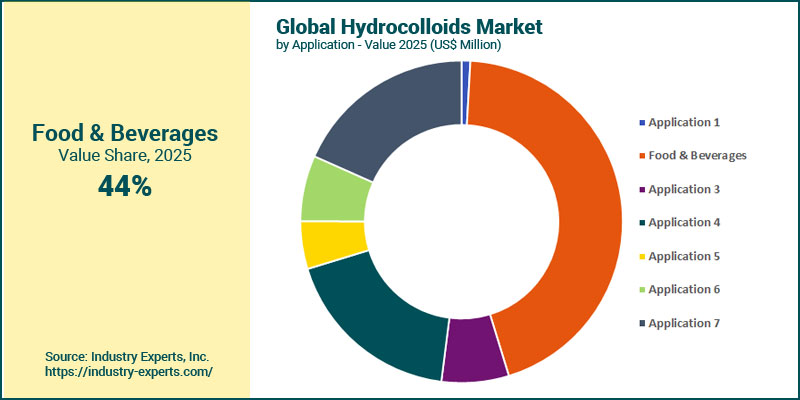
Hydrocolloids Market Analysis by Application
Food & Beverages remained the dominant application segment, accounting for 44.4% of total market value in 2025, supported by strong demand for stabilizers, thickeners, gelling agents, and clean-label ingredients across dairy, bakery, beverages, confectionery, and plant-based products. Pharma & Nutraceuticals represented the second-largest value segment with an 18.3% share, while Oil & Gas also maintained significant contributions due to expanding energy-sector applications. Oil & Gas emerged as the fastest-growing application with CAGR of 4.7% by volume during 2025-2032, closely followed by Food & Beverages, driven by increasing drilling activities, enhanced oil recovery projects, and rising consumption of processed and functional foods globally. Cosmetics & Personal Care and Industrial/Technical applications continued benefiting from growing preference for bio-based multifunctional ingredients.
Hydrocolloids Market Analysis by Raw Material Source
Cellulose-based hydrocolloids dominated the market with a 35.5% share in 2025, totaling 947 thousand metric tons, driven by extensive usage of CMC, MCC, MC, and HPMC across food processing, pharmaceuticals, personal care, construction, and industrial formulations. Plant-derived hydrocolloids represented the second-largest segment and also emerged as the fastest-growing category with a CAGR of 4.6%, closely followed by Microbial-fermented and Seaweed-derived, supported by increasing demand for natural, clean-label, vegan, and sustainable ingredients globally. Rising applications of xanthan gum, gellan gum, guar gum, pectin, carrageenan, and alginates in convenience foods, nutraceuticals, and specialty industrial solutions continue accelerating market expansion. Animal-derived hydrocolloids, primarily gelatin, maintained a significant 17.8% volume share in 2025, benefiting from pharmaceutical capsules, confectionery, and collagen-based applications, although growth remained comparatively moderate due to growing plant-based preferences and evolving dietary trends worldwide.
Hydrocolloids Market Report Scope
This global report on Hydrocolloids analyzes the market based on end-use application for the period 2022-2032 with projections from 2025 to 2032 in terms of volume in metric tons and value in US$. In addition to providing profiles of major companies operating in the Hydrocolloids industry, the latest corporate, product, production capacity and industrial developments have been covered to offer a clear panorama of Hydrocolloids industry.
Key Metrics
| Historical Period: | 2022-2025 | |
| Base Year: | 2025 | |
| Forecast Period: | 2025-2032 | |
| Units: | Volume consumption in metric tons and Value market in US$ | |
| Companies Mentioned: | 240+ |
Global Hydrocolloids Market by Geographic Region
- North America (The United States, Canada and Mexico)
- Europe (France, Germany, Italy, Poland, Russia, Spain, The United Kingdom and Rest of Europe)
- Asia-Pacific (China, India, Indonesia, Japan, South Korea, Malaysia, Thailand and Rest of Asia-Pacific)
- South America (Brazil, Argentina and Rest of South America)
- Rest of World (South Africa, Turkey, and Other Rest of World for all hydrocolloids; Oman, Saudi Arabia and United Arab Emirates for select hydrocolloids)
Global Hydrocolloids Market by Application
- Animal Feed
- Food & Beverages
- Cosmetics & Personal Care
- Pharma & Healthcare
- Oil & Gas
- Industrial/Technical
- Other
Global Hydrocolloids Market by Raw Material Source
- Animal-derived (Gelatin)
- Microbial-fermented
- Plant-derived
- Seaweed-derived
- Cellulose-based
Global Hydrocolloids Market by Product Type
- Gelatin
- Xanthan Gum
- Gellan Gum
- Guar Gum
- Gum Arabic
- Locust Bean Gum (LBG)
- Tara Gum
- Pectin
- Agar-Agar
- Alginates
- Carrageenan
- CMC
- MC & HPMC
- MCC
Hydrocolloids Market Frequently Asked Questions (FAQs)
The global Hydrocolloids market is projected to reach nearly US$19 billion by 2032, increasing from US$14.6 billion in 2025.
Food & Beverages is the leading application segment due to extensive use of hydrocolloids in dairy products, bakery, beverages, confectionery, sauces, and processed foods.
Plant-derived hydrocolloids are expected to witness the fastest growth due to rising demand for clean-label, vegan, and naturally sourced ingredients.
Asia-Pacific currently dominates the Hydrocolloids market and is also projected to remain the fastest-growing regional market through 2032.
Major growth drivers include rising processed food consumption, increasing clean-label demand, expanding pharmaceutical applications, growth in nutraceutical products, and increasing industrial usage across oil & gas and technical sectors.
Leading companies include Cargill, Ingredion, IFF, Tate & Lyle, GELITA, DSM-Firmenich, CEAMSA, Ashland Global Holdings, Nexira, Jungbunzlauer, and Fufeng Group.
The report covers Gelatin, Xanthan Gum, Gellan Gum, Guar Gum, Gum Arabic, Locust Bean Gum, Tara Gum, Pectin, Agar-Agar, Alginates, Carrageenan, CMC, MC & HPMC, and MCC.
PART A: GLOBAL MARKET PERSPECTIVE
1. INTRODUCTION
- Product Outline
- Hydrocolloids
- Types of Hydrocolloids
- Animal-derived Hydrocolloids
- Gelatin
- Applications
- Casein/Caseinates
- Chitin and Chitosan
- Cellulose-derived Hydrocolloids
- Carboxymethyl Cellulose (CMC)
- Applications
- Methyl Cellulose (MC) and Hydroxypropylmethyl Cellulose (HPMC)
- Applications
- Microcrystalline Cellulose (MCC)
- Applications
- Other Cellulose Ethers
- Microbial-fermented Hydrocolloids
- Xanthan Gum
- Applications
- Gellan Gum
- Applications
- Dextran
- Curdlan
- Pullulan
- Plant-derived Hydrocolloids
- Exudate Gums
- Gum Arabic (Acacia Gum)
- Applications
- Gum Tragacanth
- Karaya Gum
- Gum Ghatti
- Seed Extracts
- Guar Gum
- Applications
- Locust Bean Gum (LBG)
- Applications
- Cassia gum
- Tara Gum
- Applications
- Other Seed Extracts
- Pectin
- Types of Pectin
- High Methylated Ester Pectin
- Low Methylated Ester pectin
- Amidated Pectin
- Applications
- Seaweed-derived Hydrocolloids
- Types of Seaweed-derived Hydrocolloids
- Agar-Agar
- Applications
- Alginates
- Applications
- Carrageenan
- Applications
2. KEY MARKET TRENDS
3. KEY GLOBAL PLAYERS
- Algaia S.A.
- Alland& Robert
- Andi-Johnson Group
- Archer-Daniels-Midland Company
- Asahi Kasei Corporation
- Ashland Global Holdings Inc.
- Cargill, Inc.
- CAROB S.A.
- Compania Espanola de Algas Marinas, S.A. (CEAMSA)
- Darling Ingredients (Rousselot, GELNEX)
- Deosen Biochemical (Ordos) Ltd
- DSM-Firmenich AG
- Fufeng Group Limited
- Gelatines Weishardt SAS
- GELITA AG
- Gelymar S.A.
- Hebei Xinhe Biochemical Co., Ltd
- Herbstreith & Fox KG
- Hindustan Gum & Chemicals Ltd.
- Hispanagar, S.A.
- IFF (International Flavors & Fragrances)
- Industrias Roko, S.A.
- Ingredion Incorporated (TIC Gums, Inc.)
- Jai Bharat Gum & Chemicals Ltd
- Jellice Corporation
- Jungbunzlauer Suisse AG
- KIMICA Corporation
- Lamberti SpA
- Marcel Trading Corporation
- MeiHua Holdings Group Co., Ltd
- MSC Co., Ltd.
- Nexira SAS
- Nitta Gelatin Inc.
- Nouryon Specialty Chemicals B.V.
- PB Leiner
- PMC Ouvrie SAS
- QuimicaAmtex S.A.
- Shandong Head Co., Ltd.
- Shandong Jiejing Group Corporation
- Shanghai Brilliant Gum Co., Ltd. (BLG)
- Shin-Etsu Chemical Co., Ltd.
- Silvateam S.p.A.
- Sterling Gelatin
- Tate & Lyle Plc (CP Kelco)
- The Dow Chemical Company
- Vikas WSP Limited
- W Hydrocolloids, Inc. (RICO Carrageenan)
- Zhenpai Hydrocolloids Co., Ltd.
4. KEY BUSINESS AND PRODUCT TRENDS
5. GLOBAL MARKET OVERVIEW
- Global Hydrocolloids Market Overview by Raw Material Source
- Hydrocolloids Raw Material Source Market Overview by Global Region
- Animal-derived Hydrocolloid (Gelatin)
- Microbial-fermented Hydrocolloids
- Plant-derived Hydrocolloids
- Seaweed-derived Hydrocolloids
- Cellulose-based Hydrocolloids
- Global Hydrocolloids Raw Material Source Market Overview by Product Type
- Microbial-fermented Hydrocolloids
- Plant-derived Hydrocolloids
- Seaweed-derived Hydrocolloids
- Cellulose-based Hydrocolloids
- Global Hydrocolloids Market Overview by End-use Application
- Hydrocolloids End-use Application Market Overview by Global Region
- Animal Feed
- Food & Beverages
- Cosmetics & Personal Care
- Pharmaceuticals & Healthcare
- Oil & Gas Applications
- Industrial/Technical Applications
PART B: REGIONAL MARKET PERSPECTIVE
- Global Hydrocolloids Market Overview by Geographic Region
REGIONAL MARKET OVERVIEW
6. NORTH AMERICA
- North American Hydrocolloids Market Overview by Geographic Region
- North American Hydrocolloids Market Overview by End-use Application
- North American Hydrocolloids Market Overview by Raw Material Source
- Animal-derived Hydrocolloids (Gelatin)
- North American Gelatin Market Overview by End-use Application
- Microbial-fermented Hydrocolloids
- North American Microbial-fermented Hydrocolloids Market Overview by Product Type
- North American Microbial-fermented Hydrocolloids Market Overview by End-use Application
- Plant-derived Hydrocolloids
- North American Plant-derived Hydrocolloids Market Overview by Product Type
- North American Plant-derived Hydrocolloids Market Overview by End-use Application
- Seaweed-derived Hydrocolloids
- North American Seaweed Hydrocolloids Market Overview by Product Type
- North American Seaweed Hydrocolloids Market Overview by End-use Application
- Cellulose-based Hydrocolloids
- North American Cellulose-based Hydrocolloids Market Overview by Product Type
- North American Cellulose-based Hydrocolloids Market Overview by End-use Application
7. EUROPE
- European Hydrocolloids Market Overview by Geographic Region
- European Hydrocolloids Market Overview by End-use Application
- European Hydrocolloids Market Overview by Raw Material Source
- Animal-derived Hydrocolloids (Gelatin)
- European Gelatin Market Overview by End-use Application
- Microbial-fermented Hydrocolloids
- European Microbial-fermented Hydrocolloids Market Overview by Product Type
- European Microbial-fermented Hydrocolloids Market Overview by End-use Application
- Plant-derived Hydrocolloids
- European Plant-derived Hydrocolloids Market Overview by Product Type
- European Plant-derived Hydrocolloids Market Overview by End-use Application
- Seaweed-derived Hydrocolloids
- European Seaweed Hydrocolloids Market Overview by Product Type
- European Seaweed Hydrocolloids Market Overview by End-use Application
- Cellulose-based Hydrocolloids
- European Cellulose-based Hydrocolloids Market Overview by Product Type
- European Cellulose-based Hydrocolloids Market Overview by End-use Application
8. ASIA-PACIFIC
- Asia-Pacific Hydrocolloids Market Overview by Geographic Region
- Asia-Pacific Hydrocolloids Market Overview by End-use Application
- Asia-Pacific Hydrocolloids Market Overview by Raw Material Source
- Animal-derived Hydrocolloids (Gelatin)
- Asia-Pacific Gelatin Market Overview by End-use Application
- Microbial-fermented Hydrocolloids
- Asia-Pacific Microbial-fermented Hydrocolloids Market Overview by Product Type
- Asia-Pacific Microbial-fermented Hydrocolloids Market Overview by End-use Application
- Plant-derived Hydrocolloids
- Asia-Pacific Plant-derived Hydrocolloids Market Overview by Product Type
- Asia-Pacific Plant-derived Hydrocolloids Market Overview by End-use Application
- Seaweed-derived Hydrocolloids
- Asia-Pacific Seaweed Hydrocolloids Market Overview by Product Type
- Asia-Pacific Seaweed Hydrocolloids Market Overview by End-use Application
- Cellulose-based Hydrocolloids
- Asia-Pacific Cellulose-based Hydrocolloids Market Overview by Product Type
- Asia-Pacific Cellulose-based Hydrocolloids Market Overview by End-use Application
9. SOUTH AMERICA
- South American Hydrocolloids Market Overview by Geographic Region
- South American Hydrocolloids Market Overview by End-use Application
- South American Hydrocolloids Market Overview by Raw Material Source
- Animal-derived Hydrocolloids (Gelatin)
- South America Gelatin Market Overview by End-use Application
- Microbial-fermented Hydrocolloids
- South American Microbial-fermented Hydrocolloids Market Overview by Product Type
- South American Microbial-fermented Hydrocolloids Market Overview by End-use Application
- Plant-derived Hydrocolloids
- South American Plant-derived Hydrocolloids Market Overview by Product Type
- South American Plant-derived Hydrocolloids Market Overview by End-use Application
- Seaweed-derived Hydrocolloids
- South American Seaweed Hydrocolloids Market Overview by Product Type
- South American Seaweed Hydrocolloids Market Overview by End-use Application
- Cellulose-based Hydrocolloids
- South American Cellulose-based Hydrocolloids Market Overview by Product Type
- South American Cellulose-based Hydrocolloids Market Overview by End-use Application
10. REST OF WORLD
- Rest of World Hydrocolloids Market Overview by Geographic Region
- Rest of World Hydrocolloids Market Overview by End-use Application
- Rest of World Hydrocolloids Market Overview by Raw Material Source
- Animal-derived Hydrocolloids (Gelatin)
- Rest of World Gelatin Market Overview by End-use Application
- Microbial-fermented Hydrocolloids
- Rest of World Microbial-fermented Hydrocolloids Market Overview by Product Type
- Rest of World Microbial-fermented Hydrocolloids Market Overview by End-use Application
- Plant-derived Hydrocolloids
- Rest of World Plant-derived Hydrocolloids Market Overview by Product Type
- Rest of World Plant-derived Hydrocolloids Market Overview by End-use Application
- Seaweed-derived Hydrocolloids
- Rest of World Seaweed Hydrocolloids Market Overview by Product Type
- Rest of World Seaweed Hydrocolloids Market Overview by End-use Application
- Cellulose-based Hydrocolloids
- Rest of World Cellulose-based Hydrocolloids Market Overview by Product Type
- Rest of World Cellulose-based Hydrocolloids Market Overview by End-use Application
- Select Hydrocolloids Market Overview by Rest of World Region
- Xanthan Gum
- Guar Gum
- Carboxymethyl Cellulose (CMC)
- Methyl Cellulose & Hydroxypropylmethyl Cellulose (MC & HPMC)
PART C: GUIDE TO THE INDUSTRY
- NORTH AMERICA
- EUROPE
- ASIA-PACIFIC
- SOUTH AMERICA
- REST OF WORLD
PART D: ANNEXURE
- RESEARCH METHODOLOGY
- FEEDBACK
Algaia S.A.
Alland& Robert
Andi-Johnson Group
Archer-Daniels-Midland Company
Asahi Kasei Corporation
Ashland Global Holdings Inc.
Cargill, Inc.
CAROB S.A.
Compania Espanola de Algas Marinas, S.A. (CEAMSA)
Darling Ingredients (Rousselot, GELNEX)
Deosen Biochemical (Ordos) Ltd
DSM-Firmenich AG
Fufeng Group Limited
Gelatines Weishardt SAS
GELITA AG
Gelymar S.A.
Hebei Xinhe Biochemical Co., Ltd
Herbstreith & Fox KG
Hindustan Gum & Chemicals Ltd.
Hispanagar, S.A.
IFF (International Flavors & Fragrances)
Industrias Roko, S.A.
Ingredion Incorporated (TIC Gums, Inc.)
Jai Bharat Gum & Chemicals Ltd
Jellice Corporation
Jungbunzlauer Suisse AG
KIMICA Corporation
Lamberti SpA
Marcel Trading Corporation
MeiHua Holdings Group Co., Ltd
MSC Co., Ltd.
Nexira SAS
Nitta Gelatin Inc.
Nouryon Specialty Chemicals B.V.
PB Leiner
PMC Ouvrie SAS
QuimicaAmtex S.A.
Shandong Head Co., Ltd.
Shandong Jiejing Group Corporation
Shanghai Brilliant Gum Co., Ltd. (BLG)
Shin-Etsu Chemical Co., Ltd.
Silvateam S.p.A.
Sterling Gelatin
Tate & Lyle Plc (CP Kelco)
The Dow Chemical Company
Vikas WSP Limited
W Hydrocolloids, Inc. (RICO Carrageenan)
Zhenpai Hydrocolloids Co., Ltd.
RELATED REPORTS
Dairy Products Packaging - A Global Market Overview
Report Code: FNB002 | Pages: 382 | Price: $4050
Published
Jul 2026
Xanthan Gum - A Global Market Overview
Report Code: FNB014 | Pages: 310 | Price: $4500
Published
Jul 2026
Global Seaweed Hydrocolloids Market - Agar, Alginates and Carrageenan
Report Code: FNB021 | Pages: 515 | Price: $4500
Published
Jul 2026