Global Alternative Sweeteners Market Trends and Outlook
Alternative sweeteners, comprising high intensity sweeteners (HIS) such as stevia, sucralose, aspartame, and monk fruit, along with polyols (sugar alcohols) including erythritol, xylitol, sorbitol, and maltitol, are increasingly replacing traditional sugar across food, beverage, pharmaceutical, and personal care industries. These ingredients deliver sweetness with reduced or zero calories while also offering functional benefits such as bulking, texture, and dental health support. Over the past decade (2018-2025), the market has been shaped by strong regulatory momentum around sugar reduction, including front-of-pack labeling initiatives, sugar taxes in multiple regions, and ingredient approvals for next-generation sweeteners in emerging economies such as China and India. This has significantly accelerated adoption across both developed and high-growth markets.
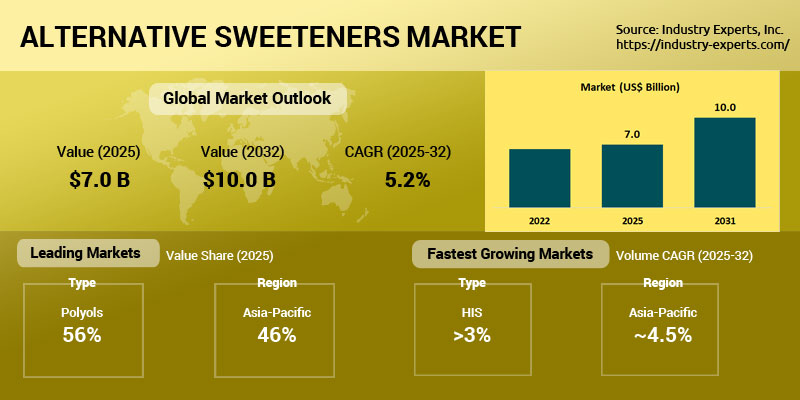
The global Alternative Sweeteners market reached US$7 billion in 2025, and is projected to expand to 3 million metric tons valued at over US$10 billion by 2032, registering a CAGR of 5.2% in value. Growth is being driven by a combination of large-scale demand for polyols in confectionery, bakery, and oral care applications, and rising adoption of high-intensity sweeteners in beverages, tabletop sweeteners, and nutraceuticals. A key structural trend is the increasing use of blended sweetener systems, particularly combinations such as erythritol with stevia or sucralose, which help overcome taste challenges like bitterness and provide sugar-like mouthfeel. While polyols dominate in volume due to their bulk functionality, HIS contribute disproportionately to value growth owing to their high potency and premium positioning.
From a trends perspective, the market is undergoing a clear transition toward natural, plant-derived sweeteners, with steviol glycosides and monk fruit extracts gaining traction due to clean-label appeal and consumer preference for minimally processed ingredients. In parallel, erythritol has emerged as a key enabler in sugar reduction strategies, particularly in beverages and keto-friendly products, often used in combination with HIS. The market is also benefiting from advancements in taste modulation technologies, fermentation-based production processes, and next-generation rare sugars such as allulose, which are expanding the functional and sensory capabilities of alternative sweeteners.
Looking ahead, the market outlook remains positive, supported by continued regulatory approvals, expansion of production capacities (especially in Asia-Pacific), and evolving consumer demand for healthier, low-glycemic, and functional foods. However, challenges such as price volatility (notably in erythritol), taste optimization, and digestive tolerance concerns for certain polyols remain key considerations for manufacturers. Overall, the convergence of health trends, technological innovation, and regulatory support is expected to sustain long-term growth across both HIS and polyol segments.
Alternative Sweeteners Regional Market Analysis
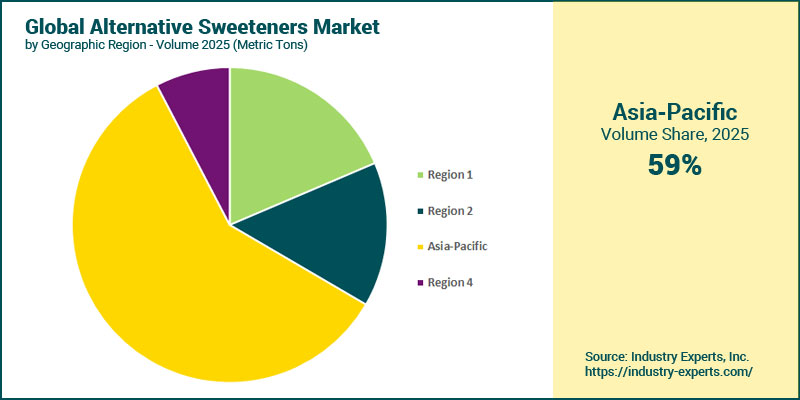
Asia-Pacific dominates the global Alternative Sweeteners market with 58.9% share in 2025, significantly ahead of North America and Europe. The strong regional dominance of Asia-Pacific is driven by high consumption of processed foods, expanding beverage industries, and increasing adoption of sugar substitutes across China and India, whereas North America and Europe benefit from established demand for low-calorie and functional sweeteners in health-conscious consumer segments. Asia-Pacific is also the fastest-growing region (CAGR 4.5%), supported by rapid urbanization, favorable regulatory developments, and growing use of alternative sweeteners in mass-market food applications. In contrast, North America and Europe show relatively slower growth due to market maturity, leading to a gradual decline in their shares.
Alternative Sweeteners Market Analysis by Category
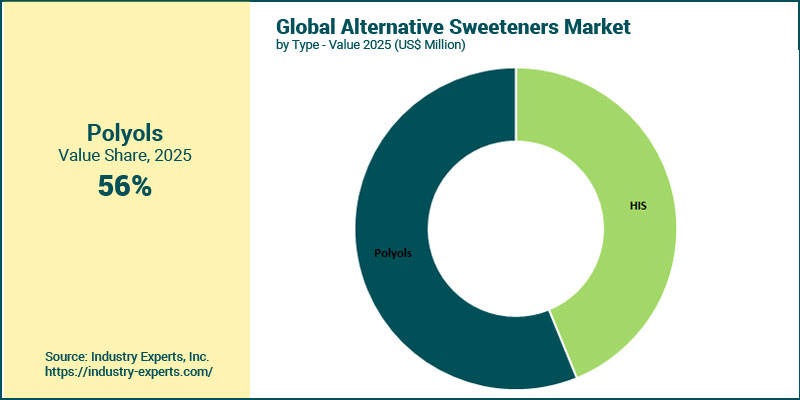
In 2025, Polyols clearly dominating the global Alternative Sweeteners market in volume and value at US$3.95 billion (56.2% share), while High Intensity Sweeteners (HIS) accounted for US$3.1 billion. The strong volume dominance of polyols is driven by their bulk functionality and widespread use in confectionery, food & beverages, and personal care, whereas HIS command a higher value share due to their intense sweetness and premium applications in beverages and tabletop sweeteners. HIS is the fastest-growing segment in value terms (CAGR 6.2%), supported by clean-label trends, natural sweeteners like stevia and monk fruit, and beverage reformulation, while polyols lead volume growth (CAGR 3.9%) driven by rising demand for sugar-free and functional foods.
High Intensity Sweeteners Market Analysis by HIS Type
Sucralose continues to lead the high-intensity sweeteners market, reaching around US$1 billion in 2025 and accounting for a 32.7% share, largely due to its reliable taste profile and stability across a wide range of beverages and food products. Close behind, steviol glycosides generated US$811 million, benefiting from the growing consumer preference for natural, plant-based alternatives. What's particularly notable is the pace at which stevia is gaining ground, it is the fastest-growing segment with a CAGR of 9.2%, with mogroside V and sucralose also showing strong momentum. This trend highlights a clear shift in the market, where demand for clean-label, naturally derived sweeteners is accelerating while high-performance artificial options continue to hold their place. Looking ahead, steviol glycosides are expected to narrow the gap with sucralose significantly by 2032, signaling a broader transition toward natural high-intensity sweeteners across key applications.
High Intensity Sweeteners Market Analysis by End-use Application
In 2025, beverages clearly dominated the high-intensity sweeteners market, reaching 83 thousand metric tons and US$1.5 billion, accounting for 51.3% of total value. This leadership is largely driven by continuous reformulation efforts in the beverage industry, as brands increasingly shift toward low- and zero-sugar offerings without compromising taste. Foods emerged as the second-largest segment, contributing 26.5% of volume, supported by growing use in processed and functional food products. Among all applications, tabletop sweeteners stand out as the fastest-growing segment (CAGR 6.8% in value), closely followed by foods, reflecting a rising consumer inclination toward direct sugar substitutes and premium, clean-label products. While beverages continue to grow steadily with strong value realization, confectionery shows more moderate expansion. Overall, the market is seeing faster value growth than volume, driven by premiumization and the increasing adoption of natural sweeteners like stevia and monk fruit across applications.
Polyols (Sugar Alcohols) Market Analysis by Polyol Type
Sorbitol remains the clear leader in the global polyols market, holding a 56.5% share in 2025, thanks to its wide usage across food, oral care, and pharmaceutical applications where cost-effectiveness and versatility are key advantages. Xylitol follows as the second-largest segment with 271 thousand metric tons, supported by its strong presence in dental care products and premium sugar-free offerings. The standout performer, however, is erythritol, which is growing the fastest at a CAGR of 9.7%, with its share expected to rise significantly from 11% in 2025 to 16.1% by 2032. This growth is largely driven by increasing demand for zero-calorie, clean-label sweeteners, especially in beverages and functional foods. Xylitol also shows solid momentum as the second-fastest-growing segment (4.5% CAGR), benefiting from its expanding role in health-focused confectionery. In contrast, sorbitol, maltitol, mannitol, isomalt, and lactitol are seeing more moderate growth due to their maturity in traditional applications, gradually shifting the market toward newer, high-growth sweeteners like erythritol.
Polyols (Sugar Alcohols) Market Analysis by End-use Application
Personal care leads the polyols market in volume, accounting for 34% share, driven by strong and consistent demand in oral care products like toothpaste and chewing gum, as well as cosmetic formulations. In contrast, confectionery stands out in value terms, reaching US$1.51 billion (38.3% share), supported by premium pricing in sugar-free and functional confectionery products. Food & beverages is the fastest-growing segment across both volume and value (CAGR 6.3%), with its share expected to rise to 29.1% in volume and 32.8% in value by 2032, fueled by increasing demand for low-calorie, diabetic-friendly, and functional food products. This positions it as the key emerging segment, gradually closing the gap with leading categories. Meanwhile, confectionery continues to grow at a steady pace, while personal care and other applications show relatively slower growth due to their maturity and stable demand patterns.
Alternative Sweeteners Market Report Scope
This global report on Alternative Sweeteners analyzes the market based on end-use application for the period 2022-2032 with projections from 2025 to 2032 in terms of volume in metric tons and value in US$. In addition to providing profiles of major companies operating in the Alternative Sweeteners industry, the latest corporate, product and industrial developments have been covered to offer a clear panorama of Alternative Sweeteners industry.
Key Metrics
| Historical Period: | 2022-2025 | |
| Base Year: | 2025 | |
| Forecast Period: | 2025-2032 | |
| Units: | Volume consumption in Metric Tons and Value market in US$ | |
| Companies Mentioned: | 125+ |
Alternative Sweeteners Market by Geographic Region
- North America (The United States, Canada and Mexico)
- Europe (France, Germany, Italy, Russia, Spain, The United Kingdom and Rest of Europe)
- Asia-Pacific (China, India, Japan, South Korea, Indonesia and Rest of Asia-Pacific)
- Rest of World (South America and Middle-East & Africa)
Alternative Sweeteners Market by Category & Type
- High Intensity Sweeteners
- Artificial HIS
- Acesulfame-K
- Aspartame
- Cyclamate
- Neotame
- Saccharin
- Sucralose
- Natural HIS
- Steviol Glycosides (stevia extracts)
- Glycyrrhizin (licorice root extracts)
- Mogroside V (monk fruit extracts)
- Polyols (Sugar Alcohols)
- Sorbitol
- Xylitol
- Mannitol
- Maltitol
- Erythritol
- Isomalt
- Lactitol
High Intensity Sweeteners Market by End-use Application
- Beverages
- Confectionary
- Foods
- Tabletop Sweeteners
- Others
Polyols (Sugar Alcohols) Market by End-use Application
- Confectionary
- Food & Beverages
- Personal Care
- Others
Alternative Sweeteners Market Frequently Asked Questions (FAQs)
Alternative sweeteners are sugar substitutes that provide sweetness with reduced or zero calories, including high-intensity sweeteners and polyols.
Key drivers include rising health awareness, increasing diabetes and obesity rates, and regulatory initiatives to reduce sugar consumption.
The market reached US$7 billion in 2025 and is projected to surpass US$10 billion by 2032.
Polyols dominate in volume due to their bulk functionality, while high-intensity sweeteners contribute significantly to value growth.
Asia-Pacific is the fastest-growing region, driven by expanding food industries and rising consumer awareness.
They are widely used in beverages, confectionery, foods, tabletop sweeteners, personal care, and pharmaceuticals.
Key trends include clean-label products, natural sweeteners like stevia, blended formulations, and expansion in emerging markets.
PART A: GLOBAL MARKET PERSPECTIVE
1. INTRODUCTION
- Product Outline
- Categorization of Sweeteners
- Caloric Sweeteners
- High Intensity Sweeteners (HIS)
- Potential Health Benefits Offered by High Intensity Sweeteners
- Potential Health Issues Associated with Artificial High Intensity Sweeteners
- Applications for High Intensity Sweeteners
- Types of High Intensity Sweeteners
- Artificial High Intensity Sweeteners
- Acesulfame Potassium (Acesulfame K)
- Aspartame
- Cyclamates
- Neotame
- Saccharin
- Sucralose
- Natural High Intensity Sweeteners
- Steviol Glycosides
- Mogroside V (Luo Han Guo/Monk Fruit Extract)
- Glycyrrhizin (Licorice Root Extract)
- Polyols (Sugar Alcohols)
- Potential Health Benefits Offered by Polyols/Sugar Alcohols
- Potential Health Concerns Associated with Polyols/Sugar Alcohols
- Polyols and Gastrointestinal (GI) Effects
- Applications of Polyols/Sugar Alcohols
- Types of Polyols/Sugar Alcohols
- Sorbitol
- Mannitol
- Maltitol
- Xylitol
- Erythritol
- Isomalt
- Lactitol
2. KEY MARKET TRENDS
3. REGULATORY LANDSCAPE
- Polyols and High Intense Sweetener Regulations around the Globe
- European Union
- The United States
- Japan
- India
- China
4. KEY GLOBAL PLAYERS
- Ajinomoto Co., Inc.
- Anhui Jinhe Industrial Co., Ltd.
- Archer Daniels Midland Company
- B Food Science Co., Ltd.
- Baolingbao Biology Co., Ltd
- Beijing Vitasweet Co., Ltd.
- BENEO GmbH
- Cargill, Inc
- Celanese Corporation
- Changzhou Niutang Chemical Plant Co., Ltd.
- DFI Corporation
- Dongxiao Biotechnology Co., Ltd
- Ecogreen Oleochemicals (Singapore) Pte., Ltd.
- Gansu Fanzhi Biotech Co., Ltd.
- GLG Life Tech Corporation
- Golden Time Chemical (Jiangsu) Co., Ltd.
- Guangdong Guangye Qingyi Food Technology Co., Ltd.
- Guilin GFS Monk Fruit Corp.
- Hill Pharmaceutical Co., Ltd.
- Ingredion Incorporated (PureCircle)
- International Flavors & Fragrances Inc. (Danisco)
- Jiangsu SinoSweet Co., Ltd.
- JK Sucralose, Inc.
- Jungbunzlauer S.A.
- Kaifeng Xinghua Fine Chemical Ltd.
- MAFCO Worldwide LLC
- Merisant Company
- Mitsubishi Shoji Foodtech Co., Ltd.
- Mitsubishi-Kagaku Foods Corporation
- Morita Kagaku Kogyo Co., Ltd.
- Newtrend Group Holding Co Ltd
- Ningxia Eppen Biotech Co., Ltd
- NutraSweet Company
- O'laughlin Industries Co., Ltd.
- PMC Specialties Group, Inc
- Roquette Freres S.A.
- SAPPI Limited
- Shandong Futaste Co., Ltd.
- Shandong Kangbao Biochemical Technology Co., Ltd.
- Shandong Longlive Bio-Technology Co., Ltd.
- Shandong Sanyuan Biotechnology Co., Ltd
- Shandong Tianli Pharmaceutical Co., Ltd.
- Suzhou Hope Technology Co., Ltd.
- Tate & Lyle PLC
- Techno Food Ingredients Co., Ltd
- Tereos Starch & Sweeteners s.a.s. (Tereos Syral)
- Tianjin North Food Co., Ltd.
- Wuhan Huasweet Co., Ltd.
- Zhejiang Huakang Pharmaceutical Co., Ltd.
- Zhejiang Sanhe Food Science & Technology Co., Ltd.
- Zhong Hua Fang Da (H.K.) Limited
- Zuchem Inc.
5. KEY BUSINESS AND PRODUCT TRENDS
6. GLOBAL MARKET OVERVIEW
- Global Alternative Sweeteners Market Overview by Product Category
- High Intensity Sweeteners
- Global High Intensity Sweeteners Market Overview by HIS Category
- Global High Intensity Sweeteners Market Overview by HIS Type
- Global High Intensity Sweeteners Market Overview by End-Use Application
- Polyols (Sugar Alcohols)
- Global Polyols (Sugar Alcohols) Market Overview by Polyol Type
- Global Polyols (Sugar Alcohols) Market Overview by End-Use Application
PART B: REGIONAL MARKET PERSPECTIVE
- Global Alternative Sweeteners Market Overview by Geographic Region
- Global High Intensity Sweeteners Market Overview by Geographic Region
- Global Artificial High Intensity Sweeteners Market Overview by Geographic Region
- Global Natural High Intensity Sweeteners Market Overview by Geographic Region
- Global Polyols (Sugar Alcohols) Market Overview by Geographic Region
REGIONAL MARKET OVERVIEW
7. NORTH AMERICA
- North American Alternative Sweeteners Market Overview by Geographic Region
- North American Alternative Sweeteners Market Overview by Product Category
- High Intensity Sweeteners
- North American High Intensity Sweeteners Market Overview by Geographic Region
- North American High Intensity Sweeteners Market Overview by End-Use Application
- North American High Intensity Sweeteners Market Overview by HIS Category
- Polyols (Sugar Alcohols)
- North American Polyols (Sugar Alcohols) Market Overview by Geographic Region
- North American Polyols (Sugar Alcohols) Market Overview by End-Use Application
- Country-wise Analsysis of North American Alternative Sweeteners Market
- The United States
- United States Alternative Sweeteners Market Overview by Product Category
- High Intensity Sweeteners
- United States High Intensity Sweeteners Market Overview by End-Use Application
- Polyols (Sugar alcohols)
- United States Polyols (Sugar Alcohols) Market Overview by End-Use Application
- Canada
- Canadian Alternative Sweeteners Market Overview by Product Category
- High Intensity Sweeteners
- Canadian High Intensity Sweeteners Market Overview by End-Use Application
- Polyols (Sugar Alcohols)
- Canadian Polyols (Sugar Alcohols) Market Overview by End-Use Application
- Mexico
- Mexican Alternative Sweeteners Market Overview by Product Category
- High Intensity Sweeteners
- Mexican High Intensity Sweeteners Market Overview by End-Use Application
- Polyols (Sugar Alcohols)
- Mexican Polyols (Sugar Alcohols) Market Overview by End-Use Application
8. EUROPE
- European Alternative Sweeteners Market Overview by Geographic Region
- European Alternative Sweeteners Market Overview by Product Category
- High Intensity Sweeteners
- European High Intensity Sweeteners Market Overview by Geographic Region
- European High Intensity Sweeteners Market Overview by End-Use Application
- European High Intensity Sweeteners Market Overview by HIS Category
- Polyols (Sugar Alcohols)
- European Polyols (Sugar Alcohols) Market Overview by Geographic Region
- European Polyols (Sugar Alcohols) Market Overview by End-Use Application
- Country-wise Analysis of European Alternative Sweeteners Market
- France
- French Alternative Sweeteners Market Overview by Product Category
- High Intensity Sweeteners
- French High Intensity Sweeteners Market Overview by End-Use Application
- Polyols (Sugar Alcohols)
- French Polyols (Sugar Alcohols) Market Overview by End-Use Application
- Germany
- German Alternative Sweeteners Market Overview by Product Category
- High Intensity Sweeteners
- German High Intensity Sweeteners Market Overview by End-Use Application
- Polyols (Sugar Alcohols)
- German Polyols (Sugar Alcohols) Market Overview by End-Use Application
- Italy
- Italian Alternative Sweeteners Market Overview by Product Category
- High Intensity Sweeteners
- Italian High Intensity Sweeteners Market Overview by End-Use Application
- Polyols (Sugar Alcohols)
- Italian Polyols (Sugar Alcohols) Market Overview by End-Use Application
- Spain
- Spanish Alternative Sweeteners Market Overview by Product Category
- High Intensity Sweeteners
- Spanish High Intensity Sweeteners Market Overview by End-Use Application
- Polyols (Sugar Alcohols)
- Spanish Polyols (Sugar Alcohols) Market Overview by End-Use Application
- The United Kingdom
- United Kingdom Alternative Sweeteners Market Overview by Product Category
- High Intensity Sweeteners
- United Kingdom High Intensity Sweeteners Market Overview by End-Use Application
- Polyols (Sugar Alcohols)
- United Kingdom Polyols (Sugar Alcohols) Market Overview by End-Use Application
- Russia
- Russian Alternative Sweeteners Market Overview by Product Category
- High Intensity Sweeteners
- Russian High Intensity Sweeteners Market Overview by End-Use Application
- Polyols (Sugar Alcohols)
- Russian Polyols (Sugar Alcohols) Market Overview by End-Use Application
- Rest of Europe
- Rest of Europe Alternative Sweeteners Market Overview by Product Category
- High Intensity Sweeteners
- Rest of Europe High Intensity Sweeteners Market Overview by End-Use Application
- Polyols (Sugar Alcohols)
- Rest of Europe Polyols (Sugar Alcohols) Market Overview by End-Use Application
9. ASIA-PACIFIC
- Asia-Pacific Alternative Sweeteners Market Overview by Geographic Region
- Asia-Pacific Alternative Sweeteners Market Overview by Product Category
- High Intensity Sweeteners
- Asia-Pacific High Intensity Sweeteners Market Overview by Geographic Region
- Asia-Pacific High Intensity Sweeteners Market Overview by End-Use Application
- Asia-Pacific High Intensity Sweeteners Market Overview by HIS Category
- Polyols (Sugar Alcohols)
- Asia-Pacific Polyols (Sugar Alcohols) Market Overview by Geographic Region
- Asia-Pacific Polyols (Sugar Alcohols) Market Overview by End-Use Application
- Country-wise Analysis of Asia-Pacific Alternative Sweeteners Market
- China
- Chinese Alternative Sweeteners Market Overview by Product Category
- High Intensity Sweeteners
- Chinese High Intensity Sweeteners Market Overview by End-Use Application
- Polyols (Sugar Alcohols)
- Chinese Polyols (Sugar Alcohols) Market Overview by End-Use Application
- India
- Indian Alternative Sweeteners Market Overview by Product Category
- High Intensity Sweeteners
- Indian High Intensity Sweeteners Market Overview by End-Use Application
- Polyols (Sugar Alcohols)
- Indian Polyols (Sugar Alcohols) Market Overview by End-Use Application
- Indonesia
- High Intensity Sweeteners
- Indonesian High Intensity Sweeteners Market Overview by End-Use Application
- Japan
- Japanese Alternative Sweeteners Market Overview by Product Category
- High Intensity Sweeteners
- Japanese High Intensity Sweeteners Market Overview by End-Use Application
- Polyols (Sugar Alcohols)
- Japanese Polyols (Sugar Alcohols) Market Overview by End-Use Application
- South Korea
- South Korean Alternative Sweeteners Market Overview by Product Category
- High Intensity Sweeteners
- South Korean High Intensity Sweeteners Market Overview by End-Use Application
- Polyols (Sugar Alcohols)
- South Korean Polyols (Sugar Alcohols) Market Overview by End-Use Application
- Rest of Asia-Pacific
- Rest of Asia-Pacific Alternative Sweeteners Market Overview by Product Category
- High Intensity Sweeteners
- Rest of Asia-Pacific High Intensity Sweeteners Market Overview by End-Use Application
- Polyols (Sugar Alcohols)
- Rest of Asia-Pacific Polyols (Sugar Alcohols) Market Overview by End-Use Application
10. REST OF WORLD
- Rest of World Alternative Sweeteners Market Overview by Geographic Region
- Rest of World Alternative Sweeteners Market Overview by Product Category
- High Intensity Sweeteners
- Rest of World High Intensity Sweeteners Market Overview by Geographic Region
- Rest of World High Intensity Sweeteners Market Overview by End-Use Application
- Rest of World High Intensity Sweeteners Market Overview by HIS Type
- Polyols (Sugar Alcohols)
- Rest of World Polyols (Sugar Alcohols) Market Overview by Geographic Region
- Rest of World Polyols (Sugar Alcohols) Market Overview by End-Use Application
PART C: GUIDE TO THE INDUSTRY
- NORTH AMERICA
- EUROPE
- ASIA-PACIFIC
- REST OF WORLD
PART D: ANNEXURE
- RESEARCH METHODOLOGY
- FEEDBACK
Ajinomoto Co., Inc.
Anhui Jinhe Industrial Co., Ltd.
Archer Daniels Midland Company
B Food Science Co., Ltd.
Baolingbao Biology Co., Ltd
Beijing Vitasweet Co., Ltd.
BENEO GmbH
Cargill, Inc
Celanese Corporation
Changzhou Niutang Chemical Plant Co., Ltd.
DFI Corporation
Dongxiao Biotechnology Co., Ltd
Ecogreen Oleochemicals (Singapore) Pte., Ltd.
Gansu Fanzhi Biotech Co., Ltd.
GLG Life Tech Corporation
Golden Time Chemical (Jiangsu) Co., Ltd.
Guangdong Guangye Qingyi Food Technology Co., Ltd.
Guilin GFS Monk Fruit Corp.
Hill Pharmaceutical Co., Ltd.
Ingredion Incorporated (PureCircle)
International Flavors & Fragrances Inc. (Danisco)
Jiangsu SinoSweet Co., Ltd.
JK Sucralose, Inc.
Jungbunzlauer S.A.
Kaifeng Xinghua Fine Chemical Ltd.
MAFCO Worldwide LLC
Merisant Company
Mitsubishi Shoji Foodtech Co., Ltd.
Mitsubishi-Kagaku Foods Corporation
Morita Kagaku Kogyo Co., Ltd.
Newtrend Group Holding Co Ltd
Ningxia Eppen Biotech Co., Ltd
NutraSweet Company
O'laughlin Industries Co., Ltd.
PMC Specialties Group, Inc
Roquette Freres S.A.
SAPPI Limited
Shandong Futaste Co., Ltd.
Shandong Kangbao Biochemical Technology Co., Ltd.
Shandong Longlive Bio-Technology Co., Ltd.
Shandong Sanyuan Biotechnology Co., Ltd
Shandong Tianli Pharmaceutical Co., Ltd.
Suzhou Hope Technology Co., Ltd.
Tate & Lyle PLC
Techno Food Ingredients Co., Ltd
Tereos Starch & Sweeteners s.a.s. (Tereos Syral)
Tianjin North Food Co., Ltd.
Wuhan Huasweet Co., Ltd.
Zhejiang Huakang Pharmaceutical Co., Ltd.
Zhejiang Sanhe Food Science & Technology Co., Ltd.
Zhong Hua Fang Da (H.K.) Limited
Zuchem Inc.
RELATED REPORTS
Dairy Products Packaging - A Global Market Overview
Report Code: FNB002 | Pages: 382 | Price: $4050
Published
Jul 2026
Xanthan Gum - A Global Market Overview
Report Code: FNB014 | Pages: 310 | Price: $4500
Published
Jul 2026
Global Seaweed Hydrocolloids Market - Agar, Alginates and Carrageenan
Report Code: FNB021 | Pages: 515 | Price: $4500
Published
Jul 2026
Global Hydrocolloids Market – Raw Materials, Products and Applications
Report Code: FNB024 | Pages: 660 | Price: $4860
Published
Jul 2026