Global Superabsorbent Polymers Market Trends and Outlook
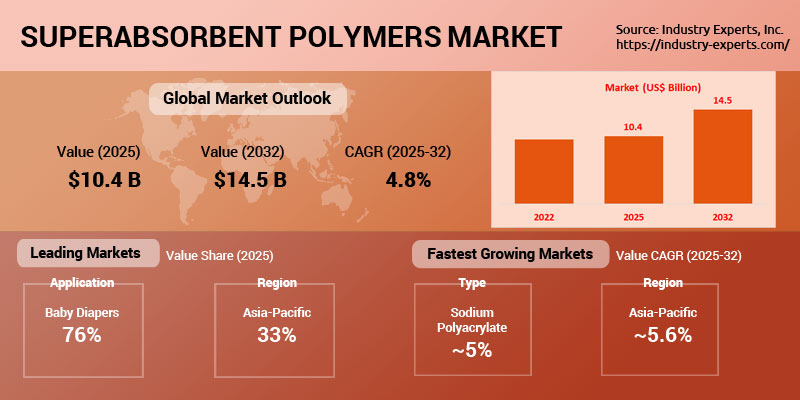
The global Superabsorbent Polymers (SAPs) market is a critical segment of the specialty chemicals industry, encompassing highly absorbent materials capable of retaining large quantities of liquid relative to their own mass. SAPs are widely utilized in baby diapers, adult incontinence products, feminine hygiene products, agriculture & horticulture, and other specialty applications. The market was valued at approximately US$10.4 billion in 2025 and is projected to reach US$14.5 billion by 2032, registering a CAGR of 4.8% during the forecast period.
Market growth is primarily driven by increasing demand for hygiene products worldwide, particularly baby diapers and adult incontinence products, which collectively account for the majority of SAP consumption. Rising population levels, improving living standards, growing awareness regarding personal hygiene, and increasing healthcare expenditure continue to support long-term market expansion. In addition, growing adoption of water-retention technologies in agriculture and horticulture is creating new opportunities for SAP manufacturers across both developed and emerging economies.
Asia-Pacific represents the largest and fastest-growing regional market, supported by large consumer populations, urbanization, and expanding disposable incomes. Sodium Polyacrylate remains the dominant polymer type due to its superior absorbency characteristics and extensive use across hygiene applications. Looking ahead, technological advancements, product performance improvements, sustainability initiatives, and expanding applications beyond traditional hygiene products are expected to support continued growth of the global SAPs industry through 2032.
Superabsorbent Polymers Regional Market Analysis
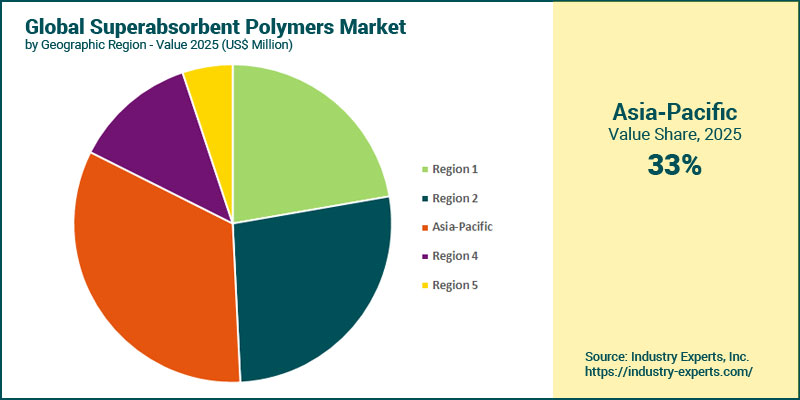
Asia-Pacific accounted for the largest regional share at 33% in 2025, supported by strong consumption of baby diapers, feminine hygiene products, and increasing adoption of absorbent materials across emerging economies, while Europe followed closely. Asia-Pacific is also expected to remain the fastest-growing regional market, expanding at a 5.6% CAGR, driven by rising population, urbanization, and improving hygiene awareness, whereas the Rest of World region follows with a 5% CAGR. By 2032, Asia-Pacific is expected to strengthen its market position, increasing its share to 35%, while Europe and North America witness relatively moderate growth compared to emerging markets.
Superabsorbent Polymers Market Analysis by Type
Sodium Polyacrylate dominated the market with a commanding 74% share in 2025, reflecting its widespread use in baby diapers, adult incontinence products, and feminine hygiene applications due to its superior liquid absorption capabilities. Sodium Polyacrylate is also projected to be the fastest-growing polymer type, expanding at a 5% CAGR, reaching US$10.9 billion by 2032. In contrast, Other SAPs are expected to witness comparatively slower growth, resulting in a gradual decline in share, highlighting the continued preference for Sodium Polyacrylate-based products across major end-use applications.
Superabsorbent Polymers Market Analysis by Application
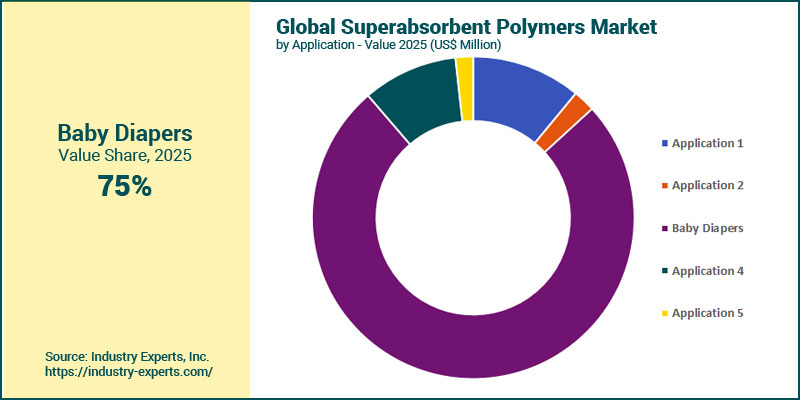
Baby Diapers remained the dominant application segment, accounting for 75.5% of the global market in 2025, driven by its extensive consumption of SAP materials for enhanced absorbency and leakage protection, while Adult Incontinence Products ranked as the second-largest application. The Agriculture & Horticulture segment is expected to be the fastest-growing application, registering a 5.3% CAGR, supported by increasing adoption of water-retention technologies and sustainable farming practices, while Baby Diapers follows closely. By 2032, Baby Diapers are projected to further strengthen their leadership position, reaching US$11 billion.
Superabsorbent Polymers Market Report Scope
This global report on Superabsorbent Polymers analyzes the market based on product type and application for the period 2022-2032 with projections from 2025 to 2032 in terms of value in US$. In addition to providing profiles of major companies operating in the Superabsorbent Polymers industry, the latest corporate, product and industrial developments have been covered to offer a clear panorama of Superabsorbent Polymers industry.
Key Metrics
| Historical Period: | 2022-2025 | |
| Base Year: | 2025 | |
| Forecast Period: | 2025-2032 | |
| Units: | Value market in US$ | |
| Companies Mentioned: | 35+ |
Global Superabsorbent Polymers Market by Geographic Region
- North America (The United States, Canada and Mexico)
- Europe (France, Germany, Italy, Russia, Spain, The United Kingdom and Rest of Europe)
- Asia-Pacific (Australia, China, India, Japan, South Korea and Rest of Asia-Pacific)
- South America (Argentina, Brazil and Rest of South America)
- Rest of World
Global Superabsorbent Polymers Market by Type
- Polyacrylamide Copolymer
- Sodium Polyacrylate
- Others
Global Superabsorbent Polymers Market by Application
- Adult Incontinence Products
- Agriculture & Horticulture
- Baby Diapers
- Feminine Hygiene Products
- Other Applications
Superabsorbent Polymers Market Frequently Asked Questions (FAQs)
The global Superabsorbent Polymers market is projected to reach approximately US$14.5 billion by 2032, growing from US$10.4 billion in 2025.
The market is forecast to register a CAGR of 4.8% during 2025-2032.
Asia-Pacific is the largest regional market, accounting for 33% of global revenue in 2025, and is also the fastest-growing region.
Sodium Polyacrylate is the leading polymer type with a 74% market share in 2025.
Baby Diapers represent the largest application segment, accounting for 75.5% of the global market in 2025.
Major growth drivers include rising demand for baby diapers, increasing use of adult incontinence products, growing hygiene awareness, population growth, and expanding agricultural applications.
The report profiles more than 35 leading companies, covering their strategies, product portfolios, innovations, and recent developments within the global Superabsorbent Polymers industry.
PART A: GLOBAL MARKET PERSPECTIVE
1. INTRODUCTION
- Product Outline
- What Are Superabsorbent Polymers (SAPs)?
- A Brief History of SAPs
- Techniques of Synthesizing SAPs
- Bulk Polymerization
- Solution Polymerization/Cross-Linking
- Suspension Polymerization or Inverse Suspension Polymerization
- Polymerization by Irradiation
- Cross-Linking in Superabsorbent Polymers
- Major Types of Superabsorbent Polymers (SAPs)
- Polyacrylamide Copolymer
- Chemical Properties
- Physical Properties
- Applications
- Sodium Polyacrylate
- Production Process
- Major Commercial Applications of Sodium Polyacrylate
- Other Superabsorbent Polymers (SAPs)
- Ethylene Maleic Anhydride Copolymer
- Polyvinyl Alcohol Copolymers
- Polysaccharide-Based SAPs
- Applications of Superabsorbent Polymers (SAPs)
- Hygiene
- Agriculture and Horticulture
- Other Applications
- Medical
- Pharmaceuticals
- Others
2. KEY MARKET TRENDS
3. KEY GLOBAL PLAYERS
- Archer Daniels Midland Company (The United States)
- BASF SE (Germany)
- BASF-YPC Company Limited (China)
- Formosa Plastics Corporation (Taiwan)
- Kao Corporation (Japan)
- LG Chem Ltd (South Korea)
- Mitsubishi Chemical Corporation (Japan)
- Nippon Shokubai Co Ltd (Japan)
- SNF S.A.S. (France)
- Sanyo Chemical Industries Ltd (Japan)
- Shandong Haoyue New Materials Co Ltd (China)
- Shandong Nuoer Biological Technology Co Ltd (China)
- Songwon Industrial Co Ltd (South Korea)
- Stockhausen Superabsorber GmbH (Germany)
- Sumitomo Seika Chemicals Company Limited (Japan)
- Wanhua Chemical Group Co Ltd (China)
- Zhejiang Weilong Polymer Material Co Ltd (China)
4. KEY BUSINESS TRENDS
5. GLOBAL MARKET OVERVIEW
- Global Superabsorbent Polymers (SAPs) Market Overview by Polymer Type
- Global Superabsorbent Polymer Type Market Overview by Geographic Region
- Polyacrylamide Copolymer
- Sodium Polyacrylate
- Other Superabsorbent Polymers (SAPs)
- Global Superabsorbent Polymers (SAPs) Market Overview by Application
- Global Superabsorbent Application Market Overview by Geographic Region
- Adult Incontinence Products
- Agriculture & Horticulture
- Baby Diapers
- Feminine Hygiene Products
- Other Applications
PART B: REGIONAL MARKET PERSPECTIVE
- Global Superabsorbent Polymers (SAPs) Market Overview by Geographic Region
REGIONAL MARKET OVERVIEW
6. NORTH AMERICA
- North American Superabsorbent Polymers (SAPs) Market Overview by Geographic Region
- North American Superabsorbent Polymers (SAPs) Market Overview by Polymer Type
- North American Superabsorbent Polymers (SAPs) Market Overview by Application
- Country-wise Analysis of North American Superabsorbent Polymers Market
- The United States
- United States Superabsorbent Polymers (SAPs) Market Overview by Polymer Type
- United States Superabsorbent Polymers (SAPs) Market Overview by Application
- Canada
- Canadian Superabsorbent Polymers (SAPs) Market Overview by Polymer Type
- Canadian Superabsorbent Polymers (SAPs) Market Overview by Application
- Mexico
- Mexican Superabsorbent Polymers (SAPs) Market Overview by Polymer Type
- Mexican Superabsorbent Polymers (SAPs) Market Overview by Application
7. EUROPE
- European Superabsorbent Polymers (SAPs) Market Overview by Geographic Region
- European Superabsorbent Polymers (SAPs) Market Overview by Polymer Type
- European Superabsorbent Polymers (SAPs) Market Overview by Application
- Country-wise Analysis of European Superabsorbent Polymers Market
- France
- French Superabsorbent Polymers (SAPs) Market Overview by Polymer Type
- French Superabsorbent Polymers (SAPs) Market Overview by Application
- Germany
- German Superabsorbent Polymers (SAPs) Market Overview by Polymer Type
- German Superabsorbent Polymers (SAPs) Market Overview by Application
- Italy
- Italian Superabsorbent Polymers (SAPs) Market Overview by Polymer Type
- Italian Superabsorbent Polymers (SAPs) Market Overview by Application
- Russia
- Russian Superabsorbent Polymers (SAPs) Market Overview by Polymer Type
- Russian Superabsorbent Polymers (SAPs) Market Overview by Application
- Spain
- Spanish Superabsorbent Polymers (SAPs) Market Overview by Polymer Type
- Spanish Superabsorbent Polymers (SAPs) Market Overview by Application
- The United Kingdom
- United Kingdom Superabsorbent Polymers (SAPs) Market Overview by Polymer Type
- United Kingdom Superabsorbent Polymers (SAPs) Market Overview by Application
- Rest of Europe
- Rest of Europe Superabsorbent Polymers (SAPs) Market Overview by Polymer Type
- Rest of Europe Superabsorbent Polymers (SAPs) Market Overview by Application
8. ASIA-PACIFIC
- Asia-Pacific Superabsorbent Polymers (SAPs) Market Overview by Geographic Region
- Asia-Pacific Superabsorbent Polymers (SAPs) Market Overview by Polymer Type
- Asia-Pacific Superabsorbent Polymers (SAPs) Market Overview by Application
- Country-wise Analysis of Asia-Pacific Superabsorbent Polymers Market
- Australia
- Australian Superabsorbent Polymers (SAPs) Market Overview by Polymer Type
- Australian Superabsorbent Polymers (SAPs) Market Overview by Application
- China
- Chinese Superabsorbent Polymers (SAPs) Market Overview by Polymer Type
- Chinese Superabsorbent Polymers (SAPs) Market Overview by Application
- India
- Indian Superabsorbent Polymers (SAPs) Market Overview by Polymer Type
- Indian Superabsorbent Polymers (SAPs) Market Overview by Application
- Japan
- Japanese Superabsorbent Polymers (SAPs) Market Overview by Polymer Type
- Japanese Superabsorbent Polymers (SAPs) Market Overview by Application
- South Korea
- Korean Superabsorbent Polymers (SAPs) Market Overview by Polymer Type
- Korean Superabsorbent Polymers (SAPs) Market Overview by Application
- Rest of Asia-Pacific
- Rest of Asia-Pacific Superabsorbent Polymers (SAPs) Market Overview by Polymer Type
- Rest of Asia-Pacific Superabsorbent Polymers (SAPs) Market Overview by Application
9. SOUTH AMERICA
- South American Superabsorbent Polymers (SAPs) Market Overview by Geographic Region
- South American Superabsorbent Polymers (SAPs) Market Overview by Polymer Type
- South American Superabsorbent Polymers (SAPs) Market Overview by Application
- Country-wise Analysis of South American Superabsorbent Polymers Market
- Argentina
- Argentine Superabsorbent Polymers (SAPs) Market Overview by Polymer Type
- Argentine Superabsorbent Polymers (SAPs) Market Overview by Application
- Brazil
- Brazilian Superabsorbent Polymers (SAPs) Market Overview by Polymer Type
- Brazilian Superabsorbent Polymers (SAPs) Market Overview by Application
- Rest of South America
- Rest of South America Superabsorbent Polymers (SAPs) Market Overview by Polymer Type
- Rest of South America Superabsorbent Polymers (SAPs) Market Overview by Application
10. REST OF WORLD
- Rest of World Superabsorbent Polymers (SAPs) Market Overview by Polymer Type
- Rest of World Superabsorbent Polymers (SAPs) Market Overview by Application
PART C: GUIDE TO THE INDUSTRY
PART D: ANNEXURE
- RESEARCH METHODOLOGY
- FEEDBACK
Archer Daniels Midland Company
BASF SE
BASF-YPC Company Limited
Formosa Plastics Corporation
Kao Corporation
LG Chem Ltd
Mitsubishi Chemical Corporation
Nippon Shokubai Co Ltd
Sanyo Chemical Industries Ltd
Shandong Haoyue New Materials Co Ltd
Shandong Nuoer Biological Technology Co Ltd
SNF S.A.S.
Songwon Industrial Co Ltd
Stockhausen Superabsorber GmbH
Sumitomo Seika Chemicals Company Limited
Wanhua Chemical Group Co Ltd
Zhejiang Weilong Polymer Material Co Ltd
RELATED REPORTS
Polyamides (PA6, PA66) - A Global Market Overview
Report Code: CHM112 | Pages: 274 | Price: $4500
Published
Jul 2026
Polymethyl Methacrylate (PMMA) - A Global Market Overview
Report Code: CHM113 | Pages: 247 | Price: $4500
Published
Jul 2026
Polyoxymethylene (POM or Polyacetal) - A Global Market Overview
Report Code: CHM114 | Pages: 245 | Price: $4500
Published
Jul 2026
Polybutylene Terephthalate (PBT) - A Global Market Overview
Report Code: CHM115 | Pages: 224 | Price: $4500
Published
Jul 2026
Modified Polyphenylene Ether (mPPE) - A Global Market Overview
Report Code: CHM116 | Pages: 195 | Price: $4050
Published
Jul 2026