Published Date: Jun 2018
Report Code: CP062
Pages: 520
Charts: 364
Report Synopsis
Smart Materials constitute a class of advanced materials capable of sensing and responding to a wide variety of stimuli that can include electric and magnetic fields, temperature, pressure, mechanical stress, hydrostatic pressure, nuclear radiation and pH change. The inherently unique characteristics of these materials make it possible for them to revert back to their original state after the external stimulus is removed. This next generation of intelligent materials displays adaptive capabilities and alters its physical properties such as shape, stiffness and viscosity in a specified manner. Smart Materials have multiple functionalities, such as self-adaptability, self-sensing, self-healing and memory, which allow them to be used in a variety of applications.
As per the findings by the analysts at Industry Experts, Inc., Phase Change Materials (PCMs) constitute the fastest growing material type with a robust 20% CAGR in the global market for Smart Materials. The increasing application of structural products in applications, such as building resources, electronics cooling, energy storage, shipping and packaging would further propel demand for these materials. Piezoelectric Materials corner the largest share of the global Smart Materials market, accounting for a forecast 66% share in 2018.
Research Findings & Coverage
- Smart Materials market is analyzed in this report with respect to all major material types and their key sub-types
- The study extensively studies each material type and the sub-type in all major global regions and prominent geographies in these regions
- Thermal Properties of Bio-based PCMs Enhanced with Exfoliated Graphite Nanoplatelets
- Energy Harvesting Applications Get a Boost with Biodegradable Piezoelectric Polymer
- Latest Advances in High Temperature Shape Memory Alloys
- Key business trends focusing on product innovations/developments, M&As, JVs and other recent industry developments
- Major companies profiled – 43
- The industry guide includes the contact details for 143 companies
Product Outline
The report analyzes the market for the key material types and sub-types of Smart Materials including:
- Electrostrictive Materials
- Lead Magnesium Niobate-Lead Titanate (PMN-PT)
- Polymers
- Magnetostrictive Materials
- Ferrites���������������
- Rare Earth Materials
- Piezoelectric Materials
- Piezoceramics
- Piezocomposites
- Piezocrystals
- Piezopolymers
- Phase Change Materials
- Bio-Based
- Inorganic
- Organic
- Shape Memory Alloys
- Copper-Based
- Iron-Based
- Nickel-Titanium
- Other Smart Materials (include wet electroactive polymers, electrorheological & magnetorheological fluids, electroluminescent & photoluminescent materials and electrochromic materials)
Analysis Period, Units and Growth Rates
- The report reviews, analyzes and projects the global Smart Materials market for the period 2014-2023 in terms of market value in US$ and the compound annual growth rates (CAGRs) projected from 2017 through 2023
Geographic Coverage
- North America (The United States, Canada and Mexico)
- Europe (France, Germany, Italy, Russia, Spain, The United Kingdom and Rest of Europe)
- Asia-Pacific (China, India, Japan, South Korea and Rest of Asia-Pacific)
- South America (Argentina, Brazil and Rest of South America)
- Rest of World
PART A: GLOBAL MARKET PERSPECTIVE
1. INTRODUCTION
1.1 Product Outline
1.1.1 An Introduction to Smart Materials
1.1.2 Electrostrictive Materials
1.1.2.1 Lead Magnesium Niobate (PMN) and Lead Magnesium Niobate-Titanate (PMN-PT)
1.1.2.2 Electrostrictive Polymers
1.1.2.2.1 Relaxor Ferroelectric Polymers
1.1.2.2.2 Electrostrictive Graft Copolymers
1.1.2.2.3 Liquid Crystal Elastomers (LCEs)
1.1.3 Magnetostrictive Materials
1.1.3.1 Concept of Magnetostriction
1.1.3.2 A Brief History
1.1.3.3 Behavior of Magnetostrictive Materials
1.1.3.3.1 Magnetic Anisotropy
1.1.3.3.2 Magnetic Hysteresis
1.1.3.4 Properties of Magnetostrictive Materials
1.1.3.5 Production of Terfenol-D
1.1.4 Piezoelectric Materials
1.1.4.1 A History of Piezoelectricity
1.1.4.2 Types of Piezoelectric Materials
1.1.4.2.1 Piezocrystals
1.1.4.2.2 Piezoceramics
1.1.4.2.2.1 Barium Titanate (BaTiO3)
- Synthesis of Barium Titanate
- Conventional Solid-State Reaction
- Chemical Methods
- Sol-Gel Method
- Hydrothermal Method
- Coprecipitation Method
- Polymeric Precursor Method
- Mechanochemical Synthesis
- Piezoelectric Properties of BaTiO3
1.1.4.2.2.3 Lead Titanate (PbTiO3)
1.1.4.2.3 Piezopolymers
1.1.4.2.3.1 Semicrystalline Piezopolymers
- Polyvinylidene Fluoride (PVDF)
- Poly (Vinylidene Fluoride-Trifluoroethylene and Tetrafluoroethylene) Copolymers
- Other Semicrystalline Polymers
- Polyamides
- Polyureas
- Biopolymers
- Polyvinyl Chloride (PVC)
- PVDCN Copolymers
- Other VDCN Polymers
- Polyacrylonitrile (PAN)
- Nitrile-Substituted Polyimide
- Even Numbered Nylons
1.1.5 Phase Change Materials (PCMs)
1.1.5.1 Overview
1.1.5.2 Mechanism of PCMs
1.1.5.3 Types of PCMs
1.1.5.3.1 Inorganic PCMs
1.1.5.3.2 Organic PCMs
1.1.5.3.2.1 Paraffins
1.1.5.3.2.2 Non-Paraffins
1.1.5.3.3 Eutectic Mixtures
1.1.6 Shape Memory Alloys
1.1.6.1 A Brief History of SMAs
1.1.6.2 Fundamental Properties of SMAs
1.1.6.3 Types of SMAs
1.1.6.3.1 Copper-Based SMAs
1.1.6.3.2 Iron-Based SMAs
1.1.6.3.2.1 Material Properties
1.1.6.3.3 Nickel-Titanium (Ni-Ti) SMAs
1.1.7 Other Smart Materials
1.1.7.1 Wet Electroactive Polymers (EAPs)
1.1.7.2 Electrorheological and Magnetorheological Fluids
1.1.7.3 Electroluminescent and Photoluminescent Materials
1.1.7.4 Electrochromic Materials
2. KEY MARKET TRENDS
2.1 Lead-Free Piezoceramics Alternative to Lead-Based PZT
2.2 Waste Sawdust-Based Composite Phase Change Materials Show Superior Thermal Conductivity
2.3 Energy Harvesting Applications Get a Boost with Biodegradable Piezoelectric Polymer
2.4 Latest Advances in High Temperature Shape Memory Alloys
2.5 Thermal Properties of Bio-based PCMs Enhanced with Exfoliated Graphite Nanoplatelets
3. KEY GLOBAL PLAYERS
APC International Ltd. (The United States)
Arkema SA (France)
Cedrat Technologies SA (France)
Ceramtec GmbH (Germany)
Channel Technologies Group, LLC (The United States)
Climator Sweden AB (Sweden)
Croda International PLC (The United Kingdom)
Dynalloy, Inc. (The United States)
Fort Wayne Metals, Inc. (The United States)
G.RAU GmbH & Co., KG. (Germany)
Harris Corporation (The United States)
Honeywell Electronic Materials, Inc. (The United States)
Johnson Matthey Piezo Products GmbH (Germany)
Kyocera Corporation (Japan)
Metglas, Inc. (The United States)
Mid� Technology Corporation (The United States)
Morgan Advanced Materials PLC (The United Kingdom)
Noliac A/S (Denmark)
Peier Tech (China)
Phase Change Energy Solutions, Inc. (The United States)
Physik Instrumente (PI) GmbH & Co., KG. (Germany)
Piezo Kinetics, Inc. (The United States)
Qortek, Inc. (The United States)
Rubitherm Technologies GmbH (Germany)
SAES Getters SpA (Italy)
Smart Material Corporation (The United States)
Solvay SA (Belgium)
Ultimate Niti Technologies, Inc. (The United States)
4. KEY BUSINESS & PRODUCT TRENDS
Fine Tubes Ltd and International Titanium Association Conduct Presentation at Titanium Europe Conference 2018 in Seville, Spain
KYOCERA Corporation Launches New Ultra-Durable Coating Technology and Base Material
Fine Tubes Ltd Exhibits Titanium Based Tubes for Oil and Gas Extraction
KYOCERA Corporation Showcases Fine Ceramic Innovations at Hannover Messe 2018, Germany Trade Fair
AVX Corporation Launches New T4Z Medical Series HRC4000 Tantalum Capacitors for Non-Critical Medical Devices
SASOL Chemicals Announce Alumina Production Capacity
AMETEK to Exhibit at Titanium Asia 2018
Allegheny Technologies Incorporated Enters into Agreement with General Dynamics (GD) Land Systems
Fort Wayne Metals Buys G&S Titanium
ATI to Supply Nickel-Based Alloy Product for a Large Oil Pipeline Repair Project
LEMA™ Alumina-Based Materials from Morgan Advanced Materials are Ideal for Investment Casting of Turbine Engine Blades
AMETEK Showcases Specialty Metal Tube, Strip and Powder for Critical Medical Applications at Medical Design and Manufacturing Minneapolis Exhibition 2017
Allegheny Technologies Incorporated and Tsingshan Group Join Forces to Form Joint Venture Company
Croda International Plc Opens Centre of Innovation for Formulation Science at the University of Liverpool’s new Materials Innovation Factory (MIF)
Advanced Materials Development, LLC Expands in Columbia City
Morgan Advanced Materials Establishes Metals and Joining Center of Excellence in Hayward, California, USA
Allegheny Technologies Incorporated and GE Aviation Announce Titanium Joint Venture plant
Electric Vehicle Market Grows with the industry-Wide Adoption of Alumina and Silicon Carbide Components
Morgan Advanced Materials Develops New Materials P-57 and P-59 for Use in Aerospace Components
Fine Tubes Ltd and Superior Tube Presents Titanium, Stainless Steel and Nickel Alloy Tubes at Aeromart Toulouse, France
Morgan Advanced Materials Establishes New Silicon Carbide Manufacturing Facility in Stourport, UK
KYOCERA Corporation Unveils Super Alloy, Aluminum, Titanium and Cast Iron Cutting Tools at AMB Trade Fair in Stuttgart, Germany
Morgan Advanced Materials Launches New Nilcra® Zirconia TS Grade Ceramic Die for Copper and Brass Extrusion
Morgan Advanced Materials Unveils Hafnium Oxide Material
Morgan Advanced Materials Develops Zirconia Material
Honeywell Electronic Materials Inc Launches Honeywell PTM6000 Phase Change Material
Metglas, Inc Unveils MBF90 Alloy
Metlgas, Inc to Introduce MBF 601 and 602 Iron-Nickel based Brazing Foils
Morgan Advanced Materials Introduces PGS-100 Graphite-Loaded Silicon Carbon
AMETEK, Inc Acquires Global Tubes
Kuwait National Petroleum Company (KNPC) and Fine Tubes Ltd Enter into Contract
Fine Tubes Ltd and Superior Tube Co. Announce Titanium Tubing Solutions for Aerospace Applications
5. GLOBAL MARKET OVERVIEW
5.1 Global Smart Materials Market Overview by Material Type
5.1.1 Electrostrictive Materials Market Overview by Global Region
5.1.1.1 Global Electrostrictive Materials Market Overview by Material Sub-Type
5.1.1.1.1 Electrostrictive Materials Sub-Type Market Overview by Global Region
5.1.1.1.1.1 Lead Magnesium Niobate-Lead Titanate (PMN-PT)
5.1.1.1.1.2 Polymers
5.1.2 Magnetostrictive Materials Market Overview by Global Region
5.1.2.1 Global Magnetostrictive Materials Market Overview by Material Sub-Type
5.1.2.1.1 Magnetostrictive Materials Sub-Type Market Overview by Global Region
5.1.2.1.1.1 Ferrites
5.1.2.2.1.2 Rare Earth Materials
5.1.3 Piezoelectric Materials Market Overview by Global Region
5.1.3.1 Global Piezoelectric Materials Market Overview by Sub-Type
5.1.3.1.1 Piezoelectric Materials Sub-Type Market Overview by Global Region
5.1.3.1.1.1 Piezoceramics
5.1.3.2.1.2 Piezocomposites
5.1.3.2.1.3 Piezocrystals
5.1.3.2.1.4 Piezopolymers
5.1.4 Phase Change Materials Market Overview by Global Region
5.1.4.1 Global Phase Change Materials Market Overview by Sub-Type
5.1.4.1.1 Phase Change Materials Sub-Type Market Overview by Global Region
5.1.4.1.1.1 Bio-Based
5.1.4.2.1.2 Inorganic
5.1.4.2.1.3 Organic
5.1.5 Shape Memory Alloys Market Overview by Global Region
5.1.5.1 Global Shape Memory Alloys Market Overview by Sub-Type
5.1.5.1.1 Shape Memory Alloys Sub-Type Market Overview by Global Region
5.1.5.1.1.1 Copper-Based
5.1.5.1.1.2 Iron-Based
5.1.5.1.1.3 Nickel-Titanium
5.1.6 Other Smart Materials Market Overview by Global Region
PART B: REGIONAL MARKET PERSPECTIVE
REGIONAL MARKET OVERVIEW
6. NORTH AMERICA
6.1 North American Smart Materials Market Overview by Geographic Region
6.2 North American Smart Materials Market Overview by Material Type
6.2.1 North American Smart Materials Type Market Overview by Material Sub-Type
6.2.1.1 Electrostrictive Materials
6.2.1.2 Magnetostrictive Materials
6.2.1.3 Piezoelectric Materials
6.2.1.4 Phase Change Materials
6.2.1.5 Shape Memory Alloys
6.3 Major Market Players
AI Technology, Inc. (The United States)
Allegheny Technologies Incorporated (The United States)
APC International Ltd. (The United States)
AVX Corporation (The United States)
Channel Technologies Group, LLC (The United States)
Confluent Medical Technologies (The United States)
Dynalloy, Inc. (The United States)
Fort Wayne Metals, Inc. (The United States)
Harris Corporation (The United States)
Honeywell Electronic Materials, Inc. (The United States)
Metalwerks Pmd, Inc. (The United States)
Metglas, Inc. (The United States)
Mid� Technology Corporation (The United States)
Phase Change Energy Solutions, Inc. (The United States)
Piezo Kinetics, Inc. (The United States)
Qortek, Inc. (The United States)
Smart Material Corporation (The United States)
Ultimate Niti Technologies, Inc. (The United States)
6.4 Country-wise Analysis of North American Smart Materials Market
6.4.1 The United States
6.4.1.1 United States Smart Materials Market Overview by Material Type
6.4.1.1.1 United States Smart Materials Type Market Overview by Material Sub-Type
6.4.1.1.1.1 Electrostrictive Materials
6.4.1.1.1.2 Magnetostrictive Materials
6.4.1.1.1.3 Piezoelectric Materials
6.4.1.1.1.4 Phase Change Materials
6.4.1.1.1.5 Shape Memory Alloys
6.4.2 Canada
6.4.2.1 Canadian Smart Materials Market Overview by Material Type
6.4.2.1.1 Canadian Smart Materials Type Market Overview by Material Sub-Type
6.4.2.1.1.1 Electrostrictive Materials
6.4.2.1.1.2 Magnetostrictive Materials
6.4.2.1.1.3 Piezoelectric Materials
6.4.2.1.1.4 Phase Change Materials
6.4.2.1.1.5 Shape Memory Alloys
6.4.3 Mexico
6.4.3.1 Mexican Smart Materials Market Overview by Material Type
6.4.3.1.1 Mexican Smart Materials Type Market Overview by Material Sub-Type
6.4.3.1.1.1 Electrostrictive Materials
6.4.3.1.1.2 Magnetostrictive Materials
6.4.3.1.1.3 Piezoelectric Materials
6.4.3.1.1.4 Phase Change Materials
6.4.3.1.1.5 Shape Memory Alloys
7. EUROPE
7.1 European Smart Materials Market Overview by Geographic Region
7.2 European Smart Materials Market Overview by Material Type
7.2.1 European Smart Materials Type Market Overview by Material Sub-Type
7.2.1.1 Electrostrictive Materials
7.2.1.2 Magnetostrictive Materials
7.2.1.3 Piezoelectric Materials
7.2.1.4 Phase Change Materials
7.2.1.5 Shape Memory Alloys
7.3 Major Market Players
Admedes GmbH (Germany)
Arkema SA (France)
Cedrat Technologies SA (France)
Ceramtec GmbH (Germany)
Climator Sweden AB (Sweden)
Croda International PLC (The United Kingdom)
Euroflex GmbH (Germany)
Fine Tubes Ltd. (The United Kingdom)
G.RAU GmbH & Co., KG. (Germany)
Johnson Matthey Piezo Products GmbH (Germany)
Morgan Advanced Materials PLC (The United Kingdom)
Noliac A/S (Denmark)
Phase Change Material Products, Ltd. (The United Kingdom)
Physik Instrumente (PI) GmbH & Co., Kg. (Germany)
Rubitherm Technologies GmbH (Germany)
SAES Getters SpA (Italy)
Solvay SA (Belgium)
7.4 Country-wise Analysis of European Smart Materials Market
7.4.1 France
7.4.1.1 French Smart Materials Market Overview by Material Type
7.4.1.1.1 French Smart Materials Type Market Overview by Material Sub-Type
7.4.1.1.1.1 Electrostrictive Materials
7.4.1.1.1.2 Magnetostrictive Materials
7.4.1.1.1.3 Piezoelectric Materials
7.4.1.1.1.4 Phase Change Materials
7.4.1.1.1.5 Shape Memory Alloys
7.4.2 Germany
7.4.2.1 German Smart Materials Market Overview by Material Type
7.4.2.1.1 German Smart Materials Type Market Overview by Material Sub-Type
7.4.2.1.1.1 Electrostrictive Materials
7.4.2.1.1.2 Magnetostrictive Materials
7.4.2.1.1.3 Piezoelectric Materials
7.4.2.1.1.4 Phase Change Materials
7.4.2.1.1.5 Shape Memory Alloys
7.4.3 Italy
7.4.3.1 Italian Smart Materials Market Overview by Material Type
7.4.3.1.1 Italian Smart Materials Type Market Overview by Material Sub-Type
7.4.3.1.1.1 Electrostrictive Materials
7.4.3.1.1.2 Magnetostrictive Materials
7.4.3.1.1.3 Piezoelectric Materials
7.4.3.1.1.4 Phase Change Materials
7.4.3.1.1.5 Shape Memory Alloys
7.4.4 Russia
7.4.4.1 Russian Smart Materials Market Overview by Material Type
7.4.4.1.1 Russian Smart Materials Type Market Overview by Material Sub-Type
7.4.4.1.1.1 Electrostrictive Materials
7.4.4.1.1.2 Magnetostrictive Materials
7.4.4.1.1.3 Piezoelectric Materials
7.4.4.1.1.4 Phase Change Materials
7.4.4.1.1.5 Shape Memory Alloys
7.4.5 Spain
7.4.5.1 Spanish Smart Materials Market Overview by Material Type
7.4.5.1.1 Spanish Smart Materials Type Market Overview by Material Sub-Type
7.4.5.1.1.1 Electrostrictive Materials
7.4.5.1.1.2 Magnetostrictive Materials
7.4.5.1.1.3 Piezoelectric Materials
7.4.5.1.1.4 Phase Change Materials
7.4.5.1.1.5 Shape Memory Alloys
7.4.6 The United Kingdom
7.4.6.1 United Kingdom Smart Materials Market Overview by Material Type
7.4.6.1.1 United Kingdom Smart Materials Type Market Overview by Material Sub-Type
7.4.6.1.1.1 Electrostrictive Materials
7.4.6.1.1.2 Magnetostrictive Materials
7.4.6.1.1.3 Piezoelectric Materials
7.4.6.1.1.4 Phase Change Materials
7.4.6.1.1.5 Shape Memory Alloys
7.4.7 Rest of Europe
7.4.7.1 Rest of Europe Smart Materials Market Overview by Material Type
7.4.7.1.1 Rest of Europe Smart Materials Type Market Overview by Material Sub-Type
7.4.7.1.1.1 Electrostrictive Materials
7.4.7.1.1.2 Magnetostrictive Materials
7.4.7.1.1.3 Piezoelectric Materials
7.4.7.1.1.4 Phase Change Materials
7.4.7.1.1.5 Shape Memory Alloys
8. ASIA-PACIFIC
8.1 Asia-Pacific Smart Materials Market Overview by Geographic Region
8.2 Asia-Pacific Smart Materials Market Overview by Material Type
8.2.1 Asia-Pacific Smart Materials Type Market Overview by Material Sub-Type
8.2.1.1 Electrostrictive Materials
8.2.1.2 Magnetostrictive Materials
8.2.1.3 Piezoelectric Materials
8.2.1.4 Phase Change Materials
8.2.1.5 Shape Memory Alloys
8.3 Major Market Players
Baoji Seabird Metal Co., Ltd. (China)
Grikin Advanced Material Co., Ltd. (China)
Kyocera Corporation (Japan)
Nippon Seisen Co., Ltd. (Japan)
Nippon Steel & Sumitomo Metal Corporation (Japan)
Peier Tech (China)
TDK Corporation (Japan)
Xi'an Saite Metal Materials Development Co., Ltd. (China)
8.4 Country-wise Analysis of Asia-Pacific Smart Materials Market
8.4.1 China
8.4.1.1 Chinese Smart Materials Market Overview by Material Type
8.4.1.1.1 Chinese Smart Materials Type Market Overview by Material Sub-Type
8.4.1.1.1.1 Electrostrictive Materials
8.4.1.1.1.2 Magnetostrictive Materials
8.4.1.1.1.3 Piezoelectric Materials
8.4.1.1.1.4 Phase Change Materials
8.4.1.1.1.5 Shape Memory Alloys
8.4.2 India
8.4.2.1 Indian Smart Materials Market Overview by Material Type
8.4.2.1.1 Indian Smart Materials Type Market Overview by Material Sub-Type
8.4.2.1.1.1 Electrostrictive Materials
8.4.2.1.1.2 Magnetostrictive Materials
8.4.2.1.1.3 Piezoelectric Materials
8.4.2.1.1.4 Phase Change Materials
8.4.2.1.1.5 Shape Memory Alloys
8.4.3 Japan
8.4.3.1 Japanese Smart Materials Market Overview by Material Type
8.4.3.1.1 Japanese Smart Materials Type Market Overview by Material Sub-Type
8.4.3.1.1.1 Electrostrictive Materials
8.4.3.1.1.2 Magnetostrictive Materials
8.4.3.1.1.3 Piezoelectric Materials
8.4.3.1.1.4 Phase Change Materials
8.4.3.1.1.5 Shape Memory Alloys
8.4.4 South Korea
8.4.4.1 South Korean Smart Materials Market Overview by Material Type
8.4.4.1.1 South Korean Smart Materials Type Market Overview by Material Sub-Type
8.4.4.1.1.1 Electrostrictive Materials
8.4.4.1.1.2 Magnetostrictive Materials
8.4.4.1.1.3 Piezoelectric Materials
8.4.4.1.1.4 Phase Change Materials
8.4.4.1.1.5 Shape Memory Alloys
8.4.5 Rest of Asia-Pacific
8.4.5.1 Rest of Asia-Pacific Smart Materials Market Overview by Material Type
8.4.5.1.1 Rest of Asia-Pacific Smart Materials Type Market Overview by Material Sub-Type
8.4.5.1.1.1 Electrostrictive Materials
8.4.5.1.1.2 Magnetostrictive Materials
8.4.5.1.1.3 Piezoelectric Materials
8.4.5.1.1.4 Phase Change Materials
8.4.5.1.1.5 Shape Memory Alloys
9. SOUTH AMERICA
9.1 South American Smart Materials Market Overview by Geographic Region
9.2 South American Smart Materials Market Overview by Material Type
9.2.1 South American Smart Materials Type Market Overview by Material Sub-Type
9.2.1.1 Electrostrictive Materials
9.2.1.2 Magnetostrictive Materials
9.2.1.3 Piezoelectric Materials
9.2.1.4 Phase Change Materials
9.2.1.5 Shape Memory Alloys
9.3 Country-wise Analysis of South American Smart Materials Market
9.3.1 Argentina
9.3.1.1 Argentine Smart Materials Market Overview by Material Type
9.3.1.1.1 Argentine Smart Materials Type Market Overview by Material Sub-Type
9.3.1.1.1.1 Electrostrictive Materials
9.3.1.1.1.2 Magnetostrictive Materials
9.3.1.1.1.3 Piezoelectric Materials
9.3.1.1.1.4 Phase Change Materials
9.3.1.1.1.5 Shape Memory Alloys
9.3.2 Brazil
9.3.2.1 Brazilian Smart Materials Market Overview by Material Type
9.3.2.1.1 Brazilian Smart Materials Type Market Overview by Material Sub-Type
9.3.2.1.1.1 Electrostrictive Materials
9.3.2.1.1.2 Magnetostrictive Materials
9.3.2.1.1.3 Piezoelectric Materials
9.3.2.1.1.4 Phase Change Materials
9.3.2.1.1.5 Shape Memory Alloys
9.3.3 Rest of South America
9.3.3.1 Rest of South American Smart Materials Market Overview by Material Type
9.3.3.1.1 Rest of South American Smart Materials Type Market Overview by Material Sub-Type
9.3.3.1.1.1 Electrostrictive Materials
9.3.3.1.1.2 Magnetostrictive Materials
9.3.3.1.1.3 Piezoelectric Materials
9.3.3.1.1.4 Phase Change Materials
9.3.3.1.1.5 Shape Memory Alloys
10. REST OF WORLD
10.1 Rest of World Smart Materials Market Overview by Material Type
10.1.1 Rest of World Smart Materials Type Market Overview by Material Sub-Type
10.1.1.1 Electrostrictive Materials
10.1.1.2 Magnetostrictive Materials
10.1.1.3 Piezoelectric Materials
10.1.1.4 Phase Change Materials
10.1.1.5 Shape Memory Alloys
PART C: GUIDE TO THE INDUSTRY
1. NORTH AMERICA
2. EUROPE
3. ASIA-PACIFIC
PART D: ANNEXURE
1. RESEARCH METHODOLOGY
2. FEEDBACK
Charts & Graphs
PART A: GLOBAL MARKET PERSPECTIVE
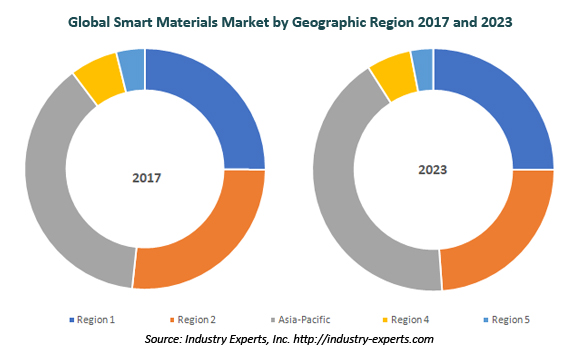
Chart 1: Global Smart Materials Market 2017 and 2023 by Geographic Region
Chart 2: Global Smart Materials Market 2017 and 2023 by Material Type
Chart 3: Global Smart Materials Market Analysis (2014-2023) in USD Million
Chart 4: Global Smart Materials Market Analysis (2014-2023) by Material Type – Electrostrictive Materials, Magnetostrictive Materials, Piezoelectric Materials, Phase Change Materials, Shape Memory Alloys and Other Smart Materials in USD Million
Chart 5: Glance at 2014, 2018 and 2023 Global Smart Materials Market Share (%) by Material Type – Electrostrictive Materials, Magnetostrictive Materials, Piezoelectric Materials, Phase Change Materials, Shape Memory Alloys and Other Smart Materials
Chart 6: Global Electrostrictive Materials Market Analysis (2014-2023) by Region – North America, Europe, Asia-Pacific, South America and Rest of World in USD Million
Chart 7: Glance at 2014, 2018 and 2023 Global Electrostrictive Materials Market Share (%) by Region – North America, Europe, Asia-Pacific, South America and Rest of World
Chart 8: Global Electrostrictive Materials Market Analysis (2014-2023) by Material Sub-Type – Lead Magnesium Niobate-Lead Titanate (PMN-PT) and Polymers in USD Million
Chart 9: Glance at 2014, 2018 and 2023 Global Electrostrictive Materials Market Share (%) by Material Sub-Type – Lead Magnesium Niobate-Lead Titanate (PMN-PT) and Polymers
Chart 10: Global Electrostrictive Lead Magnesium Niobate-Lead Titanate (PMN-PT) Market Analysis (2014-2023) by Region – North America, Europe, Asia-Pacific, South America and Rest of World in USD Million
Chart 11: Glance at 2014, 2018 and 2023 Global Electrostrictive Lead Magnesium Niobate-Lead Titanate (PMN-PT) Market Share (%) by Region – North America, Europe, Asia-Pacific, South America and Rest of World
Chart 12: Global Electrostrictive Polymers Market Analysis (2014-2023) by Region – North America, Europe, Asia-Pacific, South America and Rest of World in USD Million
Chart 13: Glance at 2014, 2018 and 2023 Global Electrostrictive Polymers Market Share (%) by Region – North America, Europe, Asia-Pacific, South America and Rest of World
Chart 14: Global Magnetostrictive Materials Market Analysis (2014-2023) by Region – North America, Europe, Asia-Pacific, South America and Rest of World in USD Million
Chart 15: Glance at 2014, 2018 and 2023 Global Magnetostrictive Materials Market Share (%) by Region – North America, Europe, Asia-Pacific, South America and Rest of World
Chart 16: Global Magnetostrictive Materials Market Analysis (2014-2023) by Material Sub-Type – Ferrites and Rare Earth Materials in USD Million
Chart 17: Glance at 2014, 2018 and 2023 Global Magnetostrictive Materials Market Share (%) by Material Sub-Type – Ferrites and Rare Earth Materials
Chart 18: Global Magnetostrictive Ferrites Market Analysis (2014-2023) by Region – North America, Europe, Asia-Pacific, South America and Rest of World in USD Million
Chart 19: Glance at 2014, 2018 and 2023 Global Magnetostrictive Ferrites Market Share (%) by Region – North America, Europe, Asia-Pacific, South America and Rest of World
Chart 20: Global Magnetostrictive Rare Earth Materials Market Analysis (2014-2023) by Region – North America, Europe, Asia-Pacific, South America and Rest of World in USD Million
Chart 21: Glance at 2014, 2018 and 2023 Global Magnetostrictive Rare Earth Materials Market Share (%) by Region – North America, Europe, Asia-Pacific, South America and Rest of World
Chart 22: Global Piezoelectric Materials Market Analysis (2014-2023) by Region – North America, Europe, Asia-Pacific, South America and Rest of World in USD Million
Chart 23: Glance at 2014, 2018 and 2023 Global Piezoelectric Materials Market Share (%) by Region – North America, Europe, Asia-Pacific, South America and Rest of World
Chart 24: Global Piezoelectric Materials Market Analysis (2014-2023) by Material Sub-Type – Piezoceramics, Piezocomposites, Piezocrystals and Piezopolymers in USD Million
Chart 25: Glance at 2014, 2018 and 2023 Global Piezoelectric Materials Market Share (%) by Material Sub-Type – Piezoceramics, Piezocomposites, Piezocrystals and Piezopolymers
Chart 26: Global Piezoceramics Market Analysis (2014-2023) by Region – North America, Europe, Asia-Pacific, South America and Rest of World in USD Million
Chart 27: Glance at 2014, 2018 and 2023 Global Piezoceramics Market Share (%) by Region – North America, Europe, Asia-Pacific, South America and Rest of World
Chart 28: Global Piezocomposites Market Analysis (2014-2023) by Region – North America, Europe, Asia-Pacific, South America and Rest of World in USD Million
Chart 29: Glance at 2014, 2018 and 2023 Global Piezocomposites Market Share (%) by Region – North America, Europe, Asia-Pacific, South America and Rest of World
Chart 30: Global Piezocrystals Market Analysis (2014-2023) by Region – North America, Europe, Asia-Pacific, South America and Rest of World in USD Million
Chart 31: Glance at 2014, 2018 and 2023 Global Piezocrystals Market Share (%) by Region – North America, Europe, Asia-Pacific, South America and Rest of World
Chart 32: Global Piezopolymers Market Analysis (2014-2023) by Region – North America, Europe, Asia-Pacific, South America and Rest of World in USD Million
Chart 33: Glance at 2014, 2018 and 2023 Global Piezopolymers Market Share (%) by Region – North America, Europe, Asia-Pacific, South America and Rest of World
Chart 34: Global Phase Change Materials Market Analysis (2014-2023) by Region – North America, Europe, Asia-Pacific, South America and Rest of World in USD Million
Chart 35: Glance at 2014, 2018 and 2023 Global Phase Change Materials Market Share (%) by Region – North America, Europe, Asia-Pacific, South America and Rest of World
Chart 36: Global Phase Change Materials Market Analysis (2014-2023) by Material Sub-Type – Bio-Based, Inorganic and Organic in USD Million
Chart 37: Glance at 2014, 2018 and 2023 Global Phase Change Materials Market Share (%) by Material Sub-Type – Bio-Based, Inorganic and Organic
Chart 38: Global Bio-Based Phase Change Materials Market Analysis (2014-2023) by Region – North America, Europe, Asia-Pacific, South America and Rest of World in USD Million
Chart 39: Glance at 2014, 2018 and 2023 Global Bio-Based Phase Change Materials Market Share (%) by Region – North America, Europe, Asia-Pacific, South America and Rest of World
Chart 40: Global Inorganic Phase Change Materials Market Analysis (2014-2023) by Region – North America, Europe, Asia-Pacific, South America and Rest of World in USD Million
Chart 41: Glance at 2014, 2018 and 2023 Global Inorganic Phase Change Materials Market Share (%) by Region – North America, Europe, Asia-Pacific, South America and Rest of World
Chart 42: Global Organic Phase Change Materials Market Analysis (2014-2023) by Region – North America, Europe, Asia-Pacific, South America and Rest of World in USD Million
Chart 43: Glance at 2014, 2018 and 2023 Global Organic Phase Change Materials Market Share (%) by Region – North America, Europe, Asia-Pacific, South America and Rest of World
Chart 44: Global Shape Memory Alloys Market Analysis (2014-2023) by Region – North America, Europe, Asia-Pacific, South America and Rest of World in USD Million
Chart 45: Glance at 2014, 2018 and 2023 Global Shape Memory Alloys Market Share (%) by Region – North America, Europe, Asia-Pacific, South America and Rest of World
Chart 46: Global Shape Memory Alloys Market Analysis (2014-2023) by Material Sub-Type – Copper-Based, Iron-Based and Nickel-Titanium in USD Million
Chart 47: Glance at 2014, 2018 and 2023 Global Shape Memory Alloys Market Share (%) by Material Sub-Type – Copper-Based, Iron-Based and Nickel-Titanium
Chart 48: Global Copper-Based Shape Memory Alloys Market Analysis (2014-2023) by Region – North America, Europe, Asia-Pacific, South America and Rest of World in USD Million
Chart 49: Glance at 2014, 2018 and 2023 Copper-Based Shape Memory Alloys Market Share (%) by Region – North America, Europe, Asia-Pacific, South America and Rest of World
Chart 50: Global Iron-Based Shape Memory Alloys Market Analysis (2014-2023) by Region – North America, Europe, Asia-Pacific, South America and Rest of World in USD Million
Chart 51: Glance at 2014, 2018 and 2023 Iron-Based Shape Memory Alloys Market Share (%) by Region – North America, Europe, Asia-Pacific, South America and Rest of World
Chart 52: Global Nickel-Titanium Shape Memory Alloys Market Analysis (2014-2023) by Region – North America, Europe, Asia-Pacific, South America and Rest of World in USD Million
Chart 53: Glance at 2014, 2018 and 2023 Nickel-Titanium Shape Memory Alloys Market Share (%) by Region – North America, Europe, Asia-Pacific, South America and Rest of World
Chart 54: Global Other Smart Materials Market Analysis (2014-2023) by Region – North America, Europe, Asia-Pacific, South America and Rest of World in USD Million
Chart 55: Glance at 2014, 2018 and 2023 Other Smart Materials Market Share (%) by Region – North America, Europe, Asia-Pacific, South America and Rest of World
PART B: REGIONAL MARKET PERSPECTIVE
Chart 56: Global Smart Materials Market Analysis (2014-2023) by Region – North America, Europe, Asia-Pacific, South America and Rest of World in USD Million
Chart 57: Glance at 2014, 2018 and 2023 Global Smart Materials Market Share (%) by Region – North America, Europe, Asia-Pacific, South America and Rest of World
REGIONAL MARKET OVERVIEW
NORTH AMERICA
Chart 58: North American Smart Materials Market Analysis (2014-2023) in USD Million
Chart 59: North American Smart Materials Market Analysis (2014-2023) by Region – United States, Canada and Mexico in USD Million
Chart 60: Glance at 2014, 2018 and 2023 North American Smart Materials Market Share (%) by Region – United States, Canada and Mexico
Chart 61: North American Smart Materials Market Analysis (2014-2023) by Material Type – Electrostrictive Materials, Magnetostrictive Materials, Piezoelectric Materials, Phase Change Materials, Shape Memory Alloys and Other Smart Materials in USD Million
Chart 62: Glance at 2014, 2018 and 2023 North American Smart Materials Market Share (%) by Material Type – Electrostrictive Materials, Magnetostrictive Materials, Piezoelectric Materials, Phase Change Materials, Shape Memory Alloys and Other Smart Materials
Chart 63: North American Electrostrictive Materials Market Analysis (2014-2023) by Material Sub-Type – Lead Magnesium Niobate-Lead Titanate (PMN-PT) and Polymers in USD Million
Chart 64: Glance at 2014, 2018 and 2023 North American Electrostrictive Materials Market Share (%) by Material Sub-Type – Lead Magnesium Niobate-Lead Titanate (PMN-PT) and Polymers
Chart 65: North American Magnetostrictive Materials Market Analysis (2014-2023) by Material Sub-Type – Ferrites and Rare Earth Materials in USD Million
Chart 66: Glance at 2014, 2018 and 2023 North American Magnetostrictive Materials Market Share (%) by Material Sub-Type – Ferrites and Rare Earth Materials
Chart 67: North American Piezoelectric Materials Market Analysis (2014-2023) by Material Sub-Type – Piezoceramics, Piezocomposites, Piezocrystals and Piezopolymers in USD Million
Chart 68: Glance at 2014, 2018 and 2023 North American Piezoelectric Materials Market Share (%) by Material Sub-Type – Piezoceramics, Piezocomposites, Piezocrystals and Piezopolymers
Chart 69: North American Phase Change Materials Market Analysis (2014-2023) by Material Sub-Type – Bio-Based, Inorganic and Organic in USD Million
Chart 70: Glance at 2014, 2018 and 2023 North American Phase Change Materials Market Share (%) by Material Sub-Type – Bio-Based, Inorganic and Organic
Chart 71: North American Shape Memory Alloys Market Analysis (2014-2023) by Material Sub-Type – Copper-Based, Iron-Based and Nickel-Titanium in USD Million
Chart 72: Glance at 2014, 2018 and 2023 North American Shape Memory Alloys Market Share (%) by Material Sub-Type – Copper-Based, Iron-Based and Nickel-Titanium
The United States
Chart 73: United States Smart Materials Market Analysis (2014-2023) in USD Million
Chart 74: United States Smart Materials Market Analysis (2014-2023) by Material Type – Electrostrictive Materials, Magnetostrictive Materials, Piezoelectric Materials, Phase Change Materials, Shape Memory Alloys and Other Smart Materials in USD Million
Chart 75: Glance at 2014, 2018 and 2023 United States Smart Materials Market Share (%) by Material Type – Electrostrictive Materials, Magnetostrictive Materials, Piezoelectric Materials, Phase Change Materials, Shape Memory Alloys and Other Smart Materials
Chart 76: United States Electrostrictive Materials Market Analysis (2014-2023) by Material Sub-Type – Lead Magnesium Niobate-Lead Titanate (PMN-PT) and Polymers in USD Million
Chart 77: Glance at 2014, 2018 and 2023 United States Electrostrictive Materials Market Share (%) by Material Sub-Type – Lead Magnesium Niobate-Lead Titanate (PMN-PT) and Polymers
Chart 78: United States Magnetostrictive Materials Market Analysis (2014-2023) by Material Sub-Type – Ferrites and Rare Earth Materials in USD Million
Chart 79: Glance at 2014, 2018 and 2023 United States Magnetostrictive Materials Market Share (%) by Material Sub-Type – Ferrites and Rare Earth Materials
Chart 80: United States Piezoelectric Materials Market Analysis (2014-2023) by Material Sub-Type – Piezoceramics, Piezocomposites, Piezocrystals and Piezopolymers in USD Million
Chart 81: Glance at 2014, 2018 and 2023 United States Piezoelectric Materials Market Share (%) by Material Sub-Type – Piezoceramics, Piezocomposites, Piezocrystals and Piezopolymers
Chart 82: United States Phase Change Materials Market Analysis (2014-2023) by Material Sub-Type – Bio-Based, Inorganic and Organic in USD Million
Chart 83: Glance at 2014, 2018 and 2023 United States Phase Change Materials Market Share (%) by Material Sub-Type – Bio-Based, Inorganic and Organic
Chart 84: United States Shape Memory Alloys Market Analysis (2014-2023) by Material Sub-Type – Copper-Based, Iron-Based and Nickel-Titanium in USD Million
Chart 85: Glance at 2014, 2018 and 2023 United States Shape Memory Alloys Market Share (%) by Material Sub-Type – Copper-Based, Iron-Based and Nickel-Titanium
Canada
Chart 86: Canadian Smart Materials Market Analysis (2014-2023) in USD Million
Chart 87: Canadian Smart Materials Market Analysis (2014-2023) by Material Type – Electrostrictive Materials, Magnetostrictive Materials, Piezoelectric Materials, Phase Change Materials, Shape Memory Alloys and Other Smart Materials in USD Million
Chart 88: Glance at 2014, 2018 and 2023 Canadian Smart Materials Market Share (%) by Material Type – Electrostrictive Materials, Magnetostrictive Materials, Piezoelectric Materials, Phase Change Materials, Shape Memory Alloys and Other Smart Materials
Chart 89: Canadian Electrostrictive Materials Market Analysis (2014-2023) by Material Sub-Type – Lead Magnesium Niobate-Lead Titanate (PMN-PT) and Polymers in USD Million
Chart 90: Glance at 2014, 2018 and 2023 Canadian Electrostrictive Materials Market Share (%) by Material Sub-Type – Lead Magnesium Niobate-Lead Titanate (PMN-PT) and Polymers
Chart 91: Canadian Magnetostrictive Materials Market Analysis (2014-2023) by Material Sub-Type – Ferrites and Rare Earth Materials in USD Million
Chart 92: Glance at 2014, 2018 and 2023 Canadian Magnetostrictive Materials Market Share (%) by Material Sub-Type – Ferrites and Rare Earth Materials
Chart 93: Canadian Piezoelectric Materials Market Analysis (2014-2023) by Material Sub-Type – Piezoceramics, Piezocomposites, Piezocrystals and Piezopolymers in USD Million
Chart 94: Glance at 2014, 2018 and 2023 Canadian Piezoelectric Materials Market Share (%) by Material Sub-Type – Piezoceramics, Piezocomposites, Piezocrystals and Piezopolymers
Chart 95: Canadian Phase Change Materials Market Analysis (2014-2023) by Material Sub-Type – Bio-Based, Inorganic and Organic in USD Million
Chart 96: Glance at 2014, 2018 and 2023 Canadian Phase Change Materials Market Share (%) by Material Sub-Type – Bio-Based, Inorganic and Organic
Chart 97: Canadian Shape Memory Alloys Market Analysis (2014-2023) by Material Sub-Type – Copper-Based, Iron-Based and Nickel-Titanium in USD Million
Chart 98: Glance at 2014, 2018 and 2023 Canadian Shape Memory Alloys Market Share (%) by Material Sub-Type – Copper-Based, Iron-Based and Nickel-Titanium
Mexico
Chart 99: Mexican Smart Materials Market Analysis (2014-2023) in USD Million
Chart 100: Mexican Smart Materials Market Analysis (2014-2023) by Material Type – Electrostrictive Materials, Magnetostrictive Materials, Piezoelectric Materials, Phase Change Materials, Shape Memory Alloys and Other Smart Materials in USD Million
Chart 101: Glance at 2014, 2018 and 2023 Mexican Smart Materials Market Share (%) by Material Type – Electrostrictive Materials, Magnetostrictive Materials, Piezoelectric Materials, Phase Change Materials, Shape Memory Alloys and Other Smart Materials
Chart 102: Mexican Electrostrictive Materials Market Analysis (2014-2023) by Material Sub-Type – Lead Magnesium Niobate-Lead Titanate (PMN-PT) and Polymers in USD Million
Chart 103: Glance at 2014, 2018 and 2023 Mexican Electrostrictive Materials Market Share (%) by Material Sub-Type – Lead Magnesium Niobate-Lead Titanate (PMN-PT) and Polymers
Chart 104: Mexican Magnetostrictive Materials Market Analysis (2014-2023) by Material Sub-Type – Ferrites and Rare Earth Materials in USD Million
Chart 105: Glance at 2014, 2018 and 2023 Mexican Magnetostrictive Materials Market Share (%) by Material Sub-Type – Ferrites and Rare Earth Materials
Chart 106: Mexican Piezoelectric Materials Market Analysis (2014-2023) by Material Sub-Type – Piezoceramics, Piezocomposites, Piezocrystals and Piezopolymers in USD Million
Chart 107: Glance at 2014, 2018 and 2023 Mexican Piezoelectric Materials Market Share (%) by Material Sub-Type – Piezoceramics, Piezocomposites, Piezocrystals and Piezopolymers
Chart 108: Mexican Phase Change Materials Market Analysis (2014-2023) by Material Sub-Type – Bio-Based, Inorganic and Organic in USD Million
Chart 109: Glance at 2014, 2018 and 2023 Mexican Phase Change Materials Market Share (%) by Material Sub-Type – Bio-Based, Inorganic and Organic
Chart 110: Mexican Shape Memory Alloys Market Analysis (2014-2023) by Material Sub-Type – Copper-Based, Iron-Based and Nickel-Titanium in USD Million
Chart 111: Glance at 2014, 2018 and 2023 Mexican Shape Memory Alloys Market Share (%) by Material Sub-Type – Copper-Based, Iron-Based and Nickel-Titanium
EUROPE
Chart 112: European Smart Materials Market Analysis (2014-2023) in USD Million
Chart 113: European Smart Materials Market Analysis (2014-2023) by Region – France, Germany, Italy, Russia, Spain, United Kingdom and Rest of Europe in USD Million
Chart 114: Glance at 2014, 2018 and 2023 European Smart Materials Market Share (%) by Region – France, Germany, Italy, Russia, Spain, United Kingdom and Rest of Europe
Chart 115: European Smart Materials Market Analysis (2014-2023) by Material Type – Electrostrictive Materials, Magnetostrictive Materials, Piezoelectric Materials, Phase Change Materials, Shape Memory Alloys and Other Smart Materials in USD Million
Chart 116: Glance at 2014, 2018 and 2023 European Smart Materials Market Share (%) by Material Type – Electrostrictive Materials, Magnetostrictive Materials, Piezoelectric Materials, Phase Change Materials, Shape Memory Alloys and Other Smart Materials
Chart 117: European Electrostrictive Materials Market Analysis (2014-2023) by Material Sub-Type – Lead Magnesium Niobate-Lead Titanate (PMN-PT) and Polymers in USD Million
Chart 118: Glance at 2014, 2018 and 2023 European Electrostrictive Materials Market Share (%) by Material Sub-Type – Lead Magnesium Niobate-Lead Titanate (PMN-PT) and Polymers
Chart 119: European Magnetostrictive Materials Market Analysis (2014-2023) by Material Sub-Type – Ferrites and Rare Earth Materials in USD Million
Chart 120: Glance at 2014, 2018 and 2023 European Magnetostrictive Materials Market Share (%) by Material Sub-Type – Ferrites and Rare Earth Materials
Chart 121: European Piezoelectric Materials Market Analysis (2014-2023) by Material Sub-Type – Piezoceramics, Piezocomposites, Piezocrystals and Piezopolymers in USD Million
Chart 122: Glance at 2014, 2018 and 2023 European Piezoelectric Materials Market Share (%) by Material Sub-Type – Piezoceramics, Piezocomposites, Piezocrystals and Piezopolymers
Chart 123: European Phase Change Materials Market Analysis (2014-2023) by Material Sub-Type – Bio-Based, Inorganic and Organic in USD Million
Chart 124: Glance at 2014, 2018 and 2023 European Phase Change Materials Market Share (%) by Material Sub-Type – Bio-Based, Inorganic and Organic
Chart 125: European Shape Memory Alloys Market Analysis (2014-2023) by Material Sub-Type – Copper-Based, Iron-Based and Nickel-Titanium in USD Million
Chart 126: Glance at 2014, 2018 and 2023 European Shape Memory Alloys Market Share (%) by Material Sub-Type – Copper-Based, Iron-Based and Nickel-Titanium
France
Chart 127: French Smart Materials Market Analysis (2014-2023) in USD Million
Chart 128: French Smart Materials Market Analysis (2014-2023) by Material Type – Electrostrictive Materials, Magnetostrictive Materials, Piezoelectric Materials, Phase Change Materials, Shape Memory Alloys and Other Smart Materials in USD Million
Chart 129: Glance at 2014, 2018 and 2023 French Smart Materials Market Share (%) by Material Type – Electrostrictive Materials, Magnetostrictive Materials, Piezoelectric Materials, Phase Change Materials, Shape Memory Alloys and Other Smart Materials
Chart 130: French Electrostrictive Materials Market Analysis (2014-2023) by Material Sub-Type – Lead Magnesium Niobate-Lead Titanate (PMN-PT) and Polymers in USD Million
Chart 131: Glance at 2014, 2018 and 2023 French Electrostrictive Materials Market Share (%) by Material Sub-Type – Lead Magnesium Niobate-Lead Titanate (PMN-PT) and Polymers
Chart 132: French Magnetostrictive Materials Market Analysis (2014-2023) by Material Sub-Type – Ferrites and Rare Earth Materials in USD Million
Chart 133: Glance at 2014, 2018 and 2023 French Magnetostrictive Materials Market Share (%) by Material Sub-Type – Ferrites and Rare Earth Materials
Chart 134: French Piezoelectric Materials Market Analysis (2014-2023) by Material Sub-Type – Piezoceramics, Piezocomposites, Piezocrystals and Piezopolymers in USD Million
Chart 135: Glance at 2014, 2018 and 2023 French Piezoelectric Materials Market Share (%) by Material Sub-Type – Piezoceramics, Piezocomposites, Piezocrystals and Piezopolymers
Chart 136: French Phase Change Materials Market Analysis (2014-2023) by Material Sub-Type – Bio-Based, Inorganic and Organic in USD Million
Chart 137: Glance at 2014, 2018 and 2023 French Phase Change Materials Market Share (%) by Material Sub-Type – Bio-Based, Inorganic and Organic
Chart 138: French Shape Memory Alloys Market Analysis (2014-2023) by Material Sub-Type – Copper-Based, Iron-Based and Nickel-Titanium in USD Million
Chart 139: Glance at 2014, 2018 and 2023 French Shape Memory Alloys Market Share (%) by Material Sub-Type – Copper-Based, Iron-Based and Nickel-Titanium
Germany
Chart 140: German Smart Materials Market Analysis (2014-2023) in USD Million
Chart 141: German Smart Materials Market Analysis (2014-2023) by Material Type – Electrostrictive Materials, Magnetostrictive Materials, Piezoelectric Materials, Phase Change Materials, Shape Memory Alloys and Other Smart Materials in USD Million
Chart 142: Glance at 2014, 2018 and 2023 German Smart Materials Market Share (%) by Material Type – Electrostrictive Materials, Magnetostrictive Materials, Piezoelectric Materials, Phase Change Materials, Shape Memory Alloys and Other Smart Materials
Chart 143: German Electrostrictive Materials Market Analysis (2014-2023) by Material Sub-Type – Lead Magnesium Niobate-Lead Titanate (PMN-PT) and Polymers in USD Million
Chart 144: Glance at 2014, 2018 and 2023 German Electrostrictive Materials Market Share (%) by Material Sub-Type – Lead Magnesium Niobate-Lead Titanate (PMN-PT) and Polymers
Chart 145: German Magnetostrictive Materials Market Analysis (2014-2023) by Material Sub-Type – Ferrites and Rare Earth Materials in USD Million
Chart 146: Glance at 2014, 2018 and 2023 German Magnetostrictive Materials Market Share (%) by Material Sub-Type – Ferrites and Rare Earth Materials
Chart 147: German Piezoelectric Materials Market Analysis (2014-2023) by Material Sub-Type – Piezoceramics, Piezocomposites, Piezocrystals and Piezopolymers in USD Million
Chart 148: Glance at 2014, 2018 and 2023 German Piezoelectric Materials Market Share (%) by Material Sub-Type – Piezoceramics, Piezocomposites, Piezocrystals and Piezopolymers
Chart 149: German Phase Change Materials Market Analysis (2014-2023) by Material Sub-Type – Bio-Based, Inorganic and Organic in USD Million
Chart 150: Glance at 2014, 2018 and 2023 German Phase Change Materials Market Share (%) by Material Sub-Type – Bio-Based, Inorganic and Organic
Chart 151: German Shape Memory Alloys Market Analysis (2014-2023) by Material Sub-Type – Copper-Based, Iron-Based and Nickel-Titanium in USD Million
Chart 152: Glance at 2014, 2018 and 2023 German Shape Memory Alloys Market Share (%) by Material Sub-Type – Copper-Based, Iron-Based and Nickel-Titanium
Italy
Chart 153: Italian Smart Materials Market Analysis (2014-2023) in USD Million
Chart 154: Italian Smart Materials Market Analysis (2014-2023) by Material Type – Electrostrictive Materials, Magnetostrictive Materials, Piezoelectric Materials, Phase Change Materials, Shape Memory Alloys and Other Smart Materials in USD Million
Chart 155: Glance at 2014, 2018 and 2023 Italian Smart Materials Market Share (%) by Material Type – Electrostrictive Materials, Magnetostrictive Materials, Piezoelectric Materials, Phase Change Materials, Shape Memory Alloys and Other Smart Materials
Chart 156: Italian Electrostrictive Materials Market Analysis (2014-2023) by Material Sub-Type – Lead Magnesium Niobate-Lead Titanate (PMN-PT) and Polymers in USD Million
Chart 157: Glance at 2014, 2018 and 2023 Italian Electrostrictive Materials Market Share (%) by Material Sub-Type – Lead Magnesium Niobate-Lead Titanate (PMN-PT) and Polymers
Chart 158: Italian Magnetostrictive Materials Market Analysis (2014-2023) by Material Sub-Type – Ferrites and Rare Earth Materials in USD Million
Chart 159: Glance at 2014, 2018 and 2023 Italian Magnetostrictive Materials Market Share (%) by Material Sub-Type – Ferrites and Rare Earth Materials
Chart 160: Italian Piezoelectric Materials Market Analysis (2014-2023) by Material Sub-Type – Piezoceramics, Piezocomposites, Piezocrystals and Piezopolymers in USD Million
Chart 161: Glance at 2014, 2018 and 2023 Italian Piezoelectric Materials Market Share (%) by Material Sub-Type – Piezoceramics, Piezocomposites, Piezocrystals and Piezopolymers
Chart 162: Italian Phase Change Materials Market Analysis (2014-2023) by Material Sub-Type – Bio-Based, Inorganic and Organic in USD Million
Chart 163: Glance at 2014, 2018 and 2023 Italian Phase Change Materials Market Share (%) by Material Sub-Type – Bio-Based, Inorganic and Organic
Chart 164: Italian Shape Memory Alloys Market Analysis (2014-2023) by Material Sub-Type – Copper-Based, Iron-Based and Nickel-Titanium in USD Million
Chart 165: Glance at 2014, 2018 and 2023 Italian Shape Memory Alloys Market Share (%) by Material Sub-Type – Copper-Based, Iron-Based and Nickel-Titanium
Russia
Chart 166: Russian Smart Materials Market Analysis (2014-2023) in USD Million
Chart 167: Russian Smart Materials Market Analysis (2014-2023) by Material Type – Electrostrictive Materials, Magnetostrictive Materials, Piezoelectric Materials, Phase Change Materials, Shape Memory Alloys and Other Smart Materials in USD Million
Chart 168: Glance at 2014, 2018 and 2023 Russian Smart Materials Market Share (%) by Material Type – Electrostrictive Materials, Magnetostrictive Materials, Piezoelectric Materials, Phase Change Materials, Shape Memory Alloys and Other Smart Materials
Chart 169: Russian Electrostrictive Materials Market Analysis (2014-2023) by Material Sub-Type – Lead Magnesium Niobate-Lead Titanate (PMN-PT) and Polymers in USD Million
Chart 170: Glance at 2014, 2018 and 2023 Russian Electrostrictive Materials Market Share (%) by Material Sub-Type – Lead Magnesium Niobate-Lead Titanate (PMN-PT) and Polymers
Chart 171: Russian Magnetostrictive Materials Market Analysis (2014-2023) by Material Sub-Type – Ferrites and Rare Earth Materials in USD Million
Chart 172: Glance at 2014, 2018 and 2023 Russian Magnetostrictive Materials Market Share (%) by Material Sub-Type – Ferrites and Rare Earth Materials
Chart 173: Russian Piezoelectric Materials Market Analysis (2014-2023) by Material Sub-Type – Piezoceramics, Piezocomposites, Piezocrystals and Piezopolymers in USD Million
Chart 174: Glance at 2014, 2018 and 2023 Russian Piezoelectric Materials Market Share (%) by Material Sub-Type – Piezoceramics, Piezocomposites, Piezocrystals and Piezopolymers
Chart 175: Russian Phase Change Materials Market Analysis (2014-2023) by Material Sub-Type – Bio-Based, Inorganic and Organic in USD Million
Chart 176: Glance at 2014, 2018 and 2023 Russian Phase Change Materials Market Share (%) by Material Sub-Type – Bio-Based, Inorganic and Organic
Chart 177: Russian Shape Memory Alloys Market Analysis (2014-2023) by Material Sub-Type – Copper-Based, Iron-Based and Nickel-Titanium in USD Million
Chart 178: Glance at 2014, 2018 and 2023 Russian Shape Memory Alloys Market Share (%) by Material Sub-Type – Copper-Based, Iron-Based and Nickel-Titanium
Spain
Chart 179: Spanish Smart Materials Market Analysis (2014-2023) in USD Million
Chart 180: Spanish Smart Materials Market Analysis (2014-2023) by Material Type – Electrostrictive Materials, Magnetostrictive Materials, Piezoelectric Materials, Phase Change Materials, Shape Memory Alloys and Other Smart Materials in USD Million
Chart 181: Glance at 2014, 2018 and 2023 Spanish Smart Materials Market Share (%) by Material Type – Electrostrictive Materials, Magnetostrictive Materials, Piezoelectric Materials, Phase Change Materials, Shape Memory Alloys and Other Smart Materials
Chart 182: Spanish Electrostrictive Materials Market Analysis (2014-2023) by Material Sub-Type – Lead Magnesium Niobate-Lead Titanate (PMN-PT) and Polymers in USD Million
Chart 183: Glance at 2014, 2018 and 2023 Spanish Electrostrictive Materials Market Share (%) by Material Sub-Type – Lead Magnesium Niobate-Lead Titanate (PMN-PT) and Polymers
Chart 184: Spanish Magnetostrictive Materials Market Analysis (2014-2023) by Material Sub-Type – Ferrites and Rare Earth Materials in USD Million
Chart 185: Glance at 2014, 2018 and 2023 Spanish Magnetostrictive Materials Market Share (%) by Material Sub-Type – Ferrites and Rare Earth Materials
Chart 186: Spanish Piezoelectric Materials Market Analysis (2014-2023) by Material Sub-Type – Piezoceramics, Piezocomposites, Piezocrystals and Piezopolymers in USD Million
Chart 187: Glance at 2014, 2018 and 2023 Spanish Piezoelectric Materials Market Share (%) by Material Sub-Type – Piezoceramics, Piezocomposites, Piezocrystals and Piezopolymers
Chart 188: Spanish Phase Change Materials Market Analysis (2014-2023) by Material Sub-Type – Bio-Based, Inorganic and Organic in USD Million
Chart 189: Glance at 2014, 2018 and 2023 Spanish Phase Change Materials Market Share (%) by Material Sub-Type – Bio-Based, Inorganic and Organic
Chart 190: Spanish Shape Memory Alloys Market Analysis (2014-2023) by Material Sub-Type – Copper-Based, Iron-Based and Nickel-Titanium in USD Million
Chart 191: Glance at 2014, 2018 and 2023 Spanish Shape Memory Alloys Market Share (%) by Material Sub-Type – Copper-Based, Iron-Based and Nickel-Titanium
The United Kingdom
Chart 192: United Kingdom Smart Materials Market Analysis (2014-2023) in USD Million
Chart 193: United Kingdom Smart Materials Market Analysis (2014-2023) by Material Type – Electrostrictive Materials, Magnetostrictive Materials, Piezoelectric Materials, Phase Change Materials, Shape Memory Alloys and Other Smart Materials in USD Million
Chart 194: Glance at 2014, 2018 and 2023 United Kingdom Smart Materials Market Share (%) by Material Type – Electrostrictive Materials, Magnetostrictive Materials, Piezoelectric Materials, Phase Change Materials, Shape Memory Alloys and Other Smart Materials
Chart 195: United Kingdom Electrostrictive Materials Market Analysis (2014-2023) by Material Sub-Type – Lead Magnesium Niobate-Lead Titanate (PMN-PT) and Polymers in USD Million
Chart 196: Glance at 2014, 2018 and 2023 United Kingdom Electrostrictive Materials Market Share (%) by Material Sub-Type – Lead Magnesium Niobate-Lead Titanate (PMN-PT) and Polymers
Chart 197: United Kingdom Magnetostrictive Materials Market Analysis (2014-2023) by Material Sub-Type – Ferrites and Rare Earth Materials in USD Million
Chart 198: Glance at 2014, 2018 and 2023 United Kingdom Magnetostrictive Materials Market Share (%) by Material Sub-Type – Ferrites and Rare Earth Materials
Chart 199: United Kingdom Piezoelectric Materials Market Analysis (2014-2023) by Material Sub-Type – Piezoceramics, Piezocomposites, Piezocrystals and Piezopolymers in USD Million
Chart 200: Glance at 2014, 2018 and 2023 United Kingdom Piezoelectric Materials Market Share (%) by Material Sub-Type – Piezoceramics, Piezocomposites, Piezocrystals and Piezopolymers
Chart 201: United Kingdom Phase Change Materials Market Analysis (2014-2023) by Material Sub-Type – Bio-Based, Inorganic and Organic in USD Million
Chart 202: Glance at 2014, 2018 and 2023 United Kingdom Phase Change Materials Market Share (%) by Material Sub-Type – Bio-Based, Inorganic and Organic
Chart 203: United Kingdom Shape Memory Alloys Market Analysis (2014-2023) by Material Sub-Type – Copper-Based, Iron-Based and Nickel-Titanium in USD Million
Chart 204: Glance at 2014, 2018 and 2023 United Kingdom Shape Memory Alloys Market Share (%) by Material Sub-Type – Copper-Based, Iron-Based and Nickel-Titanium
Rest of Europe
Chart 205: Rest of Europe Smart Materials Market Analysis (2014-2023) in USD Million
Chart 206: Rest of Europe Smart Materials Market Analysis (2014-2023) by Material Type – Electrostrictive Materials, Magnetostrictive Materials, Piezoelectric Materials, Phase Change Materials, Shape Memory Alloys and Other Smart Materials in USD Million
Chart 207: Glance at 2014, 2018 and 2023 Rest of Europe Smart Materials Market Share (%) by Material Type – Electrostrictive Materials, Magnetostrictive Materials, Piezoelectric Materials, Phase Change Materials, Shape Memory Alloys and Other Smart Materials
Chart 208: Rest of Europe Electrostrictive Materials Market Analysis (2014-2023) by Material Sub-Type – Lead Magnesium Niobate-Lead Titanate (PMN-PT) and Polymers in USD Million
Chart 209: Glance at 2014, 2018 and 2023 Rest of Europe Electrostrictive Materials Market Share (%) by Material Sub-Type – Lead Magnesium Niobate-Lead Titanate (PMN-PT) and Polymers
Chart 210: Rest of Europe Magnetostrictive Materials Market Analysis (2014-2023) by Material Sub-Type – Ferrites and Rare Earth Materials in USD Million
Chart 211: Glance at 2014, 2018 and 2023 Rest of Europe Magnetostrictive Materials Market Share (%) by Material Sub-Type – Ferrites and Rare Earth Materials
Chart 212: Rest of Europe Piezoelectric Materials Market Analysis (2014-2023) by Material Sub-Type – Piezoceramics, Piezocomposites, Piezocrystals and Piezopolymers in USD Million
Chart 213: Glance at 2014, 2018 and 2023 Rest of Europe Piezoelectric Materials Market Share (%) by Material Sub-Type – Piezoceramics, Piezocomposites, Piezocrystals and Piezopolymers
Chart 214: Rest of Europe Phase Change Materials Market Analysis (2014-2023) by Material Sub-Type – Bio-Based, Inorganic and Organic in USD Million
Chart 215: Glance at 2014, 2018 and 2023 Rest of Europe Phase Change Materials Market Share (%) by Material Sub-Type – Bio-Based, Inorganic and Organic
Chart 216: Rest of Europe Shape Memory Alloys Market Analysis (2014-2023) by Material Sub-Type – Copper-Based, Iron-Based and Nickel-Titanium in USD Million
Chart 217: Glance at 2014, 2018 and 2023 Rest of Europe Shape Memory Alloys Market Share (%) by Material Sub-Type – Copper-Based, Iron-Based and Nickel-Titanium
ASIA-PACIFIC
Chart 218: Asia-Pacific Smart Materials Market Analysis (2014-2023) in USD Million
Chart 219: Asia-Pacific Smart Materials Market Analysis (2014-2023) by Region – China, India, Japan, South Korea and Rest of Asia-Pacific in USD Million
Chart 220: Glance at 2014, 2018 and 2023 Asia-Pacific Smart Materials Market Share (%) by Region – China, India, Japan, South Korea and Rest of Asia-Pacific
Chart 221: Asia-Pacific Smart Materials Market Analysis (2014-2023) by Material Type – Electrostrictive Materials, Magnetostrictive Materials, Piezoelectric Materials, Phase Change Materials, Shape Memory Alloys and Other Smart Materials in USD Million
Chart 222: Glance at 2014, 2018 and 2023 Asia-Pacific Smart Materials Market Share (%) by Material Type – Electrostrictive Materials, Magnetostrictive Materials, Piezoelectric Materials, Phase Change Materials, Shape Memory Alloys and Other Smart Materials
Chart 223: Asia-Pacific Electrostrictive Materials Market Analysis (2014-2023) by Material Sub-Type – Lead Magnesium Niobate-Lead Titanate (PMN-PT) and Polymers in USD Million
Chart 224: Glance at 2014, 2018 and 2023 Asia-Pacific Electrostrictive Materials Market Share (%) by Material Sub-Type – Lead Magnesium Niobate-Lead Titanate (PMN-PT) and Polymers
Chart 225: Asia-Pacific Magnetostrictive Materials Market Analysis (2014-2023) by Material Sub-Type – Ferrites and Rare Earth Materials in USD Million
Chart 226: Glance at 2014, 2018 and 2023 Asia-Pacific Magnetostrictive Materials Market Share (%) by Material Sub-Type – Ferrites and Rare Earth Materials
Chart 227: Asia-Pacific Piezoelectric Materials Market Analysis (2014-2023) by Material Sub-Type – Piezoceramics, Piezocomposites, Piezocrystals and Piezopolymers in USD Million
Chart 228: Glance at 2014, 2018 and 2023 Asia-Pacific Piezoelectric Materials Market Share (%) by Material Sub-Type – Piezoceramics, Piezocomposites, Piezocrystals and Piezopolymers
Chart 229: Asia-Pacific Phase Change Materials Market Analysis (2014-2023) by Material Sub-Type – Bio-Based, Inorganic and Organic in USD Million
Chart 230: Glance at 2014, 2018 and 2023 Asia-Pacific Phase Change Materials Market Share (%) by Material Sub-Type – Bio-Based, Inorganic and Organic
Chart 231: Asia-Pacific Shape Memory Alloys Market Analysis (2014-2023) by Material Sub-Type – Copper-Based, Iron-Based and Nickel-Titanium in USD Million
Chart 232: Glance at 2014, 2018 and 2023 Asia-Pacific Shape Memory Alloys Market Share (%) by Material Sub-Type – Copper-Based, Iron-Based and Nickel-Titanium
China
Chart 233: Chinese Smart Materials Market Analysis (2014-2023) in USD Million
Chart 234: Chinese Smart Materials Market Analysis (2014-2023) by Material Type – Electrostrictive Materials, Magnetostrictive Materials, Piezoelectric Materials, Phase Change Materials, Shape Memory Alloys and Other Smart Materials in USD Million
Chart 235: Glance at 2014, 2018 and 2023 Chinese Smart Materials Market Share (%) by Material Type – Electrostrictive Materials, Magnetostrictive Materials, Piezoelectric Materials, Phase Change Materials, Shape Memory Alloys and Other Smart Materials
Chart 236: Chinese Electrostrictive Materials Market Analysis (2014-2023) by Material Sub-Type – Lead Magnesium Niobate-Lead Titanate (PMN-PT) and Polymers in USD Million
Chart 237: Glance at 2014, 2018 and 2023 Chinese Electrostrictive Materials Market Share (%) by Material Sub-Type – Lead Magnesium Niobate-Lead Titanate (PMN-PT) and Polymers
Chart 238: Chinese Magnetostrictive Materials Market Analysis (2014-2023) by Material Sub-Type – Ferrites and Rare Earth Materials in USD Million
Chart 239: Glance at 2014, 2018 and 2023 Chinese Magnetostrictive Materials Market Share (%) by Material Sub-Type – Ferrites and Rare Earth Materials
Chart 240: Chinese Piezoelectric Materials Market Analysis (2014-2023) by Material Sub-Type – Piezoceramics, Piezocomposites, Piezocrystals and Piezopolymers in USD Million
Chart 241: Glance at 2014, 2018 and 2023 Chinese Piezoelectric Materials Market Share (%) by Material Sub-Type – Piezoceramics, Piezocomposites, Piezocrystals and Piezopolymers
Chart 242: Chinese Phase Change Materials Market Analysis (2014-2023) by Material Sub-Type – Bio-Based, Inorganic and Organic in USD Million
Chart 243: Glance at 2014, 2018 and 2023 Chinese Phase Change Materials Market Share (%) by Material Sub-Type – Bio-Based, Inorganic and Organic
Chart 244: Chinese Shape Memory Alloys Market Analysis (2014-2023) by Material Sub-Type – Copper-Based, Iron-Based and Nickel-Titanium in USD Million
Chart 245: Glance at 2014, 2018 and 2023 Chinese Shape Memory Alloys Market Share (%) by Material Sub-Type – Copper-Based, Iron-Based and Nickel-Titanium
India
Chart 246: Indian Smart Materials Market Analysis (2014-2023) in USD Million
Chart 247: Indian Smart Materials Market Analysis (2014-2023) by Material Type – Electrostrictive Materials, Magnetostrictive Materials, Piezoelectric Materials, Phase Change Materials, Shape Memory Alloys and Other Smart Materials in USD Million
Chart 248: Glance at 2014, 2018 and 2023 Indian Smart Materials Market Share (%) by Material Type – Electrostrictive Materials, Magnetostrictive Materials, Piezoelectric Materials, Phase Change Materials, Shape Memory Alloys and Other Smart Materials
Chart 249: Indian Electrostrictive Materials Market Analysis (2014-2023) by Material Sub-Type – Lead Magnesium Niobate-Lead Titanate (PMN-PT) and Polymers in USD Million
Chart 250: Glance at 2014, 2018 and 2023 Indian Electrostrictive Materials Market Share (%) by Material Sub-Type – Lead Magnesium Niobate-Lead Titanate (PMN-PT) and Polymers
Chart 251: Indian Magnetostrictive Materials Market Analysis (2014-2023) by Material Sub-Type – Ferrites and Rare Earth Materials in USD Million
Chart 252: Glance at 2014, 2018 and 2023 Indian Magnetostrictive Materials Market Share (%) by Material Sub-Type – Ferrites and Rare Earth Materials
Chart 253: Indian Piezoelectric Materials Market Analysis (2014-2023) by Material Sub-Type – Piezoceramics, Piezocomposites, Piezocrystals and Piezopolymers in USD Million
Chart 254: Glance at 2014, 2018 and 2023 Indian Piezoelectric Materials Market Share (%) by Material Sub-Type – Piezoceramics, Piezocomposites, Piezocrystals and Piezopolymers
Chart 255: Indian Phase Change Materials Market Analysis (2014-2023) by Material Sub-Type – Bio-Based, Inorganic and Organic in USD Million
Chart 256: Glance at 2014, 2018 and 2023 Indian Phase Change Materials Market Share (%) by Material Sub-Type – Bio-Based, Inorganic and Organic
Chart 257: Indian Shape Memory Alloys Market Analysis (2014-2023) by Material Sub-Type – Copper-Based, Iron-Based and Nickel-Titanium in USD Million
Chart 258: Glance at 2014, 2018 and 2023 Indian Shape Memory Alloys Market Share (%) by Material Sub-Type – Copper-Based, Iron-Based and Nickel-Titanium
Japan
Chart 259: Japanese Smart Materials Market Analysis (2014-2023) in USD Million
Chart 260: Japanese Smart Materials Market Analysis (2014-2023) by Material Type – Electrostrictive Materials, Magnetostrictive Materials, Piezoelectric Materials, Phase Change Materials, Shape Memory Alloys and Other Smart Materials in USD Million
Chart 261: Glance at 2014, 2018 and 2023 Japanese Smart Materials Market Share (%) by Material Type – Electrostrictive Materials, Magnetostrictive Materials, Piezoelectric Materials, Phase Change Materials, Shape Memory Alloys and Other Smart Materials
Chart 262: Japanese Electrostrictive Materials Market Analysis (2014-2023) by Material Sub-Type – Lead Magnesium Niobate-Lead Titanate (PMN-PT) and Polymers in USD Million
Chart 263: Glance at 2014, 2018 and 2023 Japanese Electrostrictive Materials Market Share (%) by Material Sub-Type – Lead Magnesium Niobate-Lead Titanate (PMN-PT) and Polymers
Chart 264: Japanese Magnetostrictive Materials Market Analysis (2014-2023) by Material Sub-Type – Ferrites and Rare Earth Materials in USD Million
Chart 265: Glance at 2014, 2018 and 2023 Japanese Magnetostrictive Materials Market Share (%) by Material Sub-Type – Ferrites and Rare Earth Materials
Chart 266: Japanese Piezoelectric Materials Market Analysis (2014-2023) by Material Sub-Type – Piezoceramics, Piezocomposites, Piezocrystals and Piezopolymers in USD Million
Chart 267: Glance at 2014, 2018 and 2023 Japanese Piezoelectric Materials Market Share (%) by Material Sub-Type – Piezoceramics, Piezocomposites, Piezocrystals and Piezopolymers
Chart 268: Japanese Phase Change Materials Market Analysis (2014-2023) by Material Sub-Type – Bio-Based, Inorganic and Organic in USD Million
Chart 269: Glance at 2014, 2018 and 2023 Japanese Phase Change Materials Market Share (%) by Material Sub-Type – Bio-Based, Inorganic and Organic
Chart 270: Japanese Shape Memory Alloys Market Analysis (2014-2023) by Material Sub-Type – Copper-Based, Iron-Based and Nickel-Titanium in USD Million
Chart 271: Glance at 2014, 2018 and 2023 Japanese Shape Memory Alloys Market Share (%) by Material Sub-Type – Copper-Based, Iron-Based and Nickel-Titanium
South Korea
Chart 272: South Korean Smart Materials Market Analysis (2014-2023) in USD Million
Chart 273: South Korean Smart Materials Market Analysis (2014-2023) by Material Type – Electrostrictive Materials, Magnetostrictive Materials, Piezoelectric Materials, Phase Change Materials, Shape Memory Alloys and Other Smart Materials in USD Million
Chart 274: Glance at 2014, 2018 and 2023 South Korean Smart Materials Market Share (%) by Material Type – Electrostrictive Materials, Magnetostrictive Materials, Piezoelectric Materials, Phase Change Materials, Shape Memory Alloys and Other Smart Materials
Chart 275: South Korean Electrostrictive Materials Market Analysis (2014-2023) by Material Sub-Type – Lead Magnesium Niobate-Lead Titanate (PMN-PT) and Polymers in USD Million
Chart 276: Glance at 2014, 2018 and 2023 South Korean Electrostrictive Materials Market Share (%) by Material Sub-Type – Lead Magnesium Niobate-Lead Titanate (PMN-PT) and Polymers
Chart 277: South Korean Magnetostrictive Materials Market Analysis (2014-2023) by Material Sub-Type – Ferrites and Rare Earth Materials in USD Million
Chart 278: Glance at 2014, 2018 and 2023 South Korean Magnetostrictive Materials Market Share (%) by Material Sub-Type – Ferrites and Rare Earth Materials
Chart 279: South Korean Piezoelectric Materials Market Analysis (2014-2023) by Material Sub-Type – Piezoceramics, Piezocomposites, Piezocrystals and Piezopolymers in USD Million
Chart 280: Glance at 2014, 2018 and 2023 South Korean Piezoelectric Materials Market Share (%) by Material Sub-Type – Piezoceramics, Piezocomposites, Piezocrystals and Piezopolymers
Chart 281: South Korean Phase Change Materials Market Analysis (2014-2023) by Material Sub-Type – Bio-Based, Inorganic and Organic in USD Million
Chart 282: Glance at 2014, 2018 and 2023 South Korean Phase Change Materials Market Share (%) by Material Sub-Type – Bio-Based, Inorganic and Organic
Chart 283: South Korean Shape Memory Alloys Market Analysis (2014-2023) by Material Sub-Type – Copper-Based, Iron-Based and Nickel-Titanium in USD Million
Chart 284: Glance at 2014, 2018 and 2023 South Korean Shape Memory Alloys Market Share (%) by Material Sub-Type – Copper-Based, Iron-Based and Nickel-Titanium
Rest of Asia-Pacific
Chart 285: Rest of Asia-Pacific Smart Materials Market Analysis (2014-2023) in USD Million
Chart 286: Rest of Asia-Pacific Smart Materials Market Analysis (2014-2023) by Material Type – Electrostrictive Materials, Magnetostrictive Materials, Piezoelectric Materials, Phase Change Materials, Shape Memory Alloys and Other Smart Materials in USD Million
Chart 287: Glance at 2014, 2018 and 2023 Rest of Asia-Pacific Smart Materials Market Share (%) by Material Type – Electrostrictive Materials, Magnetostrictive Materials, Piezoelectric Materials, Phase Change Materials, Shape Memory Alloys and Other Smart Materials
Chart 288: Rest of Asia-Pacific Electrostrictive Materials Market Analysis (2014-2023) by Material Sub-Type – Lead Magnesium Niobate-Lead Titanate (PMN-PT) and Polymers in USD Million
Chart 289: Glance at 2014, 2018 and 2023 Rest of Asia-Pacific Electrostrictive Materials Market Share (%) by Material Sub-Type – Lead Magnesium Niobate-Lead Titanate (PMN-PT) and Polymers
Chart 290: Rest of Asia-Pacific Magnetostrictive Materials Market Analysis (2014-2023) by Material Sub-Type – Ferrites and Rare Earth Materials in USD Million
Chart 291: Glance at 2014, 2018 and 2023 Rest of Asia-Pacific Magnetostrictive Materials Market Share (%) by Material Sub-Type – Ferrites and Rare Earth Materials
Chart 292: Rest of Asia-Pacific Piezoelectric Materials Market Analysis (2014-2023) by Material Sub-Type – Piezoceramics, Piezocomposites, Piezocrystals and Piezopolymers in USD Million
Chart 293: Glance at 2014, 2018 and 2023 Rest of Asia-Pacific Piezoelectric Materials Market Share (%) by Material Sub-Type – Piezoceramics, Piezocomposites, Piezocrystals and Piezopolymers
Chart 294: Rest of Asia-Pacific Phase Change Materials Market Analysis (2014-2023) by Material Sub-Type – Bio-Based, Inorganic and Organic in USD Million
Chart 295: Glance at 2014, 2018 and 2023 Rest of Asia-Pacific Phase Change Materials Market Share (%) by Material Sub-Type – Bio-Based, Inorganic and Organic
Chart 296: Rest of Asia-Pacific Shape Memory Alloys Market Analysis (2014-2023) by Material Sub-Type – Copper-Based, Iron-Based and Nickel-Titanium in USD Million
Chart 297: Glance at 2014, 2018 and 2023 Rest of Asia-Pacific Shape Memory Alloys Market Share (%) by Material Sub-Type – Copper-Based, Iron-Based and Nickel-Titanium
SOUTH AMERICA
Chart 298: South American Smart Materials Market Analysis (2014-2023) in USD Million
Chart 299: South American Smart Materials Market Analysis (2014-2023) by Region – Argentina, Brazil and Rest of South America in USD Million
Chart 300: Glance at 2014, 2018 and 2023 South American Smart Materials Market Share (%) by Region – Argentina, Brazil and Rest of South America
Chart 301: South American Smart Materials Market Analysis (2014-2023) by Material Type – Electrostrictive Materials, Magnetostrictive Materials, Piezoelectric Materials, Phase Change Materials, Shape Memory Alloys and Other Smart Materials in USD Million
Chart 302: Glance at 2014, 2018 and 2023 South American Smart Materials Market Share (%) by Material Type – Electrostrictive Materials, Magnetostrictive Materials, Piezoelectric Materials, Phase Change Materials, Shape Memory Alloys and Other Smart Materials
Chart 303: South American Electrostrictive Materials Market Analysis (2014-2023) by Material Sub-Type – Lead Magnesium Niobate-Lead Titanate (PMN-PT) and Polymers in USD Million
Chart 304: Glance at 2014, 2018 and 2023 South American Electrostrictive Materials Market Share (%) by Material Sub-Type – Lead Magnesium Niobate-Lead Titanate (PMN-PT) and Polymers
Chart 305: South American Magnetostrictive Materials Market Analysis (2014-2023) by Material Sub-Type – Ferrites and Rare Earth Materials in USD Million
Chart 306: Glance at 2014, 2018 and 2023 South American Magnetostrictive Materials Market Share (%) by Material Sub-Type – Ferrites and Rare Earth Materials
Chart 307: South American Piezoelectric Materials Market Analysis (2014-2023) by Material Sub-Type – Piezoceramics, Piezocomposites, Piezocrystals and Piezopolymers in USD Million
Chart 308: Glance at 2014, 2018 and 2023 South American Piezoelectric Materials Market Share (%) by Material Sub-Type – Piezoceramics, Piezocomposites, Piezocrystals and Piezopolymers
Chart 309: South American Phase Change Materials Market Analysis (2014-2023) by Material Sub-Type – Bio-Based, Inorganic and Organic in USD Million
Chart 310: Glance at 2014, 2018 and 2023 South American Phase Change Materials Market Share (%) by Material Sub-Type – Bio-Based, Inorganic and Organic
Chart 311: South American Shape Memory Alloys Market Analysis (2014-2023) by Material Sub-Type – Copper-Based, Iron-Based and Nickel-Titanium in USD Million
Chart 312: Glance at 2014, 2018 and 2023 South American Shape Memory Alloys Market Share (%) by Material Sub-Type – Copper-Based, Iron-Based and Nickel-Titanium
Argentina
Chart 313: Argentine Smart Materials Market Analysis (2014-2023) in USD Million
Chart 314: Argentine Smart Materials Market Analysis (2014-2023) by Material Type – Electrostrictive Materials, Magnetostrictive Materials, Piezoelectric Materials, Phase Change Materials, Shape Memory Alloys and Other Smart Materials in USD Million
Chart 315: Glance at 2014, 2018 and 2023 Argentine Smart Materials Market Share (%) by Material Type – Electrostrictive Materials, Magnetostrictive Materials, Piezoelectric Materials, Phase Change Materials, Shape Memory Alloys and Other Smart Materials
Chart 316: Argentine Electrostrictive Materials Market Analysis (2014-2023) by Material Sub-Type – Lead Magnesium Niobate-Lead Titanate (PMN-PT) and Polymers in USD Million
Chart 317: Glance at 2014, 2018 and 2023 Argentine Electrostrictive Materials Market Share (%) by Material Sub-Type – Lead Magnesium Niobate-Lead Titanate (PMN-PT) and Polymers
Chart 318: Argentine Magnetostrictive Materials Market Analysis (2014-2023) by Material Sub-Type – Ferrites and Rare Earth Materials in USD Million
Chart 319: Glance at 2014, 2018 and 2023 Argentine Magnetostrictive Materials Market Share (%) by Material Sub-Type – Ferrites and Rare Earth Materials
Chart 320: Argentine Piezoelectric Materials Market Analysis (2014-2023) by Material Sub-Type – Piezoceramics, Piezocomposites, Piezocrystals and Piezopolymers in USD Million
Chart 321: Glance at 2014, 2018 and 2023 Argentine Piezoelectric Materials Market Share (%) by Material Sub-Type – Piezoceramics, Piezocomposites, Piezocrystals and Piezopolymers
Chart 322: Argentine Phase Change Materials Market Analysis (2014-2023) by Material Sub-Type – Bio-Based, Inorganic and Organic in USD Million
Chart 323: Glance at 2014, 2018 and 2023 Argentine Phase Change Materials Market Share (%) by Material Sub-Type – Bio-Based, Inorganic and Organic
Chart 324: Argentine Shape Memory Alloys Market Analysis (2014-2023) by Material Sub-Type – Copper-Based, Iron-Based and Nickel-Titanium in USD Million
Chart 325: Glance at 2014, 2018 and 2023 Argentine Shape Memory Alloys Market Share (%) by Material Sub-Type – Copper-Based, Iron-Based and Nickel-Titanium
Brazil
Chart 326: Brazilian Smart Materials Market Analysis (2014-2023) in USD Million
Chart 327: Brazilian Smart Materials Market Analysis (2014-2023) by Material Type – Electrostrictive Materials, Magnetostrictive Materials, Piezoelectric Materials, Phase Change Materials, Shape Memory Alloys and Other Smart Materials in USD Million
Chart 328: Glance at 2014, 2018 and 2023 Brazilian Smart Materials Market Share (%) by Material Type – Electrostrictive Materials, Magnetostrictive Materials, Piezoelectric Materials, Phase Change Materials, Shape Memory Alloys and Other Smart Materials
Chart 329: Brazilian Electrostrictive Materials Market Analysis (2014-2023) by Material Sub-Type – Lead Magnesium Niobate-Lead Titanate (PMN-PT) and Polymers in USD Million
Chart 330: Glance at 2014, 2018 and 2023 Brazilian Electrostrictive Materials Market Share (%) by Material Sub-Type – Lead Magnesium Niobate-Lead Titanate (PMN-PT) and Polymers
Chart 331: Brazilian Magnetostrictive Materials Market Analysis (2014-2023) by Material Sub-Type – Ferrites and Rare Earth Materials in USD Million
Chart 332: Glance at 2014, 2018 and 2023 Brazilian Magnetostrictive Materials Market Share (%) by Material Sub-Type – Ferrites and Rare Earth Materials
Chart 333: Brazilian Piezoelectric Materials Market Analysis (2014-2023) by Material Sub-Type – Piezoceramics, Piezocomposites, Piezocrystals and Piezopolymers in USD Million
Chart 334: Glance at 2014, 2018 and 2023 Brazilian Piezoelectric Materials Market Share (%) by Material Sub-Type – Piezoceramics, Piezocomposites, Piezocrystals and Piezopolymers
Chart 335: Brazilian Phase Change Materials Market Analysis (2014-2023) by Material Sub-Type – Bio-Based, Inorganic and Organic in USD Million
Chart 336: Glance at 2014, 2018 and 2023 Brazilian Phase Change Materials Market Share (%) by Material Sub-Type – Bio-Based, Inorganic and Organic
Chart 337: Brazilian Shape Memory Alloys Market Analysis (2014-2023) by Material Sub-Type – Copper-Based, Iron-Based and Nickel-Titanium in USD Million
Chart 338: Glance at 2014, 2018 and 2023 Brazilian Shape Memory Alloys Market Share (%) by Material Sub-Type – Copper-Based, Iron-Based and Nickel-Titanium
Rest of South America
Chart 339: Rest of South American Smart Materials Market Analysis (2014-2023) in USD Million
Chart 340: Rest of South American Smart Materials Market Analysis (2014-2023) by Material Type – Electrostrictive Materials, Magnetostrictive Materials, Piezoelectric Materials, Phase Change Materials, Shape Memory Alloys and Other Smart Materials in USD Million
Chart 341: Glance at 2014, 2018 and 2023 Rest of South American Smart Materials Market Share (%) by Material Type – Electrostrictive Materials, Magnetostrictive Materials, Piezoelectric Materials, Phase Change Materials, Shape Memory Alloys and Other Smart Materials
Chart 342: Rest of South American Electrostrictive Materials Market Analysis (2014-2023) by Material Sub-Type – Lead Magnesium Niobate-Lead Titanate (PMN-PT) and Polymers in USD Million
Chart 343: Glance at 2014, 2018 and 2023 Rest of South American Electrostrictive Materials Market Share (%) by Material Sub-Type – Lead Magnesium Niobate-Lead Titanate (PMN-PT) and Polymers
Chart 344: Rest of South American Magnetostrictive Materials Market Analysis (2014-2023) by Material Sub-Type – Ferrites and Rare Earth Materials in USD Million
Chart 345: Glance at 2014, 2018 and 2023 Rest of South American Magnetostrictive Materials Market Share (%) by Material Sub-Type – Ferrites and Rare Earth Materials
Chart 346: Rest of South American Piezoelectric Materials Market Analysis (2014-2023) by Material Sub-Type – Piezoceramics, Piezocomposites, Piezocrystals and Piezopolymers in USD Million
Chart 347: Glance at 2014, 2018 and 2023 Rest of South American Piezoelectric Materials Market Share (%) by Material Sub-Type – Piezoceramics, Piezocomposites, Piezocrystals and Piezopolymers
Chart 348: Rest of South American Phase Change Materials Market Analysis (2014-2023) by Material Sub-Type – Bio-Based, Inorganic and Organic in USD Million
Chart 349: Glance at 2014, 2018 and 2023 Rest of South American Phase Change Materials Market Share (%) by Material Sub-Type – Bio-Based, Inorganic and Organic
Chart 350: Rest of South American Shape Memory Alloys Market Analysis (2014-2023) by Material Sub-Type – Copper-Based, Iron-Based and Nickel-Titanium in USD Million
Chart 351: Glance at 2014, 2018 and 2023 Rest of South American Shape Memory Alloys Market Share (%) by Material Sub-Type – Copper-Based, Iron-Based and Nickel-Titanium
REST OF WORLD
Chart 352: Rest of World Smart Materials Market Analysis (2014-2023) in USD Million
Chart 353: Rest of World Smart Materials Market Analysis (2014-2023) by Material Type – Electrostrictive Materials, Magnetostrictive Materials, Piezoelectric Materials, Phase Change Materials, Shape Memory Alloys and Other Smart Materials in USD Million
Chart 354: Glance at 2014, 2018 and 2023 Rest of World Smart Materials Market Share (%) by Material Type – Electrostrictive Materials, Magnetostrictive Materials, Piezoelectric Materials, Phase Change Materials, Shape Memory Alloys and Other Smart Materials
Chart 355: Rest of World Electrostrictive Materials Market Analysis (2014-2023) by Material Sub-Type – Lead Magnesium Niobate-Lead Titanate (PMN-PT) and Polymers in USD Million
Chart 356: Glance at 2014, 2018 and 2023 Rest of World Electrostrictive Materials Market Share (%) by Material Sub-Type – Lead Magnesium Niobate-Lead Titanate (PMN-PT) and Polymers
Chart 357: Rest of World Magnetostrictive Materials Market Analysis (2014-2023) by Material Sub-Type – Ferrites and Rare Earth Materials in USD Million
Chart 358: Glance at 2014, 2018 and 2023 Rest of World Magnetostrictive Materials Market Share (%) by Material Sub-Type – Ferrites and Rare Earth Materials
Chart 359: Rest of World Piezoelectric Materials Market Analysis (2014-2023) by Material Sub-Type – Piezoceramics, Piezocomposites, Piezocrystals and Piezopolymers in USD Million
Chart 360: Glance at 2014, 2018 and 2023 Rest of World Piezoelectric Materials Market Share (%) by Material Sub-Type – Piezoceramics, Piezocomposites, Piezocrystals and Piezopolymers
Chart 361: Rest of World Phase Change Materials Market Analysis (2014-2023) by Material Sub-Type – Bio-Based, Inorganic and Organic in USD Million
Chart 362: Glance at 2014, 2018 and 2023 Rest of World Phase Change Materials Market Share (%) by Material Sub-Type – Bio-Based, Inorganic and Organic
Chart 363: Rest of World Shape Memory Alloys Market Analysis (2014-2023) by Material Sub-Type – Copper-Based, Iron-Based and Nickel-Titanium in USD Million
Chart 364: Glance at 2014, 2018 and 2023 Rest of World Shape Memory Alloys Market Share (%) by Material Sub-Type – Copper-Based, Iron-Based and Nickel-Titanium
Tables & Figures
Tables:
Table 1: Properties of Select Magnetostrictive Materials
Table 2: Comparison of Properties between PVDF and PZT
Table 3: Comparison between Properties of Some Semicrystalline Polymeric Materials
Table 4: Comparison between Properties of Some Amorphous Polymeric Materials
Table 5: Values of the Dipole Moments within the Nitrile-Substituted Polyimide
Table 6: Thermophysical Properties of Selected Salt Hydrates
Table 7: Melting Temperatures and Heat of Fusion of a Few Eutectic Mixtures
Table 8: Alloys Exhibiting the Shape Memory Effect
Table 9: Properties of Copper-Based SMAs
Table 10: Characteristic Fe�Mn�Si Based SMAs Developed in the First Stage
Table 11: Characteristic Fe�Mn�Si Based SMAs Developed in the Second Stage
Table 12: Basic Properties of Fe�28Mn�6Si�5Cr SMA
Table 13: Properties of Ni-Ti SMAs
Figures:
Figure 1: Schematic of Strain vs. Magnetic Field
Figure 2: Perovskite Structure ABO3
Figure 3: Electrorheological Effect
APC International Ltd.
Arkema SA
Cedrat Technologies SA
Ceramtec GmbH
Channel Technologies Group, LLC
Climator Sweden AB
Croda International PLC
Dynalloy, Inc.
Fort Wayne Metals, Inc.
G.RAU GmbH & Co., KG.
Harris Corporation
Honeywell Electronic Materials, Inc.
Johnson Matthey Piezo Products GmbH
Kyocera Corporation
Metglas, Inc.
Mid� Technology Corporation
Morgan Advanced Materials Plc
Noliac A/S
Peier Tech
Phase Change Energy Solutions, Inc.
Physik Instrumente (PI) GmbH & Co., KG.
Piezo Kinetics, Inc.
Qortek, Inc.
Rubitherm Technologies GmbH
SAES Getters SpA
Smart Material Corporation
Solvay SA
Ultimate Niti Technologies, Inc.
RELATED REPORTS
Polyamides (PA6, PA66) - A Global Market Overview
Report Code: CHM112 | Pages: 274 | Price: $4500
Published
Jul 2026
Polymethyl Methacrylate (PMMA) - A Global Market Overview
Report Code: CHM113 | Pages: 247 | Price: $4500
Published
Jul 2026
Polyoxymethylene (POM or Polyacetal) - A Global Market Overview
Report Code: CHM114 | Pages: 245 | Price: $4500
Published
Jul 2026
Polybutylene Terephthalate (PBT) - A Global Market Overview
Report Code: CHM115 | Pages: 224 | Price: $4500
Published
Jul 2026
Modified Polyphenylene Ether (mPPE) - A Global Market Overview
Report Code: CHM116 | Pages: 195 | Price: $4050
Published
Jul 2026