Global Polyphenylene Sulfide (PPS) Market Trends and Outlook
Polyphenylene Sulfide (PPS) is a high-performance engineering thermoplastic known for its exceptional resistance to heat, chemicals, and corrosion, along with excellent dimensional stability and inherent flame retardancy. These characteristics make PPS suitable for demanding applications where conventional polymers cannot meet performance requirements. PPS is typically available in the form of compounds, fibers, and other specialty forms such as films, sheets, and coatings, enabling its use across a wide range of industries including automotive, electrical and electronics, industrial filtration, aerospace, and medical equipment. Its ability to maintain mechanical and electrical performance at elevated temperatures has positioned PPS as a key material within the broader category of super engineering plastics.
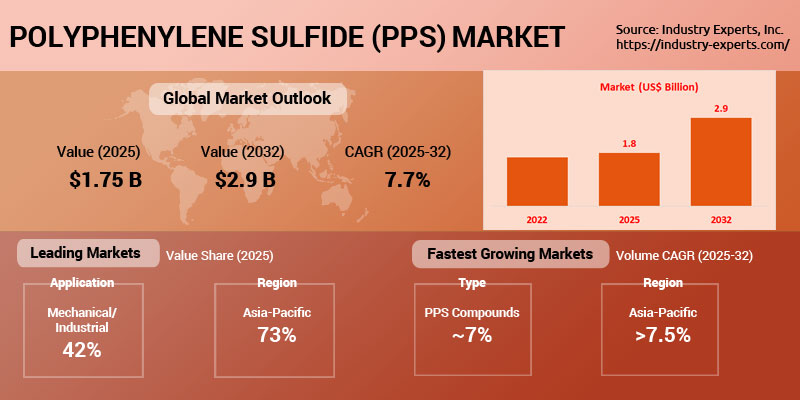
The global Polyphenylene Sulfide (PPS) market is projected to experience steady growth over the forecast period, expanding from US$1.75 billion in 2025 to 280 thousand metric tons and US$2.9 billion by 2032, representing compound annual growth rates of 6.8% in volume and 7.7% in value. The stronger growth in market value relative to volume reflects increasing adoption of high-performance PPS grades and value-added applications across advanced manufacturing sectors. PPS compounds dominate the market due to their extensive use in structural and electrical components, while PPS fiber continues to gain traction in specialized high-temperature filtration systems.
Demand for PPS is supported by the increasing need for materials capable of operating in harsh thermal and chemical environments, particularly in sectors undergoing technological transformation such as electrified transportation, advanced electronics, and industrial processing. At the same time, stricter environmental regulations are driving the adoption of high-performance filtration materials in power generation and industrial facilities. As industries continue to seek lightweight, durable, and heat-resistant materials, PPS is expected to play an increasingly important role in enabling next-generation engineering solutions and supporting the evolution of high-performance polymer applications worldwide.
Iran War Impact: "Polyphenylene Sulfide (PPS) is produced using benzene derivatives and sulfur-based intermediates derived from petrochemical feedstocks, making its supply chain closely tied to energy prices and aromatic chemical production. The recent escalation of geopolitical tensions involving Iran has raised concerns about potential disruptions to petrochemical supply chains and global shipping routes, which could indirectly influence the production economics of PPS. As a high-performance engineering polymer widely used in automotive electronics, electrical components, and industrial applications, PPS remains sensitive to volatility in aromatic feedstock prices and regional trade logistics. At this early stage, the long-term implications for the 2026 market remain uncertain. Our research team is closely monitoring developments in crude oil markets, petrochemical trade flows, and producer activity to evaluate any potential impact on the PPS value chain and pricing dynamics."
Polyphenylene Sulfide (PPS) Regional Market Analysis
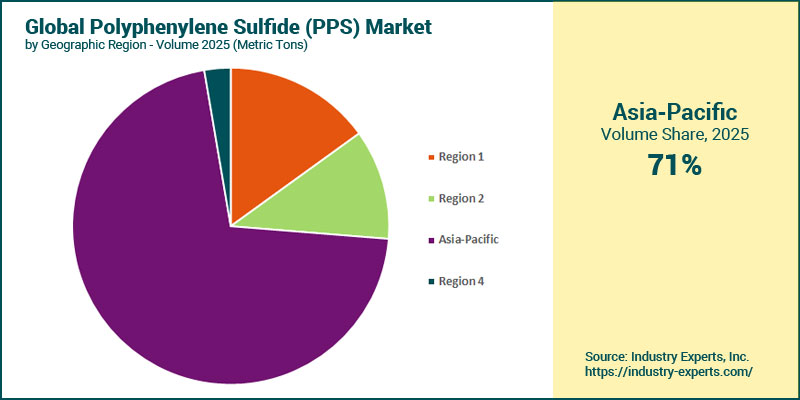
Asia-Pacific dominates the global Polyphenylene Sulfide (PPS) market in volume terms, accounting for 71.1% of total demand in 2025, and is also the fastest-growing region, projected to reach 210 thousand metric tons by 2032 at a CAGR of 7.6% between 2025 and 2032. This strong regional leadership is largely driven by expanding use of PPS fiber in high-temperature filter bags for coal-fired power plants, particularly in China and India where stringent emission control regulations and the continued reliance on coal-based thermal power generation are sustaining demand for advanced filtration materials. North America represents the second-largest regional market, accounting for 15% of global consumption in 2025, supported by steady demand for PPS compounds in automotive, aerospace, and medical components requiring high heat resistance and dimensional stability.
Polyphenylene Sulfide (PPS) Market Analysis by Product Type
PPS Compounds dominate the global Polyphenylene Sulfide (PPS) market in volume terms, accounting for 87.9% of total demand in 2025, and are projected to expand at the fastest growth at a CAGR of 7% between 2025 and 2032. This dominance reflects the widespread use of compounded PPS in automotive, aerospace, and medical components in Western markets, where the material's high heat resistance, dimensional stability, and chemical resistance make it ideal for lightweight structural and electrical parts. PPS Fiber represents the second-largest product category, accounting for 9.8% of global consumption in 2025, driven largely by demand for high-temperature filtration materials used in coal-fired power plant filter bags across Asia-Pacific, particularly in China and India where stringent particulate emission standards are accelerating adoption. Meanwhile, Other PPS forms including films, sheets, and coatings remain niche applications.
Polyphenylene Sulfide (PPS) Market Analysis by End-use Application
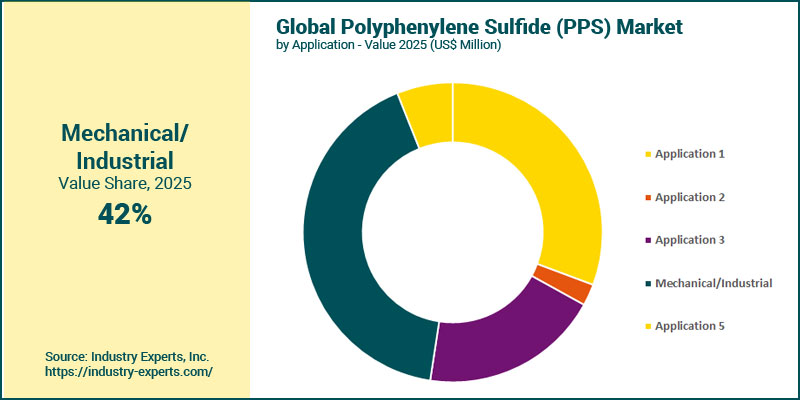
Mechanical/Industrial applications lead the global Polyphenylene Sulfide (PPS) market in value terms, accounting for 41.6% of the market in 2025, and are projected to expand to US$1.4 billion by 2032, registering the fastest growth at a CAGR of 10.1% between 2025 and 2032. This strong performance is primarily driven by increasing use of PPS fiber in high-temperature filter bags for coal-fired power plants, particularly across Asia-Pacific where stringent particulate emission regulations and the continued dominance of coal-based thermal power generation, especially in China and India, are driving demand for advanced filtration materials. In volume terms, however, Automotive represents the largest application, accounting for 36.7% of global consumption in 2025 supported by strong demand for PPS compounds in lightweight, heat-resistant components used in automotive applications across Western markets. Meanwhile, Electrical & Electronics maintains a stable position with 22.8% volume share in 2025, reflecting sustained demand for PPS in connectors, housings, and other high-performance electronic components.
Polyphenylene Sulfide (PPS) Market Report Scope
This global report on Polyphenylene Sulfide (PPS) analyzes the market based on product type and end-use application for the period 2022-2032 with projections from 2025 to 2032 in terms of volume in metric tons and value in US$. In addition to providing profiles of major companies operating in the sulfone polymers industry, the latest corporate, product and industrial developments have been covered to offer a clear panorama of polyphenylene sulfide industry.
Key Metrics
| Historical Period: | 2022-2025 | |
| Base Year: | 2025 | |
| Forecast Period: | 2025-2032 | |
| Units: | Volume consumption in Metric Tons and Value market in US$ | |
| Companies Mentioned: | 15+ |
Global Polyphenylene Sulfide (PPS) Market by Geographic Region
- North America (The United States and Rest of NA)
- Europe (France, Germany, Italy, The United Kingdom and Rest of Europe)
- Asia-Pacific (China, Japan, India, South Korea and Rest of Asia-Pacific)
- Rest of World
Global Polyphenylene Sulfide (PPS) Market by Product Type
- PPS Compounds
- PPS Fiber
- Other PPS (Films, Sheets, Coatings etc.)
Global Polyphenylene Sulfide (PPS) Market by End-use Application
- Automotive
- Consumer Goods
- Electrical & Electronics
- Mechanical/Industrial (mainly consisting of filter bags)
- Others (include aerospace, medical and protective garments)
Polyphenylene Sulfide (PPS) Market Frequently Asked Questions (FAQs)
Polyphenylene Sulfide (PPS) is a high-performance engineering thermoplastic known for its excellent heat resistance, chemical stability, flame retardancy, and dimensional stability, making it suitable for demanding industrial and automotive applications.
Key drivers include increasing demand for industrial filtration materials, growth in automotive electrification, expanding electronics applications, and stricter environmental regulations requiring high-temperature filtration systems.
Asia-Pacific dominates the global PPS market, accounting for over 70% of global demand, driven by strong industrial growth and widespread use of PPS filter bags in coal-fired power plants.
Major applications include automotive components, electrical connectors, industrial filtration systems, consumer appliances, aerospace components, and medical devices.
The PPS market includes PPS compounds, PPS fiber, and other PPS forms such as films, sheets, and coatings.
PPS fiber offers excellent resistance to high temperatures, chemicals, and oxidation, making it ideal for filter bags used in coal-fired power plants and other industrial filtration systems.
The PPS market is expected to grow steadily through 2032, supported by expanding industrial filtration demand, automotive electrification, and continued innovation in high-performance polymer technologies.
PART A: GLOBAL MARKET PERSPECTIVE
1. INTRODUCTION
- Product Outline
- What is Polyphenylene Sulfide (PPS)?
- Properties of Polyphenylene Sulfide (PPS)
- High Temperature Resistance
- Chemical Resistance
- Electrical Properties
- Flame Retardancy and Wear Resistance
- Machining Performance
- Polyphenylene Sulfide (PPS) Product Types
- PPS Compounds
- PPS Fibers and Filaments
- PPS Films
- PPS Coatings
- End-use Application Analysis
- Automotive Applications
- Electrical/Electronic Applications
- Industrial/Consumer Applications
- Other Applications
2. KEY MARKET TRENDS
3. INDUSTRY LANDSCAPE
- Commercial Production Technologies for PPS
- History of Polyphenylene Sulfide (PPS) Industry
- Global PPS Production Capacities
4. KEY GLOBAL PLAYERS
- PPS Resin Manufacturers
- Celanese Corporation (FORTRON)
- Chengdu Letian Plastics Co.,Ltd
- DIC Corporation
- Dunhuang Western Region Special New Material Co. Ltd
- Haohua Honghe Chemical Co Ltd.
- HDC Polyall Co., Ltd. (SK Chemicals + Hyundai Development Company (HDC))
- Ito Tech Co. Ltd.
- Kureha Copration
- Syensqo SA
- Toray Industries, Inc.
- Tosoh Co Ltd
- Zhangjiagang Xinsheng New Materials Co., Ltd
- Zhejiang NHU Special Materials Co., Ltd
- PPS Compounders and Processors
- Schulman, Inc.
- ALBIS Plastic GmbH
- Avient Corporation (formerly PolyOne)
- Ensinger GmbH
- Kotec Corporation
- Lati Industria Termoplastici SpA
- Lehmann & Voss & Co
- Lion Idemitsu Composites Co., Ltd.
- Mitsubishi Chemical Advanced Materials AG (MCAM)
- Polyplastics Co Ltd
- RTP Company
- SABIC Innovative Plastics
- Toyobo Co Ltd
5. KEY BUSINESS AND PRODUCT TRENDS
6. GLOBAL MARKET OVERVIEW
- Market Overview by Product Type
- Product Type Market Overview by Geographic Region
- PPS Compounds
- PPS Fiber
- Other PPS Products
- Market Overview by End-Use Application
- End-Use Application Market Overview by Geographic Region
- Automotive Applications
- Electrical & Electronic Applications
- Industrial Applications
- Other End-Use Applications
PART B: REGIONAL MARKET PERSPECTIVE
REGIONAL MARKET OVERVIEW
7. NORTH AMERICA
- North American Market Overview by Product Type
- North American Market Overview by Region
- North American Market Overview by End-use Application
- North American Market Overview by Country
- The United States
- Rest of North America
8. EUROPE
- European Market Overview by Product Type
- European Market Overview by Region
- European Market Overview by End-use Application
- European Market Overview by Country
- France
- Germany
- Italy
- The United Kingdom
- Rest of Europe
9. ASIA-PACIFIC
- Asia-Pacific Market Overview by Product Type
- Asia-Pacific Market Overview by Region
- Asia-Pacific Market Overview by End-use Application
- Asia-Pacific Market Overview by Country
- China
- Japan
- South Korea
- Rest of Asia-Pacific
10. REST OF WORLD
- Rest of World Market Overview by Product Type
- Rest of World Market Overview by End-use Application
PART C: GUIDE TO THE INDUSTRY
- NORTH AMERICA
- EUROPE
- ASIA-PACIFIC
PART D: ANNEXURE
- RESEARCH METHODOLOGY
- FEEDBACK
Celanese Corporation (FORTRON)
Chengdu Letian Plastics Co.,Ltd
DIC Corporation
Dunhuang Western Region Special New Material Co. Ltd
HDC Polyall Co., Ltd.
Ito Tech Co. Ltd.
Kureha Copration
Syensqo SA
Toray Industries, Inc.
Tosoh Co Ltd
Zhejiang NHU Special Materials Co., Ltd
RELATED REPORTS
Polyamides (PA6, PA66) - A Global Market Overview
Report Code: CHM112 | Pages: 274 | Price: $4500
Published
Jul 2026
Polymethyl Methacrylate (PMMA) - A Global Market Overview
Report Code: CHM113 | Pages: 247 | Price: $4500
Published
Jul 2026
Polyoxymethylene (POM or Polyacetal) - A Global Market Overview
Report Code: CHM114 | Pages: 245 | Price: $4500
Published
Jul 2026
Polybutylene Terephthalate (PBT) - A Global Market Overview
Report Code: CHM115 | Pages: 224 | Price: $4500
Published
Jul 2026
Modified Polyphenylene Ether (mPPE) - A Global Market Overview
Report Code: CHM116 | Pages: 195 | Price: $4050
Published
Jul 2026