Published Date: Apr 2019
Report Code: CP080
Pages: 576
Charts: 238
Report Synopsis
Globally, the market for hybrid/composite ion exchangers incorporating the beneficial features of both organic and inorganic exchangers has been gaining traction. These exchangers enable in forming new solid-state/lattice structures and materials with novel composite properties, leading to a host of innovative applications that will drive future growth. The primary goal of synthesizing hybrid exchangers has been to achieve properties that a single-phase material lacks.
Asia-Pacific forms the largest global market for Ion Exchangers, estimated at US$1.4 billion (35.1% share) in 2018, which is also poised to post the fastest 2018-2024 CAGR of 5.9%. By type, Organic exchangers account for the largest share in 2018 with US$1.8 billion. The overall ion exchangers worldwide market is expected to reach US$4.1 billion in 2019.
Research Findings & Coverage
- The global market for Ion Exchangers is explored in this study with respect to Ion Exchanger Type/Sub-Type and major application areas
- The study extensively analyzes above mentioned types and applications of Ion Exchangers in each major region/country globally for the analysis period
- Hybrid Ion Exchangers Gain Traction
- Combined Cation/Anion Exchange Systems Improve Water Purification in Small Potable Water Systems
- Ion Exchangers Improve Purification of Processed Foods
- Drug Delivery Systems Enhanced with Ion Exchangers
- Key business trends focusing on product innovations/developments, M&As, JVs and other recent industry developments
- Major companies profiled – 100
- The industry guide includes the contact details for 132 companies
Product Outline
The report analyzes the market for the key types/sub-types of Ion Exchangers including:
- Composite
- Inorganic
- Zeolites
- Others
- Organic
- Amphoteric
- Chelating
- Strong Base Anion
- Weak Base Anion
- Strong Acid Cation
- Weak Acid Cation
Application Areas of Ion Exchangers analyzed comprise the following:
- Chemical
- Dairy, Food & Beverages
- Hydrometallurgy
- Industrial & Municipal Water Treatment
- Nuclear Waste Remediation
- Pharmaceuticals & Medicine
- Others
Analysis Period, Units and Growth Rates
- The report reviews, analyzes and projects the global Ion Exchangers market for the period 2015-2024 in terms of market value in US$ and the compound annual growth rates (CAGRs) projected from 2018 through 2024
Geographic Coverage
- North America (The United States, Canada and Mexico)
- Europe (France, Germany, Italy, United Kingdom and Rest of Europe)
- Asia-Pacific (China, India, Japan and Rest of Asia-Pacific)
- South America (Argentina, Brazil and Rest of South America)
- Rest of World
PART A: GLOBAL MARKET PERSPECTIVE
1. INTRODUCTION
1.1 Product Outline
1.1.1 An Introduction to Ion Exchange
1.1.2 Classification of Ion Exchangers
1.1.2.1 Inorganic Ion Exchangers
1.1.2.1.1 Zeolites
1.1.2.1.1.1 Incomplete Ion Exchange Reactions
1.1.2.1.1.2 Materials Resembling Zeolites
1.1.2.1.1.2.1 Semicrystalline Zeolites
1.1.2.1.1.2.2 Materials with Non-Aluminosilicate Frameworks
1.1.2.1.1.3 Solid-State Ion Exchange in Zeolites
1.1.2.1.2 Other Inorganic Ion Exchangers
1.1.2.1.2.1 Clays and Other Layered Materials
1.1.2.1.2.1.1 Pillared Clays
1.1.2.1.2.2 Metal Phosphates
1.1.2.1.2.2.1 Swelling of Zirconium Phosphates
1.1.2.1.2.2.2 Catalytic Exchanges in a-ZrP
1.1.2.1.2.3 Heteropolyoxometalates
1.1.2.1.2.4 Hydrous Oxides
1.1.2.1.2.5 Polybasic Acid Salts
1.1.2.1.2.6 Metal Ferrocyanides
1.1.2.1.2.7 Insoluble Ion Exchangers
1.1.2.1.2.8 Heteropolyacids
1.1.2.1.2.9 Miscellaneous Materials
1.1.2.1.2.9.1 Hydroxyapatites
1.1.2.1.2.9.2 Copper Hexacyanoferrates
1.1.2.1.2.9.3 Lithium Manganate
1.1.2.1.2.9.4 Iodide Ions
1.1.2.2 Organic Ion Exchangers
1.1.2.2.1 General Aspects
1.1.2.2.2 Classification of Organic Ion Exchangers
1.1.2.2.3 Categorization of Organic Ion Exchangers
1.1.2.2.4 Types of Synthetic Organic Ion Exchangers
1.1.2.2.4.1 Strong Acid Cation Exchangers
1.1.2.2.4.2 Weak Acid Cation Exchangers
1.1.2.2.4.3 Strong Base Anion Exchangers
1.1.2.2.4.4 Weak Base Anion Exchangers
1.1.2.2.4.5 Amphoteric Ion Exchangers
1.1.2.2.4.6 Chelating Ion Exchangers
1.1.3 Applications of Ion Exchangers
1.1.3.1 Ion Exchangers in the Water Industry
1.1.3.1.1 Water Softening
1.1.3.1.2 Dealkalization
1.1.3.1.3 Demineralization
1.1.3.1.4 Ultrapure Water
1.1.3.1.5 Nitrate Removal
1.1.3.1.6 Radioactive Waste Treatment
1.1.3.2 Ion Exchangers in Chemical Processing
1.1.3.2.1 Catalysis
1.1.3.2.2 Purification
1.1.3.3 Ion Exchangers in Hydrometallurgy
1.1.3.4 Ion Exchangers in Dairy, Food and Beverages
1.1.3.4.1 Gel Type Strong Acid Cation Exchangers
1.1.3.4.2 Porous Type Strong Acid Cation Exchangers
1.1.3.4.3 Weak Acid Cation Exchangers
1.1.3.4.4 Weak Base Anion Exchangers
1.1.3.4.5 Gel Type Strong Base Anion Exchangers
1.1.3.4.6 Porous Type Strong Base Anion Exchangers
1.1.3.4.7 Demineralization of Whey
1.1.3.4.8 Beverages
1.1.3.4.9 Treatment of Fruit Juices
1.1.3.5 Ion Exchangers in Pharmaceuticals and Medicine
1.1.3.5.1 Taste Masking
1.1.3.5.2 Disintegrant/Superdisintegrant
1.1.3.5.3 Drug Stabilization
1.1.3.5.4 Powder Processing Aid
1.1.3.5.5 High Purity Water
1.1.3.6 Ion Exchangers in Nuclear Waste Remediation
1.1.3.6.1 Natural Inorganic Ion Exchangers
1.1.3.6.2 Natural Organic Ion Exchangers
1.1.3.6.3 Modified Natural Ion Exchangers
1.1.3.6.4 Synthetic Inorganic Ion Exchangers
1.1.3.6.4.1 Zeolites
1.1.3.6.4.2 Titanates and Silico-Titanates
1.1.3.6.4.3 Transition Metal Hexacyanoferrates
1.1.3.6.5 Synthetic Organic Ion Exchangers
1.1.3.6.5.1 Polystyrene Divinylbenzene
1.1.3.6.5.2 Phenolic
1.1.3.6.5.3 Acrylic
1.1.3.6.6 Composite Ion Exchangers
1.1.3.7 Ion Exchangers in Other Applications
1.1.3.7.1 Desiccation
1.1.3.7.2 Sugar Separation and Purification
1.1.3.7.3 Chromatographic Separation
2. KEY MARKET TRENDS
2.1 Hybrid Ion Exchangers Gain Traction
2.2 Combined Cation/Anion Exchange Systems Improve Water Purification in Small Potable Water Systems
2.3 Innovative Developments in Ion Exchange
2.4 Ion Exchangers Improve Purification of Processed Foods
2.5 Drug Delivery Systems Enhanced with Ion Exchangers
3. KEY GLOBAL PLAYERS
Albemarle Corporation (United States)
ALDEX Chemical Company, Ltd. (Canada)
Anhui Mingmei Minchem Co., Ltd. (China)
Anhui Sanxing Resin Technology Co., Ltd. (China)
Anten Chemical Co., Ltd. (China)
Arkema Group (France)
Bariteworld (United States)
BASF SE (Germany)
Bio-Rad Laboratories Inc. (United States)
Blue Pacific Minerals (New Zealand)
Clariant AG (Switzerland)
Eurecat S.A. (France)
Evoqua Water Technologies LLC (United States)
Finex OY (Finland)
Grupo Coypus S.A. De C.V. (Mexico)
Gujarat Credo Mineral Industries Ltd (India)
Honeywell International Inc. (United States)
Ida-Ore Zeolite (United States)
Imerys Metallurgy Division (Greece)
Incal Mineral G�bre Ve Yem San. Ltd. Sti. (Turkey)
Ion Exchange (India) Limited (India)
Jacobi Carbons AB (Sweden)
Jiangsu Linhai Resin Science and Technology Co., Ltd. (China)
KNT Group (Russia)
Lanxess AG (Germany)
MEC Energy, Mining, Construction Ind. and Trade Co. (Turkey)
Mitsubishi Chemical Holdings Corporation (Japan)
Molecular Products Group Ltd (United Kingdom)
National Aluminium Company Limited (India)
Ningbo Zhengguang Resin Co., Ltd. (China)
Novasep, LLC (United States)
Ovivo Inc. (Canada)
PQ Corporation (United States)
Progressive Planet Solutions Inc. (Canada)
Purolite Corporation (United States)
Resintech, Inc. (United States)
Rota Madencilik AS - Rota Mining Corporation (Turkey)
Samyang Corporation (South Korea)
Sawyer Technical Materials, LLC (United States)
St. Cloud Mining Company (United States)
Sunresin New Materials Co. Ltd. (China)
Teague Mineral Products (United States)
The Dow Chemical Company (United States)
Thermax Global (India)
Tianjin Nankai Hecheng Science & Technology Co., Ltd (Hecheng) (China)
Tosoh Corporation (Japan)
Union Showa Corporation (Union Showa KK) (Japan)
W.R. Grace & Co (United States)
ZEO, Inc. (United States)
Zeocat Soluciones Ecol�gicas S.L.U. (Spain)
Zeocem, A.S. (Slovakia)
Zeochem AG (Switzerland)
Zeotech Corporation (United States)
ZMM® Canada Minerals Corp. (Canada)
4. KEY BUSINESS TRENDS
Purolite Join Forces with PharmNXT Biotech to Supply and Distribute Purolite Life Science Praesto® Range of Chromatography Resins in India
A Memorandum of Understanding Signed by ART Hydroprocessing and Gladieux Metals Recycling for Reusing Metals from Spent Catalysts
BASF SE Opens New Innovative Research Centers for Catalysts and Processes in Ludwigshafen, Germany and Shanghai
Albemarle Corporation Expects to Recover Q1 Lithium Volume shortfalls in Remainder of 2019
New Depolox® 400 M Analyzer for Drinking Water Introduced by Evoqua
ART Hydroprocessing Signed Agreement with GS EcoMetal to Reuse Metals from Spent Catalysts
Albemarle Corporation Plans Lithium Hydroxide (LiOH) Conversion Site in Western Australia
Honeywell UOP to Supply Various Process Technologies for the Second Phase of ZPC's Integrated Refining and Petrochemical Project
Albemarle Corporation and Mineral Resources Limited Enter into Joint Venture Agreement on Lithium Project
BASF to Expand in Shanghai
Plans to Increase the Production Capacity of Formulated Electrolyte for LIBs at Mitsubishi Chemical's Plant in Yokkaichi
Global Water Services Commissioned to Serve as the Midwest Distribution Point for Purolite Resins
Albemarle Corporation Introduces XPLORE™ Platform - KF 787 Pulsar™ Catalyst
Progressive Planet Solutions Inc Discloses Zeolite Efficacy Trial
LANXESS AG to Start New Ion Exchange Resins in Leverkusen, Germany
PPS Opens Advanced Materials Centre (AMC) and Procures Facilities in Vernon, Canada
Purolite’s Purofine® PFA694E Resin Meets New Jersey Municipalities Regulations
Blue Pacific Minerals to Clean Up Lakes in the United States
BASF Launches Luminate™ FCC Catalyst
Dow Water Solutions Won 2018 International Desalination Association (IDA) Award for Industry Technology and Innovation Leader in Water Reuse and Conservation
British Columbia Municipality Purchases PPS’ Zeolite
Blue Pacific Minerals Establishes New Zeolite in Tokoroa, New Zealand
ZMM Canada Minerals Corp Extends its Research on Soil Remediation Using Z-1 Zeolite
Purolite Removes 1, 2 Dichloroethane from Ion Exchange Resin Production
Purolite, China Receives OHSAS 18001:2007 Certification
ZMM Canada Minerals Corp and Ashburton Ventures Inc Discover Zeolite Location
ZMM Canada Minerals Corp Acquires Nesbitt Lake Diatomaceous Earth (DE) Property
Dow Water & Process Solutions Develops New WAVE Software Technology for Clean Water Usage
Purolite Life Sciences Selects Repligen’s OPUS® Chromatography Technology for Biologic Drugs Purification
Progressive Planet Solutions, Inc Sells Zeolite Product from Vernon, BC
BASF Establishes New Zeolites Plant in Ludwigshafen, Germany
KNT Group Supplies Adsorbents to SIBUR-Holding PJSC
CPH Group’s Chemistry Division Streamlines its Swiss-based Companies CU Deutero + Agro AG and Chemie Uetikon AG into Zeochem AG.
Blue Pacific Minerals Launches Feed Supplement Maximin
Tosoh Corporation Expands its High-Silica Zeolite (HSZ®) Production Capacity at Nanyo Complex in Yamaguchi
Zeochem LLC To Establish New Adsorbent Plant in Louisville, Kentucky
Progressive Planet Solutions, Inc Acquires Juniper Creek Chabazite Zeolite and TransCanada Chabazite Zeolite Businesses
Ashburton Ventures Inc Sign Joint Agreement with ZMM Canada Minerals Corp
Purolite Ltd Receives ISO 14001:2015 Certification
Progressive Planet Solutions, Inc Signs Joint Operating Agreement with ZMM® Canada Minerals Corp
Imerys S.A. Acquires Damolin
Xiaomi and Purolite Announce Contract to Remove Contaminants and Control Bacterial Growth
Purolite Selects Strem Chemicals Inc as Distributor Partner
Dow Water & Process Solutions Launches DOWEX MARATHON™ Ion Exchange Resins
Dow Water & Process Solutions Unveils New DOW™ Specialty Membrane Element Solution
The Dow Chemical Company and Colorcon Inc Broaden their Existing Controlled Release Alliance on Robust Pharmaceutical Offering of Ion Exchange Resins
SKion and La Caisse Completes Stake in Ovivo Inc
Blue Pacific Minerals Moves to OPTIMATE™ from OPTIGUARD™ Zeolite Usage
Clariant Showcases Zeolite Innovations at the 18th International Zeolite Conference, in Rio de Janeiro, Brazil
Resinex Receives Approval for its Resinex KW Ion Exchange from French Ministere des Affaires Sociales et de la Sante (FMASS)
5. GLOBAL MARKET OVERVIEW
5.1 Global Ion Exchangers Market Overview by Type
5.1.1 Global Inorganic Ion Exchangers Market Overview by Sub-Type
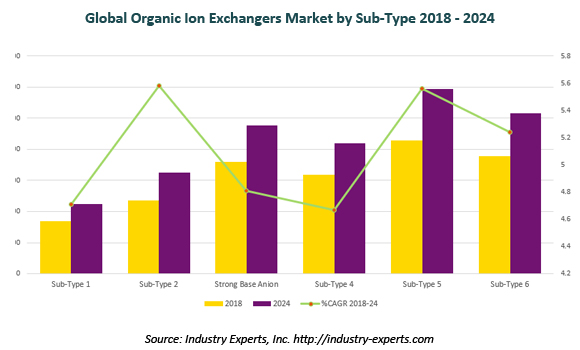
5.1.2 Global Organic Ion Exchangers Market Overview by Sub-Type
5.1.3 Ion Exchangers Type Market Overview by Global Region
5.1.3.1 Composite Ion Exchangers
5.1.3.2 Inorganic Ion Exchangers
5.1.3.2.1 Inorganic Ion Exchangers Sub-Type Market Overview by Global Region
5.1.3.2.1.1 Zeolites
5.1.3.2.1.2 Other Inorganic Ion Exchangers
5.1.3.3 Organic Ion Exchangers
5.1.3.3.1 Organic Ion Exchangers Sub-Type Market Overview by Global Region
5.1.3.3.1.1 Amphoteric Ion Exchangers
5.1.3.3.1.2 Chelating Ion Exchangers
5.1.3.3.1.3 Strong Base Anion Exchangers
5.1.3.3.1.4 Weak Base Anion Exchangers
5.1.3.3.1.5 Strong Acid Cation Exchangers
5.1.3.3.1.6 Weak Acid Cation Exchangers
5.2 Global Ion Exchangers Market Overview by Application
5.2.1 Ion Exchangers Application Market Overview by Global Region
5.2.1.1 Chemical
5.2.1.2 Dairy, Food & Beverages
5.2.1.3 Hydrometallurgy
5.2.1.4 Industrial & Municipal Water Treatment
5.2.1.5 Nuclear Waste Remediation
5.2.1.6 Pharmaceuticals & Medicine
5.2.1.7 Other Applications
PART B: REGIONAL MARKET PERSPECTIVE
REGIONAL MARKET OVERVIEW
6. NORTH AMERICA
6.1 North American Ion Exchangers Market Overview by Geographic Region
6.2 North American Ion Exchangers Market Overview by Type
6.2.1 North American Inorganic Ion Exchangers Market Overview by Sub-Type
6.2.2 North American Organic Ion Exchangers Market Overview by Sub-Type
6.3 North American Ion Exchangers Market Overview by Application
6.4 Major Market Players
ACS Material, LLC (United States)
Albemarle Corporation (United States)
Aldex Chemical Company, Ltd. (Canada)
All American Air Filters, Inc. (United States)
Bariteworld (United States)
Bear River Zeolite (United States)
Bio-Rad Laboratories Inc. (United States)
California Silica Products, LLC (United States)
Cycletrol, Inc. (United States)
Eichrom Technologies LLC (United States)
Evoqua Water Technologies LLC (United States)
Grupo Coypus S.A. De C.V. (Mexico)
Honeywell International Inc. (United States)
Honeywell UOP (United States)
Ida-Ore Zeolite (United States)
Interra Global Corporation (United States)
KMI Zeolite (United States)
Northern Filter Media, Inc. (United States)
Novasep, LLC (United States)
Ovivo Inc. (Canada)
PQ Corporation (United States)
Progressive Planet Solutions Inc. (Canada)
Purolite Corporation (United States)
ResinTech, Inc. (United States)
Rive Technology, Inc. (United States)
Sawyer Technical Materials, LLC (United States)
St. Cloud Mining Company (United States)
Teague Mineral Products (United States)
The Dow Chemical Company (United States)
W.R. Grace & Co (United States)
ZEO, Inc. (United States)
Zeolyst International (United States)
Zeotech Corporation (United States)
Zeovation Inc. (United States)
ZMM® Canada Minerals Corp. (Canada)
6.5 Country-wise Analysis of North American Ion Exchangers Market
6.5.1 The United States
6.5.1.1 United States Ion Exchangers Market Overview by Type
6.5.1.1.1 United States Inorganic Ion Exchangers Market Overview by Sub-Type
6.5.1.1.2 United States Organic Ion Exchangers Market Overview by Sub-Type
6.5.1.2 United States Ion Exchangers Market Overview by Application
6.5.2 Canada
6.5.2.1 Canadian Ion Exchangers Market Overview by Type
6.5.2.1.1 Canadian Inorganic Ion Exchangers Market Overview by Sub-Type
6.5.2.1.2 Canadian Organic Ion Exchangers Market Overview by Sub-Type
6.5.2.2 Canadian Ion Exchangers Market Overview by Application
6.5.3 Mexico
6.5.3.1 Mexican Ion Exchangers Market Overview by Type
6.5.3.1.1 Mexican Inorganic Ion Exchangers Market Overview by Sub-Type
6.5.3.1.2 Mexican Organic Ion Exchangers Market Overview by Sub-Type
6.5.3.2 Mexican Ion Exchangers Market Overview by Application
7. EUROPE
7.1 European Ion Exchangers Market Overview by Geographic Region
7.2 European Ion Exchangers Market Overview by Type
7.2.1 European Inorganic Ion Exchangers Market Overview by Sub-Type
7.2.2 European Organic Ion Exchangers Market Overview by Sub-Type
7.3 European Ion Exchangers Market Overview by Application
7.4 Major Market Players
Arkema Group (France)
CECA Adsorbents (France)
BASF SE (Germany)
Chemiewerk Bad K�stritz GmbH (Germany)
Clariant AG (Switzerland)
Cooperativa La Minera Ltda. (Spain)
Delft Solids Solutions BV (Netherlands)
Eurecat S.A. (France)
Finex OY (Finland)
G. Apostolico & C. Tanagro S.N.C. (Italy)
Gordes Zeolite (Turkey)
Imerys Metallurgy Division (Greece)
Incal Mineral G�bre Ve Yem San. Ltd. Sti. (Turkey)
Ionic Systems Ltd. (United Kingdom)
IQE Group (Spain)
Jacobi Carbons AB (Sweden)
KNT Group (Russia)
Lanxess AG (Germany)
Mec Energy, Mining, Construction Ind. and Trade Co. (Turkey)
Molecular Products Group Ltd (United Kingdom)
Nature's Protection (Ukraine)
Neozeo AB (Sweden)
Panaceo International Active Mineral Production GmbH (Austria)
Rota Madencilik As - Rota Mining Corporation (Turkey)
Silkem, D.O.O. (Slovenia)
Zeocat Soluciones Ecol�gicas S.L.U. (Spain)
Zeocem, A.S. (Slovakia)
Zeochem AG (Switzerland)
Zeoliet-Producten Benoot Pascal (Belgium)
Zeolite Pro Closed Joint Stock Company (Zeolite Pro Cjsc) (Armenia)
Zeolite Products (Netherlands)
Zeolites Production S.A. (Romania)
7.5 Country-wise Analysis of European Ion Exchangers Market
7.5.1 France
7.5.1.1 French Ion Exchangers Market Overview by Type
7.5.1.1.1 French Inorganic Ion Exchangers Market Overview by Sub-Type
7.5.1.1.2 French Organic Ion Exchangers Market Overview by Sub-Type
7.5.1.2 French Ion Exchangers Market Overview by Application
7.5.2 Germany
7.5.2.1 German Ion Exchangers Market Overview by Type
7.5.2.1.1 German Inorganic Ion Exchangers Market Overview by Sub-Type
7.5.2.1.2 German Organic Ion Exchangers Market Overview by Sub-Type
7.5.2.2 German Ion Exchangers Market Overview by Application
7.5.3 Italy
7.5.3.1 Italian Ion Exchangers Market Overview by Type
7.5.3.1.1 Italian Inorganic Ion Exchangers Market Overview by Sub-Type
7.5.3.1.2 Italian Organic Ion Exchangers Market Overview by Sub-Type
7.5.3.2 Italian Ion Exchangers Market Overview by Application
7.5.4 The United Kingdom
7.5.4.1 United Kingdom Ion Exchangers Market Overview by Type
7.5.4.1.1 United Kingdom Inorganic Ion Exchangers Market Overview by Sub-Type
7.5.4.1.2 United Kingdom Organic Ion Exchangers Market Overview by Sub-Type
7.5.4.2 United Kingdom Ion Exchangers Market Overview by Application
7.5.5 Rest of Europe
7.5.5.1 Rest of Europe Ion Exchangers Market Overview by Type
7.5.5.1.1 Rest of Europe Inorganic Ion Exchangers Market Overview by Sub-Type
7.5.5.1.2 Rest of Europe Organic Ion Exchangers Market Overview by Sub-Type
7.5.5.2 Rest of Europe Ion Exchangers Market Overview by Application
8. ASIA-PACIFIC
8.1 Asia-Pacific Ion Exchangers Market Overview by Geographic Region
8.2 Asia-Pacific Ion Exchangers Market Overview by Type
8.2.1 Asia-Pacific Inorganic Ion Exchangers Market Overview by Sub-Type
8.2.2 Asia-Pacific Organic Ion Exchangers Market Overview by Sub-Type
8.3 Asia-Pacific Ion Exchangers Market Overview by Application
8.4 Major Market Players
Anhui Mingmei Minchem Co., Ltd. (China)
Anhui Sanxing Resin Technology Co., Ltd. (China)
Anten Chemical Co., Ltd. (China)
ATC Zeolite (Iran)
Auchtel Products Limited (India)
Bengbu Dongli Chemical Co., Ltd. (China)
Blue Pacific Minerals (New Zealand)
Dalian Haixin Chemical Industrial Co., Ltd (China)
Gujarat Credo Mineral Industries Ltd (India)
Gujarat Multi Gas Base Chemicals Pvt. Ltd. (India)
Huiying Chemical Industry (Quanzhou) Co., Ltd. (China)
Ion Exchange (India) Limited (India)
Jacobi Resinex (Japan)
Jiangsu Linhai Resin Science and Technology Co., Ltd. (China)
Manek Minerals (India)
Mitsubishi Chemical Holdings Corporation (Japan)
Mitsubishi Chemical Corporation (Japan)
Mitsubishi Chemical Corporation Separation and Materials Department (Japan)
National Aluminium Company Limited (India)
Ningbo Zhengguang Resin Co., Ltd. (China)
PT Khatulistiwa Hijau Prima (Indonesia)
Samyang Corporation (South Korea)
Sorbead India (India)
Sunresin New Materials Co. Ltd. (China)
Suqing Group (China)
TAZA SU LLP (Kazakhstan)
Thermax Global (India)
Tianjin Nankai Hecheng Science & Technology Co., Ltd (Hecheng) (China)
Tosoh Corporation (Japan)
Union Showa Corporation (Union Showa KK) (Japan)
8.5 Country-wise Analysis of Asia-Pacific Ion Exchangers Market
8.5.1 China
8.5.1.1 Chinese Ion Exchangers Market Overview by Type
8.5.1.1.1 Chinese Inorganic Ion Exchangers Market Overview by Sub-Type
8.5.1.1.2 Chinese Organic Ion Exchangers Market Overview by Sub-Type
8.5.1.2 Chinese Ion Exchangers Market Overview by Application
8.5.2 India
8.5.2.1 Indian Ion Exchangers Market Overview by Type
8.5.2.1.1 Indian Inorganic Ion Exchangers Market Overview by Sub-Type
8.5.2.1.2 Indian Organic Ion Exchangers Market Overview by Sub-Type
8.5.2.2 Indian Ion Exchangers Market Overview by Application
8.5.3 Japan
8.5.3.1 Japanese Ion Exchangers Market Overview by Type
8.5.3.1.1 Japanese Inorganic Ion Exchangers Market Overview by Sub-Type
8.5.3.1.2 Japanese Organic Ion Exchangers Market Overview by Sub-Type
8.5.3.2 Japanese Ion Exchangers Market Overview by Application
8.5.4 Rest of Asia-Pacific
8.5.4.1 Rest of Asia-Pacific Ion Exchangers Market Overview by Type
8.5.4.1.1 Rest of Asia-Pacific Inorganic Ion Exchangers Market Overview by Sub-Type
8.5.4.1.2 Asia-Pacific Organic Ion Exchangers Market Overview by Sub-Type
8.5.4.2 Rest of Asia-Pacific Ion Exchangers Market Overview by Application
9. SOUTH AMERICA
9.1 South American Ion Exchangers Market Overview by Geographic Region
9.2 South American Ion Exchangers Market Overview by Type
9.2.1 South American Inorganic Ion Exchangers Market Overview by Sub-Type
9.2.2 South American Organic Ion Exchangers Market Overview by Sub-Type
9.3 South American Ion Exchangers Market Overview by Application
9.4 Major Market Players
Compa��a Minera Argentina (Argentina)
Minera Formas (Chile)
9.5 Country-wise Analysis of South American Ion Exchangers Market
9.5.1 Argentina
9.5.1.1 Argentinean Ion Exchangers Market Overview by Type
9.5.1.1.1 Argentinean Inorganic Ion Exchangers Market Overview by Sub-Type
9.5.1.1.2 Argentinean Organic Ion Exchangers Market Overview by Sub-Type
9.5.1.2 Argentinean Ion Exchangers Market Overview by Application
9.5.2 Brazil
9.5.2.1 Brazilian Ion Exchangers Market Overview by Type
9.5.2.1.1 Brazilian Inorganic Ion Exchangers Market Overview by Sub-Type
9.5.2.1.2 Brazilian Organic Ion Exchangers Market Overview by Sub-Type
9.5.2.2 Brazilian Ion Exchangers Market Overview by Application
9.5.3 Rest of South America
9.5.3.1 Rest of South America Ion Exchangers Market Overview by Type
9.5.3.1.1 Rest of South America Inorganic Ion Exchangers Market Overview by Sub-Type
9.5.3.1.2 Rest of South America Organic Ion Exchangers Market Overview by Sub-Type
9.5.3.2 Rest of South America Ion Exchangers Market Overview by Application
10. REST OF WORLD
10.1 Rest of World Ion Exchangers Market Overview by Type
10.1.1 Rest of World Inorganic Ion Exchangers Market Overview by Sub-Type
10.1.2 Rest of World Organic Ion Exchangers Market Overview by Sub-Type
10.2 Rest of World Ion Exchangers Market Overview by Application
10.3 Pratley (South Africa) – A Major Market Player
PART C: GUIDE TO THE INDUSTRY
1. NORTH AMERICA
2. EUROPE
3. ASIA-PACIFIC
4. SOUTH AMERICA
5. REST OF WORLD
PART D: ANNEXURE
1. RESEARCH METHODOLOGY
2. FEEDBACK
Charts & Graphs
PART A: GLOBAL MARKET PERSPECTIVE
Chart 1: Global Ion Exchangers Market (2018 & 2024) by Type
Chart 2: Global Organic Ion Exchangers Market (2018 & 2024) by Sub-Type
Chart 3: Global Ion Exchangers Market (2018 & 2024) by Application
Chart 4: Global Ion Exchangers Market Analysis (2015-2024) in USD Million
Chart 5: Global Ion Exchangers Market Analysis (2015-2024) by Type – Composite Ion Exchangers, Inorganic Ion Exchangers and Organic Ion Exchangers in USD Million
Chart 6: Glance at 2015, 2018 and 2024 Global Ion Exchangers Market Share (%) by Type – Composite Ion Exchangers, Inorganic Ion Exchangers and Organic Ion Exchangers
Chart 7: Global Inorganic Ion Exchangers Market Analysis (2015-2024) by Sub-Type – Zeolites and Other Inorganic Ion Exchangers in USD Million
Chart 8: Glance at 2015, 2018 and 2024 Global Inorganic Ion Exchangers Market Share (%) by Sub-Type – Zeolites and Other Inorganic Ion Exchangers
Chart 9: Global Organic Ion Exchangers Market Analysis (2015-2024) by Sub-Type – Amphoteric Ion Exchangers, Chelating Ion Exchangers, Strong Base Anion Exchangers, Weak Base Anion Exchangers, Strong Acid Cation Exchangers and Weak Acid Cation Exchangers in USD Million
Chart 10: Glance at 2015, 2018 and 2024 Global Organic Ion Exchangers Market Share (%) by Sub-Type – Amphoteric Ion Exchangers, Chelating Ion Exchangers, Strong Base Anion Exchangers, Weak Base Anion Exchangers, Strong Acid Cation Exchangers and Weak Acid Cation Exchangers
Chart 11: Global Composite Ion Exchangers Market Analysis (2015-2024) by Geographic Region – North America, Europe, Asia-Pacific, South America and Rest of World in USD Million
Chart 12: Glance at 2015, 2018 and 2024 Global Composite Ion Exchangers Market Share (%) by Region – North America, Europe, Asia-Pacific, South America and Rest of World
Chart 13: Global Inorganic Ion Exchangers Market Analysis (2015-2024) by Geographic Region – North America, Europe, Asia-Pacific, South America and Rest of World in USD Million
Chart 14: Glance at 2015, 2018 and 2024 Global Inorganic Ion Exchangers Market Share (%) by Region – North America, Europe, Asia-Pacific, South America and Rest of World
Chart 15: Global Zeolites Market Analysis (2015-2024) by Geographic Region – North America, Europe, Asia-Pacific, South America and Rest of World in USD Million
Chart 16: Glance at 2015, 2018 and 2024 Global Zeolites Market Share (%) by Region – North America, Europe, Asia-Pacific, South America and Rest of World
Chart 17: Global Other Inorganic Ion Exchangers Market Analysis (2015-2024) by Geographic Region – North America, Europe, Asia-Pacific, South America and Rest of World in USD Million
Chart 18: Glance at 2015, 2018 and 2024 Global Other Inorganic Ion Exchangers Market Share (%) by Region – North America, Europe, Asia-Pacific, South America and Rest of World
Chart 19: Global Organic Ion Exchangers Market Analysis (2015-2024) by Geographic Region – North America, Europe, Asia-Pacific, South America and Rest of World in USD Million
Chart 20: Glance at 2015, 2018 and 2024 Global Organic Ion Exchangers Market Share (%) by Region – North America, Europe, Asia-Pacific, South America and Rest of World
Chart 21: Global Amphoteric Ion Exchangers Market Analysis (2015-2024) by Geographic Region – North America, Europe, Asia-Pacific, South America and Rest of World in USD Million
Chart 22: Glance at 2015, 2018 and 2024 Global Amphoteric Ion Exchangers Market Share (%) by Region – North America, Europe, Asia-Pacific, South America and Rest of World
Chart 23: Global Chelating Ion Exchangers Market Analysis (2015-2024) by Geographic Region – North America, Europe, Asia-Pacific, South America and Rest of World in USD Million
Chart 24: Glance at 2015, 2018 and 2024 Global Chelating Ion Exchangers Market Share (%) by Region – North America, Europe, Asia-Pacific, South America and Rest of World
Chart 25: Global Strong Base Anion Exchangers Market Analysis (2015-2024) by Geographic Region – North America, Europe, Asia-Pacific, South America and Rest of World in USD Million
Chart 26: Glance at 2015, 2018 and 2024 Global Strong Base Anion Exchangers Market Share (%) by Region – North America, Europe, Asia-Pacific, South America and Rest of World
Chart 27: Global Weak Base Anion Exchangers Market Analysis (2015-2024) by Geographic Region – North America, Europe, Asia-Pacific, South America and Rest of World in USD Million
Chart 28: Glance at 2015, 2018 and 2024 Global Weak Base Anion Exchangers Market Share (%) by Region – North America, Europe, Asia-Pacific, South America and Rest of World
Chart 29: Global Strong Acid Cation Exchangers Market Analysis (2015-2024) by Geographic Region – North America, Europe, Asia-Pacific, South America and Rest of World in USD Million
Chart 30: Glance at 2015, 2018 and 2024 Global Strong Acid Cation Exchangers Market Share (%) by Region – North America, Europe, Asia-Pacific, South America and Rest of World
Chart 31: Global Weak Acid Cation Exchangers Market Analysis (2015-2024) by Geographic Region – North America, Europe, Asia-Pacific, South America and Rest of World in USD Million
Chart 32: Glance at 2015, 2018 and 2024 Global Weak Acid Cation Exchangers Market Share (%) by Region – North America, Europe, Asia-Pacific, South America and Rest of World
Chart 33: Global Ion Exchangers Market Analysis (2015-2024) by Application – Chemical, Dairy, Food & Beverages, Hydrometallurgy, Industrial & Municipal Water Treatment, Nuclear Waste Remediation, Pharmaceuticals & Medicine and Other Applications in USD Million
Chart 34: Glance at 2015, 2018 and 2024 Global Ion Exchangers Market Share (%) by Application – Chemical, Dairy, Food & Beverages, Hydrometallurgy, Industrial & Municipal Water Treatment, Nuclear Waste Remediation, Pharmaceuticals & Medicine and Other Applications
Chart 35: Global Ion Exchangers Market Analysis (2015-2024) in Chemical Applications by Region – North America, Europe, Asia-Pacific, South America and Rest of World in USD Million
Chart 36: Glance at 2015, 2018 and 2024 Global Ion Exchangers Market Share (%) in Chemical Applications by Region – North America, Europe, Asia-Pacific, South America and Rest of World
Chart 37: Global Ion Exchangers Market Analysis (2015-2024) in Dairy, Food & Beverage Applications by Region – North America, Europe, Asia-Pacific, South America and Rest of World in USD Million
Chart 38: Glance at 2015, 2018 and 2024 Global Ion Exchangers Market Share (%) in Dairy, Food & Beverage Applications by Region – North America, Europe, Asia-Pacific, South America and Rest of World
Chart 39: Global Ion Exchangers Market Analysis (2015-2024) in Hydrometallurgy Applications by Region – North America, Europe, Asia-Pacific, South America and Rest of World in USD Million
Chart 40: Glance at 2015, 2018 and 2024 Global Ion Exchangers Market Share (%) in Hydrometallurgy Applications by Region – North America, Europe, Asia-Pacific, South America and Rest of World
Chart 41: Global Ion Exchangers Market Analysis (2015-2024) in Industrial & Municipal Water Treatment Applications by Region – North America, Europe, Asia-Pacific, South America and Rest of World in USD Million
Chart 42: Glance at 2015, 2018 and 2024 Global Ion Exchangers Market Share (%) in Industrial & Municipal Water Treatment Applications by Region – North America, Europe, Asia-Pacific, South America and Rest of World
Chart 43: Global Ion Exchangers Market Analysis (2015-2024) in Nuclear Waste Remediation Applications by Region – North America, Europe, Asia-Pacific, South America and Rest of World in USD Million
Chart 44: Glance at 2015, 2018 and 2024 Global Ion Exchangers Market Share (%) in Nuclear Waste Remediation Applications by Region – North America, Europe, Asia-Pacific, South America and Rest of World
Chart 45: Global Ion Exchangers Market Analysis (2015-2024) in Pharmaceutical & Medicine Applications by Region – North America, Europe, Asia-Pacific, South America and Rest of World in USD Million
Chart 46: Glance at 2015, 2018 and 2024 Global Ion Exchangers Market Share (%) in Pharmaceutical & Medicine Applications by Region – North America, Europe, Asia-Pacific, South America and Rest of World
Chart 47: Global Ion Exchangers Market Analysis (2015-2024) in Other Applications by Region – North America, Europe, Asia-Pacific, South America and Rest of World in USD Million
Chart 48: Glance at 2015, 2018 and 2024 Global Ion Exchangers Market Share (%) in Other Applications by Region – North America, Europe, Asia-Pacific, South America and Rest of World
PART B: REGIONAL MARKET PERSPECTIVE
Chart 49: Global Ion Exchangers Market Analysis (2015-2024) by Geographic Region – North America, Europe, Asia-Pacific, South America and Rest of World in USD Million
Chart 50: Glance at 2015, 2018 and 2024 Global Ion Exchangers Market Share (%) by Region – North America, Europe, Asia-Pacific, South America and Rest of World
REGIONAL MARKET OVERVIEW
NORTH AMERICA
Chart 51: North American Ion Exchangers Market Analysis (2015-2024) in USD Million
Chart 52: North American Ion Exchangers Market Analysis (2015-2024) by Geographic Region – United States, Canada and Mexico in USD Million
Chart 53: Glance at 2015, 2018 and 2024 North American Ion Exchangers Market Share (%) by Region – United States, Canada and Mexico
Chart 54: North American Ion Exchangers Market Analysis (2015-2024) by Type – Composite Ion Exchangers, Inorganic Ion Exchangers and Organic Ion Exchangers in USD Million
Chart 55: Glance at 2015, 2018 and 2024 North American Ion Exchangers Market Share (%) by Type – Composite Ion Exchangers, Inorganic Ion Exchangers and Organic Ion Exchangers
Chart 56: North American Inorganic Ion Exchangers Market Analysis (2015-2024) by Sub-Type – Zeolites and Other Inorganic Ion Exchangers in USD Million
Chart 57: Glance at 2015, 2018 and 2024 North American Inorganic Ion Exchangers Market Share (%) by Sub-Type – Zeolites and Other Inorganic Ion Exchangers
Chart 58: North American Organic Ion Exchangers Market Analysis (2015-2024) by Sub-Type – Amphoteric Ion Exchangers, Chelating Ion Exchangers, Strong Base Anion Exchangers, Weak Base Anion Exchangers, Strong Acid Cation Exchangers and Weak Acid Cation Exchangers in USD Million
Chart 59: Glance at 2015, 2018 and 2024 North American Organic Ion Exchangers Market Share (%) by Sub-Type – Amphoteric Ion Exchangers, Chelating Ion Exchangers, Strong Base Anion Exchangers, Weak Base Anion Exchangers, Strong Acid Cation Exchangers and Weak Acid Cation Exchangers
Chart 60: North American Ion Exchangers Market Analysis (2015-2024) by Application – Chemical, Dairy, Food & Beverages, Hydrometallurgy, Industrial & Municipal Water Treatment, Nuclear Waste Remediation, Pharmaceuticals & Medicine and Other Applications in USD Million
Chart 61: Glance at 2015, 2018 and 2024 North American Ion Exchangers Market Share (%) by Application – Chemical, Dairy, Food & Beverages, Hydrometallurgy, Industrial & Municipal Water Treatment, Nuclear Waste Remediation, Pharmaceuticals & Medicine and Other Applications
The United States
Chart 62: United States Ion Exchangers Market Analysis (2015-2024) in USD Million
Chart 63: United States Ion Exchangers Market Analysis (2015-2024) by Type – Composite Ion Exchangers, Inorganic Ion Exchangers and Organic Ion Exchangers in USD Million
Chart 64: Glance at 2015, 2018 and 2024 United States Ion Exchangers Market Share (%) by Type – Composite Ion Exchangers, Inorganic Ion Exchangers and Organic Ion Exchangers
Chart 65: United States Inorganic Ion Exchangers Market Analysis (2015-2024) by Sub-Type – Zeolites and Other Inorganic Ion Exchangers in USD Million
Chart 66: Glance at 2015, 2018 and 2024 United States Inorganic Ion Exchangers Market Share (%) by Sub-Type – Zeolites and Other Inorganic Ion Exchangers
Chart 67: United States Organic Ion Exchangers Market Analysis (2015-2024) by Sub-Type – Amphoteric Ion Exchangers, Chelating Ion Exchangers, Strong Base Anion Exchangers, Weak Base Anion Exchangers, Strong Acid Cation Exchangers and Weak Acid Cation Exchangers in USD Million
Chart 68: Glance at 2015, 2018 and 2024 United States Organic Ion Exchangers Market Share (%) by Sub-Type – Amphoteric Ion Exchangers, Chelating Ion Exchangers, Strong Base Anion Exchangers, Weak Base Anion Exchangers, Strong Acid Cation Exchangers and Weak Acid Cation Exchangers
Chart 69: United States Ion Exchangers Market Analysis (2015-2024) by Application – Chemical, Dairy, Food & Beverages, Hydrometallurgy, Industrial & Municipal Water Treatment, Nuclear Waste Remediation, Pharmaceuticals & Medicine and Other Applications in USD Million
Chart 70: Glance at 2015, 2018 and 2024 United States Ion Exchangers Market Share (%) by Application – Chemical, Dairy, Food & Beverages, Hydrometallurgy, Industrial & Municipal Water Treatment, Nuclear Waste Remediation, Pharmaceuticals & Medicine and Other Applications
Canada
Chart 71: Canadian Ion Exchangers Market Analysis (2015-2024) in USD Million
Chart 72: Canadian Ion Exchangers Market Analysis (2015-2024) by Type – Composite Ion Exchangers, Inorganic Ion Exchangers and Organic Ion Exchangers in USD Million
Chart 73: Glance at 2015, 2018 and 2024 Canadian Ion Exchangers Market Share (%) by Type – Composite Ion Exchangers, Inorganic Ion Exchangers and Organic Ion Exchangers
Chart 74: Canadian Inorganic Ion Exchangers Market Analysis (2015-2024) by Sub-Type – Zeolites and Other Inorganic Ion Exchangers in USD Million
Chart 75: Glance at 2015, 2018 and 2024 Canadian Inorganic Ion Exchangers Market Share (%) by Sub-Type – Zeolites and Other Inorganic Ion Exchangers
Chart 76: Canadian Organic Ion Exchangers Market Analysis (2015-2024) by Sub-Type – Amphoteric Ion Exchangers, Chelating Ion Exchangers, Strong Base Anion Exchangers, Weak Base Anion Exchangers, Strong Acid Cation Exchangers and Weak Acid Cation Exchangers in USD Million
Chart 77: Glance at 2015, 2018 and 2024 Canadian Organic Ion Exchangers Market Share (%) by Sub-Type – Amphoteric Ion Exchangers, Chelating Ion Exchangers, Strong Base Anion Exchangers, Weak Base Anion Exchangers, Strong Acid Cation Exchangers and Weak Acid Cation Exchangers
Chart 78: Canadian Ion Exchangers Market Analysis (2015-2024) by Application – Chemical, Dairy, Food & Beverages, Hydrometallurgy, Industrial & Municipal Water Treatment, Nuclear Waste Remediation, Pharmaceuticals & Medicine and Other Applications in USD Million
Chart 79: Glance at 2015, 2018 and 2024 Canadian Ion Exchangers Market Share (%) by Application – Chemical, Dairy, Food & Beverages, Hydrometallurgy, Industrial & Municipal Water Treatment, Nuclear Waste Remediation, Pharmaceuticals & Medicine and Other Applications
Mexico
Chart 80: Mexican Ion Exchangers Market Analysis (2015-2024) in USD Million
Chart 81: Mexican Ion Exchangers Market Analysis (2015-2024) by Type – Composite Ion Exchangers, Inorganic Ion Exchangers and Organic Ion Exchangers in USD Million
Chart 82: Glance at 2015, 2018 and 2024 Mexican Ion Exchangers Market Share (%) by Type – Composite Ion Exchangers, Inorganic Ion Exchangers and Organic Ion Exchangers
Chart 83: Mexican Inorganic Ion Exchangers Market Analysis (2015-2024) by Sub-Type – Zeolites and Other Inorganic Ion Exchangers in USD Million
Chart 84: Glance at 2015, 2018 and 2024 Mexican Inorganic Ion Exchangers Market Share (%) by Sub-Type – Zeolites and Other Inorganic Ion Exchangers
Chart 85: Mexican Organic Ion Exchangers Market Analysis (2015-2024) by Sub-Type – Amphoteric Ion Exchangers, Chelating Ion Exchangers, Strong Base Anion Exchangers, Weak Base Anion Exchangers, Strong Acid Cation Exchangers and Weak Acid Cation Exchangers in USD Million
Chart 86: Glance at 2015, 2018 and 2024 Mexican Organic Ion Exchangers Market Share (%) by Sub-Type – Amphoteric Ion Exchangers, Chelating Ion Exchangers, Strong Base Anion Exchangers, Weak Base Anion Exchangers, Strong Acid Cation Exchangers and Weak Acid Cation Exchangers
Chart 87: Mexican Ion Exchangers Market Analysis (2015-2024) by Application – Chemical, Dairy, Food & Beverages, Hydrometallurgy, Industrial & Municipal Water Treatment, Nuclear Waste Remediation, Pharmaceuticals & Medicine and Other Applications in USD Million
Chart 88: Glance at 2015, 2018 and 2024 Mexican Ion Exchangers Market Share (%) by Application – Chemical, Dairy, Food & Beverages, Hydrometallurgy, Industrial & Municipal Water Treatment, Nuclear Waste Remediation, Pharmaceuticals & Medicine and Other Applications
EUROPE
Chart 89: European Ion Exchangers Market Analysis (2015-2024) in USD Million
Chart 90: European Ion Exchangers Market Analysis (2015-2024) by Geographic Region – France, Germany, Italy, United Kingdom and Rest of Europe in USD Million
Chart 91: Glance at 2015, 2018 and 2024 European Ion Exchangers Market Share (%) by Region – France, Germany, Italy, United Kingdom and Rest of Europe
Chart 92: European Ion Exchangers Market Analysis (2015-2024) by Type – Composite Ion Exchangers, Inorganic Ion Exchangers and Organic Ion Exchangers in USD Million
Chart 93: Glance at 2015, 2018 and 2024 European Ion Exchangers Market Share (%) by Type – Composite Ion Exchangers, Inorganic Ion Exchangers and Organic Ion Exchangers
Chart 94: European Inorganic Ion Exchangers Market Analysis (2015-2024) by Sub-Type – Zeolites and Other Inorganic Ion Exchangers in USD Million
Chart 95: Glance at 2015, 2018 and 2024 European Inorganic Ion Exchangers Market Share (%) by Sub-Type – Zeolites and Other Inorganic Ion Exchangers
Chart 96: European Organic Ion Exchangers Market Analysis (2015-2024) by Sub-Type – Amphoteric Ion Exchangers, Chelating Ion Exchangers, Strong Base Anion Exchangers, Weak Base Anion Exchangers, Strong Acid Cation Exchangers and Weak Acid Cation Exchangers in USD Million
Chart 97: Glance at 2015, 2018 and 2024 European Organic Ion Exchangers Market Share (%) by Sub-Type – Amphoteric Ion Exchangers, Chelating Ion Exchangers, Strong Base Anion Exchangers, Weak Base Anion Exchangers, Strong Acid Cation Exchangers and Weak Acid Cation Exchangers
Chart 98: European Ion Exchangers Market Analysis (2015-2024) by Application – Chemical, Dairy, Food & Beverages, Hydrometallurgy, Industrial & Municipal Water Treatment, Nuclear Waste Remediation, Pharmaceuticals & Medicine and Other Applications in USD Million
Chart 99: Glance at 2015, 2018 and 2024 European Ion Exchangers Market Share (%) by Application – Chemical, Dairy, Food & Beverages, Hydrometallurgy, Industrial & Municipal Water Treatment, Nuclear Waste Remediation, Pharmaceuticals & Medicine and Other Applications
France
Chart 100: French Ion Exchangers Market Analysis (2015-2024) in USD Million
Chart 101: French Ion Exchangers Market Analysis (2015-2024) by Type – Composite Ion Exchangers, Inorganic Ion Exchangers and Organic Ion Exchangers in USD Million
Chart 102: Glance at 2015, 2018 and 2024 French Ion Exchangers Market Share (%) by Type – Composite Ion Exchangers, Inorganic Ion Exchangers and Organic Ion Exchangers
Chart 103: French Inorganic Ion Exchangers Market Analysis (2015-2024) by Sub-Type – Zeolites and Other Inorganic Ion Exchangers in USD Million
Chart 104: Glance at 2015, 2018 and 2024 French Inorganic Ion Exchangers Market Share (%) by Sub-Type – Zeolites and Other Inorganic Ion Exchangers
Chart 105: French Organic Ion Exchangers Market Analysis (2015-2024) by Sub-Type – Amphoteric Ion Exchangers, Chelating Ion Exchangers, Strong Base Anion Exchangers, Weak Base Anion Exchangers, Strong Acid Cation Exchangers and Weak Acid Cation Exchangers in USD Million
Chart 106: Glance at 2015, 2018 and 2024 French Organic Ion Exchangers Market Share (%) by Sub-Type – Amphoteric Ion Exchangers, Chelating Ion Exchangers, Strong Base Anion Exchangers, Weak Base Anion Exchangers, Strong Acid Cation Exchangers and Weak Acid Cation Exchangers
Chart 107: French Ion Exchangers Market Analysis (2015-2024) by Application – Chemical, Dairy, Food & Beverages, Hydrometallurgy, Industrial & Municipal Water Treatment, Nuclear Waste Remediation, Pharmaceuticals & Medicine and Other Applications in USD Million
Chart 108: Glance at 2015, 2018 and 2024 French Ion Exchangers Market Share (%) by Application – Chemical, Dairy, Food & Beverages, Hydrometallurgy, Industrial & Municipal Water Treatment, Nuclear Waste Remediation, Pharmaceuticals & Medicine and Other Applications
Germany
Chart 109: German Ion Exchangers Market Analysis (2015-2024) in USD Million
Chart 110: German Ion Exchangers Market Analysis (2015-2024) by Type – Composite Ion Exchangers, Inorganic Ion Exchangers and Organic Ion Exchangers in USD Million
Chart 111: Glance at 2015, 2018 and 2024 German Ion Exchangers Market Share (%) by Type – Composite Ion Exchangers, Inorganic Ion Exchangers and Organic Ion Exchangers
Chart 112: German Inorganic Ion Exchangers Market Analysis (2015-2024) by Sub-Type – Zeolites and Other Inorganic Ion Exchangers in USD Million
Chart 113: Glance at 2015, 2018 and 2024 German Inorganic Ion Exchangers Market Share (%) by Sub-Type – Zeolites and Other Inorganic Ion Exchangers
Chart 114: German Organic Ion Exchangers Market Analysis (2015-2024) by Sub-Type – Amphoteric Ion Exchangers, Chelating Ion Exchangers, Strong Base Anion Exchangers, Weak Base Anion Exchangers, Strong Acid Cation Exchangers and Weak Acid Cation Exchangers in USD Million
Chart 115: Glance at 2015, 2018 and 2024 German Organic Ion Exchangers Market Share (%) by Sub-Type – Amphoteric Ion Exchangers, Chelating Ion Exchangers, Strong Base Anion Exchangers, Weak Base Anion Exchangers, Strong Acid Cation Exchangers and Weak Acid Cation Exchangers
Chart 116: German Ion Exchangers Market Analysis (2015-2024) by Application – Chemical, Dairy, Food & Beverages, Hydrometallurgy, Industrial & Municipal Water Treatment, Nuclear Waste Remediation, Pharmaceuticals & Medicine and Other Applications in USD Million
Chart 117: Glance at 2015, 2018 and 2024 German Ion Exchangers Market Share (%) by Application – Chemical, Dairy, Food & Beverages, Hydrometallurgy, Industrial & Municipal Water Treatment, Nuclear Waste Remediation, Pharmaceuticals & Medicine and Other Applications
Italy
Chart 118: Italian Ion Exchangers Market Analysis (2015-2024) in USD Million
Chart 119: Italian Ion Exchangers Market Analysis (2015-2024) by Type – Composite Ion Exchangers, Inorganic Ion Exchangers and Organic Ion Exchangers in USD Million
Chart 120: Glance at 2015, 2018 and 2024 Italian Ion Exchangers Market Share (%) by Type – Composite Ion Exchangers, Inorganic Ion Exchangers and Organic Ion Exchangers
Chart 121: Italian Inorganic Ion Exchangers Market Analysis (2015-2024) by Sub-Type – Zeolites and Other Inorganic Ion Exchangers in USD Million
Chart 122: Glance at 2015, 2018 and 2024 Italian Inorganic Ion Exchangers Market Share (%) by Sub-Type – Zeolites and Other Inorganic Ion Exchangers
Chart 123: Italian Organic Ion Exchangers Market Analysis (2015-2024) by Sub-Type – Amphoteric Ion Exchangers, Chelating Ion Exchangers, Strong Base Anion Exchangers, Weak Base Anion Exchangers, Strong Acid Cation Exchangers and Weak Acid Cation Exchangers in USD Million
Chart 124: Glance at 2015, 2018 and 2024 Italian Organic Ion Exchangers Market Share (%) by Sub-Type – Amphoteric Ion Exchangers, Chelating Ion Exchangers, Strong Base Anion Exchangers, Weak Base Anion Exchangers, Strong Acid Cation Exchangers and Weak Acid Cation Exchangers
Chart 125: Italian Ion Exchangers Market Analysis (2015-2024) by Application – Chemical, Dairy, Food & Beverages, Hydrometallurgy, Industrial & Municipal Water Treatment, Nuclear Waste Remediation, Pharmaceuticals & Medicine and Other Applications in USD Million
Chart 126: Glance at 2015, 2018 and 2024 Italian Ion Exchangers Market Share (%) by Application – Chemical, Dairy, Food & Beverages, Hydrometallurgy, Industrial & Municipal Water Treatment, Nuclear Waste Remediation, Pharmaceuticals & Medicine and Other Applications
The United Kingdom
Chart 127: United Kingdom Ion Exchangers Market Analysis (2015-2024) in USD Million
Chart 128: United Kingdom Ion Exchangers Market Analysis (2015-2024) by Type – Composite Ion Exchangers, Inorganic Ion Exchangers and Organic Ion Exchangers in USD Million
Chart 129: Glance at 2015, 2018 and 2024 United Kingdom Ion Exchangers Market Share (%) by Type – Composite Ion Exchangers, Inorganic Ion Exchangers and Organic Ion Exchangers
Chart 130: United Kingdom Inorganic Ion Exchangers Market Analysis (2015-2024) by Sub-Type – Zeolites and Other Inorganic Ion Exchangers in USD Million
Chart 131: Glance at 2015, 2018 and 2024 United Kingdom Inorganic Ion Exchangers Market Share (%) by Sub-Type – Zeolites and Other Inorganic Ion Exchangers
Chart 132: United Kingdom Organic Ion Exchangers Market Analysis (2015-2024) by Sub-Type – Amphoteric Ion Exchangers, Chelating Ion Exchangers, Strong Base Anion Exchangers, Weak Base Anion Exchangers, Strong Acid Cation Exchangers and Weak Acid Cation Exchangers in USD Million
Chart 133: Glance at 2015, 2018 and 2024 United Kingdom Organic Ion Exchangers Market Share (%) by Sub-Type – Amphoteric Ion Exchangers, Chelating Ion Exchangers, Strong Base Anion Exchangers, Weak Base Anion Exchangers, Strong Acid Cation Exchangers and Weak Acid Cation Exchangers
Chart 134: United Kingdom Ion Exchangers Market Analysis (2015-2024) by Application – Chemical, Dairy, Food & Beverages, Hydrometallurgy, Industrial & Municipal Water Treatment, Nuclear Waste Remediation, Pharmaceuticals & Medicine and Other Applications in USD Million
Chart 135: Glance at 2015, 2018 and 2024 United Kingdom Ion Exchangers Market Share (%) by Application – Chemical, Dairy, Food & Beverages, Hydrometallurgy, Industrial & Municipal Water Treatment, Nuclear Waste Remediation, Pharmaceuticals & Medicine and Other Applications
Rest of Europe
Chart 136: Rest of Europe Ion Exchangers Market Analysis (2015-2024) in USD Million
Chart 137: Rest of Europe Ion Exchangers Market Analysis (2015-2024) by Type – Composite Ion Exchangers, Inorganic Ion Exchangers and Organic Ion Exchangers in USD Million
Chart 138: Glance at 2015, 2018 and 2024 Rest of Europe Ion Exchangers Market Share (%) by Type – Composite Ion Exchangers, Inorganic Ion Exchangers and Organic Ion Exchangers
Chart 139: Rest of Europe Inorganic Ion Exchangers Market Analysis (2015-2024) by Sub-Type – Zeolites and Other Inorganic Ion Exchangers in USD Million
Chart 140: Glance at 2015, 2018 and 2024 Rest of Europe Inorganic Ion Exchangers Market Share (%) by Sub-Type – Zeolites and Other Inorganic Ion Exchangers
Chart 141: Rest of Europe Organic Ion Exchangers Market Analysis (2015-2024) by Sub-Type – Amphoteric Ion Exchangers, Chelating Ion Exchangers, Strong Base Anion Exchangers, Weak Base Anion Exchangers, Strong Acid Cation Exchangers and Weak Acid Cation Exchangers in USD Million
Chart 142: Glance at 2015, 2018 and 2024 Rest of Europe Organic Ion Exchangers Market Share (%) by Sub-Type – Amphoteric Ion Exchangers, Chelating Ion Exchangers, Strong Base Anion Exchangers, Weak Base Anion Exchangers, Strong Acid Cation Exchangers and Weak Acid Cation Exchangers
Chart 143: Rest of Europe Ion Exchangers Market Analysis (2015-2024) by Application – Chemical, Dairy, Food & Beverages, Hydrometallurgy, Industrial & Municipal Water Treatment, Nuclear Waste Remediation, Pharmaceuticals & Medicine and Other Applications in USD Million
Chart 144: Glance at 2015, 2018 and 2024 Rest of Europe Ion Exchangers Market Share (%) by Application – Chemical, Dairy, Food & Beverages, Hydrometallurgy, Industrial & Municipal Water Treatment, Nuclear Waste Remediation, Pharmaceuticals & Medicine and Other Applications
ASIA-PACIFIC
Chart 145: Asia-Pacific Ion Exchangers Market Analysis (2015-2024) in USD Million
Chart 146: Asia-Pacific Ion Exchangers Market Analysis (2015-2024) by Geographic Region – China, India, Japan and Rest of Asia-Pacific in USD Million
Chart 147: Glance at 2015, 2018 and 2024 Asia-Pacific Ion Exchangers Market Share (%) by Region – China, India, Japan and Rest of Asia-Pacific
Chart 148: Asia-Pacific Ion Exchangers Market Analysis (2015-2024) by Type – Composite Ion Exchangers, Inorganic Ion Exchangers and Organic Ion Exchangers in USD Million
Chart 149: Glance at 2015, 2018 and 2024 Asia-Pacific Ion Exchangers Market Share (%) by Type – Composite Ion Exchangers, Inorganic Ion Exchangers and Organic Ion Exchangers
Chart 150: Asia-Pacific Inorganic Ion Exchangers Market Analysis (2015-2024) by Sub-Type – Zeolites and Other Inorganic Ion Exchangers in USD Million
Chart 151: Glance at 2015, 2018 and 2024 Asia-Pacific Inorganic Ion Exchangers Market Share (%) by Sub-Type – Zeolites and Other Inorganic Ion Exchangers
Chart 152: Asia-Pacific Organic Ion Exchangers Market Analysis (2015-2024) by Sub-Type – Amphoteric Ion Exchangers, Chelating Ion Exchangers, Strong Base Anion Exchangers, Weak Base Anion Exchangers, Strong Acid Cation Exchangers and Weak Acid Cation Exchangers in USD Million
Chart 153: Glance at 2015, 2018 and 2024 Asia-Pacific Organic Ion Exchangers Market Share (%) by Sub-Type – Amphoteric Ion Exchangers, Chelating Ion Exchangers, Strong Base Anion Exchangers, Weak Base Anion Exchangers, Strong Acid Cation Exchangers and Weak Acid Cation Exchangers
Chart 154: Asia-Pacific Ion Exchangers Market Analysis (2015-2024) by Application – Chemical, Dairy, Food & Beverages, Hydrometallurgy, Industrial & Municipal Water Treatment, Nuclear Waste Remediation, Pharmaceuticals & Medicine and Other Applications in USD Million
Chart 155: Glance at 2015, 2018 and 2024 Asia-Pacific Ion Exchangers Market Share (%) by Application – Chemical, Dairy, Food & Beverages, Hydrometallurgy, Industrial & Municipal Water Treatment, Nuclear Waste Remediation, Pharmaceuticals & Medicine and Other Applications
China
Chart 156: Chinese Ion Exchangers Market Analysis (2015-2024) in USD Million
Chart 157: Chinese Ion Exchangers Market Analysis (2015-2024) by Type – Composite Ion Exchangers, Inorganic Ion Exchangers and Organic Ion Exchangers in USD Million
Chart 158: Glance at 2015, 2018 and 2024 Chinese Ion Exchangers Market Share (%) by Type – Composite Ion Exchangers, Inorganic Ion Exchangers and Organic Ion Exchangers
Chart 159: Chinese Inorganic Ion Exchangers Market Analysis (2015-2024) by Sub-Type – Zeolites and Other Inorganic Ion Exchangers in USD Million
Chart 160: Glance at 2015, 2018 and 2024 Chinese Inorganic Ion Exchangers Market Share (%) by Sub-Type – Zeolites and Other Inorganic Ion Exchangers
Chart 161: Chinese Organic Ion Exchangers Market Analysis (2015-2024) by Sub-Type – Amphoteric Ion Exchangers, Chelating Ion Exchangers, Strong Base Anion Exchangers, Weak Base Anion Exchangers, Strong Acid Cation Exchangers and Weak Acid Cation Exchangers in USD Million
Chart 162: Glance at 2015, 2018 and 2024 Chinese Organic Ion Exchangers Market Share (%) by Sub-Type – Amphoteric Ion Exchangers, Chelating Ion Exchangers, Strong Base Anion Exchangers, Weak Base Anion Exchangers, Strong Acid Cation Exchangers and Weak Acid Cation Exchangers
Chart 163: Chinese Ion Exchangers Market Analysis (2015-2024) by Application – Chemical, Dairy, Food & Beverages, Hydrometallurgy, Industrial & Municipal Water Treatment, Nuclear Waste Remediation, Pharmaceuticals & Medicine and Other Applications in USD Million
Chart 164: Glance at 2015, 2018 and 2024 Chinese Ion Exchangers Market Share (%) by Application – Chemical, Dairy, Food & Beverages, Hydrometallurgy, Industrial & Municipal Water Treatment, Nuclear Waste Remediation, Pharmaceuticals & Medicine and Other Applications
India
Chart 165: Indian Ion Exchangers Market Analysis (2015-2024) in USD Million
Chart 166: Indian Ion Exchangers Market Analysis (2015-2024) by Type – Composite Ion Exchangers, Inorganic Ion Exchangers and Organic Ion Exchangers in USD Million
Chart 167: Glance at 2015, 2018 and 2024 Indian Ion Exchangers Market Share (%) by Type – Composite Ion Exchangers, Inorganic Ion Exchangers and Organic Ion Exchangers
Chart 168: Indian Inorganic Ion Exchangers Market Analysis (2015-2024) by Sub-Type – Zeolites and Other Inorganic Ion Exchangers in USD Million
Chart 169: Glance at 2015, 2018 and 2024 Indian Inorganic Ion Exchangers Market Share (%) by Sub-Type – Zeolites and Other Inorganic Ion Exchangers
Chart 170: Indian Organic Ion Exchangers Market Analysis (2015-2024) by Sub-Type – Amphoteric Ion Exchangers, Chelating Ion Exchangers, Strong Base Anion Exchangers, Weak Base Anion Exchangers, Strong Acid Cation Exchangers and Weak Acid Cation Exchangers in USD Million
Chart 171: Glance at 2015, 2018 and 2024 Indian Organic Ion Exchangers Market Share (%) by Sub-Type – Amphoteric Ion Exchangers, Chelating Ion Exchangers, Strong Base Anion Exchangers, Weak Base Anion Exchangers, Strong Acid Cation Exchangers and Weak Acid Cation Exchangers
Chart 172: Indian Ion Exchangers Market Analysis (2015-2024) by Application – Chemical, Dairy, Food & Beverages, Hydrometallurgy, Industrial & Municipal Water Treatment, Nuclear Waste Remediation, Pharmaceuticals & Medicine and Other Applications in USD Million
Chart 173: Glance at 2015, 2018 and 2024 Indian Ion Exchangers Market Share (%) by Application – Chemical, Dairy, Food & Beverages, Hydrometallurgy, Industrial & Municipal Water Treatment, Nuclear Waste Remediation, Pharmaceuticals & Medicine and Other Applications
Japan
Chart 174: Japanese Ion Exchangers Market Analysis (2015-2024) in USD Million
Chart 175: Japanese Ion Exchangers Market Analysis (2015-2024) by Type – Composite Ion Exchangers, Inorganic Ion Exchangers and Organic Ion Exchangers in USD Million
Chart 176: Glance at 2015, 2018 and 2024 Japanese Ion Exchangers Market Share (%) by Type – Composite Ion Exchangers, Inorganic Ion Exchangers and Organic Ion Exchangers
Chart 177: Japanese Inorganic Ion Exchangers Market Analysis (2015-2024) by Sub-Type – Zeolites and Other Inorganic Ion Exchangers in USD Million
Chart 178: Glance at 2015, 2018 and 2024 Japanese Inorganic Ion Exchangers Market Share (%) by Sub-Type – Zeolites and Other Inorganic Ion Exchangers
Chart 179: Japanese Organic Ion Exchangers Market Analysis (2015-2024) by Sub-Type – Amphoteric Ion Exchangers, Chelating Ion Exchangers, Strong Base Anion Exchangers, Weak Base Anion Exchangers, Strong Acid Cation Exchangers and Weak Acid Cation Exchangers in USD Million
Chart 180: Glance at 2015, 2018 and 2024 Japanese Organic Ion Exchangers Market Share (%) by Sub-Type – Amphoteric Ion Exchangers, Chelating Ion Exchangers, Strong Base Anion Exchangers, Weak Base Anion Exchangers, Strong Acid Cation Exchangers and Weak Acid Cation Exchangers
Chart 181: Japanese Ion Exchangers Market Analysis (2015-2024) by Application – Chemical, Dairy, Food & Beverages, Hydrometallurgy, Industrial & Municipal Water Treatment, Nuclear Waste Remediation, Pharmaceuticals & Medicine and Other Applications in USD Million
Chart 182: Glance at 2015, 2018 and 2024 Japanese Ion Exchangers Market Share (%) by Application – Chemical, Dairy, Food & Beverages, Hydrometallurgy, Industrial & Municipal Water Treatment, Nuclear Waste Remediation, Pharmaceuticals & Medicine and Other Applications
Rest of Asia-Pacific
Chart 183: Rest of Asia-Pacific Ion Exchangers Market Analysis (2015-2024) in USD Million
Chart 184: Rest of Asia-Pacific Ion Exchangers Market Analysis (2015-2024) by Type – Composite Ion Exchangers, Inorganic Ion Exchangers and Organic Ion Exchangers in USD Million
Chart 185: Glance at 2015, 2018 and 2024 Rest of Asia-Pacific Ion Exchangers Market Share (%) by Type – Composite Ion Exchangers, Inorganic Ion Exchangers and Organic Ion Exchangers
Chart 186: Rest of Asia-Pacific Inorganic Ion Exchangers Market Analysis (2015-2024) by Sub-Type – Zeolites and Other Inorganic Ion Exchangers in USD Million
Chart 187: Glance at 2015, 2018 and 2024 Rest of Asia-Pacific Inorganic Ion Exchangers Market Share (%) by Sub-Type – Zeolites and Other Inorganic Ion Exchangers
Chart 188: Rest of Asia-Pacific Organic Ion Exchangers Market Analysis (2015-2024) by Sub-Type – Amphoteric Ion Exchangers, Chelating Ion Exchangers, Strong Base Anion Exchangers, Weak Base Anion Exchangers, Strong Acid Cation Exchangers and Weak Acid Cation Exchangers in USD Million
Chart 189: Glance at 2015, 2018 and 2024 Rest of Asia-Pacific Organic Ion Exchangers Market Share (%) by Sub-Type – Amphoteric Ion Exchangers, Chelating Ion Exchangers, Strong Base Anion Exchangers, Weak Base Anion Exchangers, Strong Acid Cation Exchangers and Weak Acid Cation Exchangers
Chart 190: Rest of Asia-Pacific Ion Exchangers Market Analysis (2015-2024) by Application – Chemical, Dairy, Food & Beverages, Hydrometallurgy, Industrial & Municipal Water Treatment, Nuclear Waste Remediation, Pharmaceuticals & Medicine and Other Applications in USD Million
Chart 191: Glance at 2015, 2018 and 2024 Rest of Asia-Pacific Ion Exchangers Market Share (%) by Application – Chemical, Dairy, Food & Beverages, Hydrometallurgy, Industrial & Municipal Water Treatment, Nuclear Waste Remediation, Pharmaceuticals & Medicine and Other Applications
SOUTH AMERICA
Chart 192: South American Ion Exchangers Market Analysis (2015-2024) in USD Million
Chart 193: South American Ion Exchangers Market Analysis (2015-2024) by Geographic Region – Argentina, Brazil and Rest of South America in USD Million
Chart 194: Glance at 2015, 2018 and 2024 South American Ion Exchangers Market Share (%) by Region – Argentina, Brazil and Rest of South America
Chart 195: South American Ion Exchangers Market Analysis (2015-2024) by Type – Composite Ion Exchangers, Inorganic Ion Exchangers and Organic Ion Exchangers in USD Million
Chart 196: Glance at 2015, 2018 and 2024 South American Ion Exchangers Market Share (%) by Type – Composite Ion Exchangers, Inorganic Ion Exchangers and Organic Ion Exchangers
Chart 197: South American Inorganic Ion Exchangers Market Analysis (2015-2024) by Sub-Type – Zeolites and Other Inorganic Ion Exchangers in USD Million
Chart 198: Glance at 2015, 2018 and 2024 South American Inorganic Ion Exchangers Market Share (%) by Sub-Type – Zeolites and Other Inorganic Ion Exchangers
Chart 199: South American Organic Ion Exchangers Market Analysis (2015-2024) by Sub-Type – Amphoteric Ion Exchangers, Chelating Ion Exchangers, Strong Base Anion Exchangers, Weak Base Anion Exchangers, Strong Acid Cation Exchangers and Weak Acid Cation Exchangers in USD Million
Chart 200: Glance at 2015, 2018 and 2024 South American Organic Ion Exchangers Market Share (%) by Sub-Type – Amphoteric Ion Exchangers, Chelating Ion Exchangers, Strong Base Anion Exchangers, Weak Base Anion Exchangers, Strong Acid Cation Exchangers and Weak Acid Cation Exchangers
Chart 201: South American Ion Exchangers Market Analysis (2015-2024) by Application – Chemical, Dairy, Food & Beverages, Hydrometallurgy, Industrial & Municipal Water Treatment, Nuclear Waste Remediation, Pharmaceuticals & Medicine and Other Applications in USD Million
Chart 202: Glance at 2015, 2018 and 2024 South American Ion Exchangers Market Share (%) by Application – Chemical, Dairy, Food & Beverages, Hydrometallurgy, Industrial & Municipal Water Treatment, Nuclear Waste Remediation, Pharmaceuticals & Medicine and Other Applications
Argentina
Chart 203: Argentine Ion Exchangers Market Analysis (2015-2024) in USD Million
Chart 204: Argentine Ion Exchangers Market Analysis (2015-2024) by Type – Composite Ion Exchangers, Inorganic Ion Exchangers and Organic Ion Exchangers in USD Million
Chart 205: Glance at 2015, 2018 and 2024 Argentine Ion Exchangers Market Share (%) by Type – Composite Ion Exchangers, Inorganic Ion Exchangers and Organic Ion Exchangers
Chart 206: Argentine Inorganic Ion Exchangers Market Analysis (2015-2024) by Sub-Type – Zeolites and Other Inorganic Ion Exchangers in USD Million
Chart 207: Glance at 2015, 2018 and 2024 Argentine Inorganic Ion Exchangers Market Share (%) by Sub-Type – Zeolites and Other Inorganic Ion Exchangers
Chart 208: Argentine Organic Ion Exchangers Market Analysis (2015-2024) by Sub-Type – Amphoteric Ion Exchangers, Chelating Ion Exchangers, Strong Base Anion Exchangers, Weak Base Anion Exchangers, Strong Acid Cation Exchangers and Weak Acid Cation Exchangers in USD Million
Chart 209: Glance at 2015, 2018 and 2024 Argentine Organic Ion Exchangers Market Share (%) by Sub-Type – Amphoteric Ion Exchangers, Chelating Ion Exchangers, Strong Base Anion Exchangers, Weak Base Anion Exchangers, Strong Acid Cation Exchangers and Weak Acid Cation Exchangers
Chart 210: Argentine Ion Exchangers Market Analysis (2015-2024) by Application – Chemical, Dairy, Food & Beverages, Hydrometallurgy, Industrial & Municipal Water Treatment, Nuclear Waste Remediation, Pharmaceuticals & Medicine and Other Applications in USD Million
Chart 211: Glance at 2015, 2018 and 2024 Argentine Ion Exchangers Market Share (%) by Application – Chemical, Dairy, Food & Beverages, Hydrometallurgy, Industrial & Municipal Water Treatment, Nuclear Waste Remediation, Pharmaceuticals & Medicine and Other Applications
Brazil
Chart 212: Brazilian Ion Exchangers Market Analysis (2015-2024) in USD Million
Chart 213: Brazilian Ion Exchangers Market Analysis (2015-2024) by Type – Composite Ion Exchangers, Inorganic Ion Exchangers and Organic Ion Exchangers in USD Million
Chart 214: Glance at 2015, 2018 and 2024 Brazilian Ion Exchangers Market Share (%) by Type – Composite Ion Exchangers, Inorganic Ion Exchangers and Organic Ion Exchangers
Chart 215: Brazilian Inorganic Ion Exchangers Market Analysis (2015-2024) by Sub-Type – Zeolites and Other Inorganic Ion Exchangers in USD Million
Chart 216: Glance at 2015, 2018 and 2024 Brazilian Inorganic Ion Exchangers Market Share (%) by Sub-Type – Zeolites and Other Inorganic Ion Exchangers
Chart 217: Brazilian Organic Ion Exchangers Market Analysis (2015-2024) by Sub-Type – Amphoteric Ion Exchangers, Chelating Ion Exchangers, Strong Base Anion Exchangers, Weak Base Anion Exchangers, Strong Acid Cation Exchangers and Weak Acid Cation Exchangers in USD Million
Chart 218: Glance at 2015, 2018 and 2024 Brazilian Organic Ion Exchangers Market Share (%) by Sub-Type – Amphoteric Ion Exchangers, Chelating Ion Exchangers, Strong Base Anion Exchangers, Weak Base Anion Exchangers, Strong Acid Cation Exchangers and Weak Acid Cation Exchangers
Chart 219: Brazilian Ion Exchangers Market Analysis (2015-2024) by Application – Chemical, Dairy, Food & Beverages, Hydrometallurgy, Industrial & Municipal Water Treatment, Nuclear Waste Remediation, Pharmaceuticals & Medicine and Other Applications in USD Million
Chart 220: Glance at 2015, 2018 and 2024 Brazilian Ion Exchangers Market Share (%) by Application – Chemical, Dairy, Food & Beverages, Hydrometallurgy, Industrial & Municipal Water Treatment, Nuclear Waste Remediation, Pharmaceuticals & Medicine and Other Applications
Rest of South America
Chart 221: Rest of South American Ion Exchangers Market Analysis (2015-2024) in USD Million
Chart 222: Rest of South American Ion Exchangers Market Analysis (2015-2024) by Type – Composite Ion Exchangers, Inorganic Ion Exchangers and Organic Ion Exchangers in USD Million
Chart 223: Glance at 2015, 2018 and 2024 Rest of South American Ion Exchangers Market Share (%) by Type – Composite Ion Exchangers, Inorganic Ion Exchangers and Organic Ion Exchangers
Chart 224: Rest of South American Inorganic Ion Exchangers Market Analysis (2015-2024) by Sub-Type – Zeolites and Other Inorganic Ion Exchangers in USD Million
Chart 225: Glance at 2015, 2018 and 2024 Rest of South American Inorganic Ion Exchangers Market Share (%) by Sub-Type – Zeolites and Other Inorganic Ion Exchangers
Chart 226: Rest of South American Organic Ion Exchangers Market Analysis (2015-2024) by Sub-Type – Amphoteric Ion Exchangers, Chelating Ion Exchangers, Strong Base Anion Exchangers, Weak Base Anion Exchangers, Strong Acid Cation Exchangers and Weak Acid Cation Exchangers in USD Million
Chart 227: Glance at 2015, 2018 and 2024 Rest of South American Organic Ion Exchangers Market Share (%) by Sub-Type – Amphoteric Ion Exchangers, Chelating Ion Exchangers, Strong Base Anion Exchangers, Weak Base Anion Exchangers, Strong Acid Cation Exchangers and Weak Acid Cation Exchangers
Chart 228: Rest of South American Ion Exchangers Market Analysis (2015-2024) by Application – Chemical, Dairy, Food & Beverages, Hydrometallurgy, Industrial & Municipal Water Treatment, Nuclear Waste Remediation, Pharmaceuticals & Medicine and Other Applications in USD Million
Chart 229: Glance at 2015, 2018 and 2024 Rest of South American Ion Exchangers Market Share (%) by Application – Chemical, Dairy, Food & Beverages, Hydrometallurgy, Industrial & Municipal Water Treatment, Nuclear Waste Remediation, Pharmaceuticals & Medicine and Other Applications
REST OF WORLD
Chart 230: Rest of World Ion Exchangers Market Analysis (2015-2024) in USD Million
Chart 231: Rest of World Ion Exchangers Market Analysis (2015-2024) by Type – Composite Ion Exchangers, Inorganic Ion Exchangers and Organic Ion Exchangers in USD Million
Chart 232: Glance at 2015, 2018 and 2024 Rest of World Ion Exchangers Market Share (%) by Type – Composite Ion Exchangers, Inorganic Ion Exchangers and Organic Ion Exchangers
Chart 233: Rest of World Inorganic Ion Exchangers Market Analysis (2015-2024) by Sub-Type – Zeolites and Other Inorganic Ion Exchangers in USD Million
Chart 234: Glance at 2015, 2018 and 2024 Rest of World Inorganic Ion Exchangers Market Share (%) by Sub-Type – Zeolites and Other Inorganic Ion Exchangers
Chart 235: Rest of World Organic Ion Exchangers Market Analysis (2015-2024) by Sub-Type – Amphoteric Ion Exchangers, Chelating Ion Exchangers, Strong Base Anion Exchangers, Weak Base Anion Exchangers, Strong Acid Cation Exchangers and Weak Acid Cation Exchangers in USD Million
Chart 236: Glance at 2015, 2018 and 2024 Rest of World Organic Ion Exchangers Market Share (%) by Sub-Type – Amphoteric Ion Exchangers, Chelating Ion Exchangers, Strong Base Anion Exchangers, Weak Base Anion Exchangers, Strong Acid Cation Exchangers and Weak Acid Cation Exchangers
Chart 237: Rest of World Ion Exchangers Market Analysis (2015-2024) by Application – Chemical, Dairy, Food & Beverages, Hydrometallurgy, Industrial & Municipal Water Treatment, Nuclear Waste Remediation, Pharmaceuticals & Medicine and Other Applications in USD Million
Chart 238: Glance at 2015, 2018 and 2024 Rest of World Ion Exchangers Market Share (%) by Application – Chemical, Dairy, Food & Beverages, Hydrometallurgy, Industrial & Municipal Water Treatment, Nuclear Waste Remediation, Pharmaceuticals & Medicine and Other Applications
Tables & Figures:
Tables:
Table 1: Different Methods of Separation
Table 2: Common Applications of Zeolites as Ion Exchangers
Table 3: Layered Materials
Table 4: Two-Component Ion Exchange Materials and their Properties
Table 5: Three-Component Ion Exchange Materials and their Properties
Table 6: Classification of Organic Ion Exchangers
Table 7: Types of Organic Ion Exchangers and their Functional Groups
Table 8: Some Chelating Acid and Base Functional Groups
Table 9: A General Comparison between Organic and Inorganic Ion Exchangers
Table 10: Select Applications of Ion Exchangers
Figures:
Figure 1: The two major types of ion exchange sites. (A) Type 1, structure-terminating and defect groups; (B) Type 2, charge-compensating groups. M is an oxide-forming metal with oxidation state 4; T is an oxide-forming metal with oxidation state 3. The regions enclosed in dotted lines are those giving rise to ion exchange where Z# (or Z}O) is exchangeable. Shaded areas represent a continuation of the oxidic network.
Figure 2: The principal reasons for limitations to ion exchange reactions found in zeolites. (A) Ion-sieving; (B) Volume exclusion; (C) Low charge density (with multivalent cations). The lightly shaded regions represent an extract of the zeolite framework. For clarity, only ingoing cations are shown.
Figure 3: Preparation of Sulfonated Phenol-Formaldehyde Cation Exchangers
Figure 4: Chemical Structure of Sulfonated Styrene-DVB Copolymer-Based Cation Exchanger
Figure 5: Some Methods for the Preparation of Weak Acid Cation Exchangers
Figure 6: Classical Structures of the Structural Units of Type I and Type II Strong Base Anion Exchangers
Figure 7: The Two Cross-Linked Polystyrene-Based Chloromethylated Structures
Figure 8: Hofmann Degradation of Type I and Type II Strong Base Anion Exchangers
Figure 9: Preparation of an Acrylic Strong Base Anion Exchanger
Figure 10: Preparation of Strong Base Anion Exchangers Based on 4-Vinylpyridine-DVB Copolymer
Figure 11: Preparation Methods of Phosphonium-Type Strong Base Anion Exchangers
Figure 12: Chemical Structure of m-Phenylenediamine-Formaldehyde Weak Base Anion Exchanger
Figure 13: Chemical Structure of an Epoxy-Type Base Anion Exchanger
Figure 14: Chemical Structure of the Functional Groups that can exist in a Polystyrene-Based Weak Base Anion Exchanger
Figure 15: Acrylic-Type Weak Base Anion Exchangers and their Preparation Methods
Figure 16: Preparation of an Acrylic-Type Weak Base Anion Exchanger from Acrylonitrile-DVB Copolymer
Figure 17: Classical Binding of metal Cations by some Chelating Functional Groups. (P is a polymer structure unit that contains an acid or base group)
Figure 18: Chemical Structure Dependence of Amine and Isothiouronium Groups on the pH of Aqueous Medium
Albemarle Corporation
ALDEX Chemical Company, Ltd.
Anhui Mingmei Minchem Co., Ltd.
Anhui Sanxing Resin Technology Co., Ltd.
Anten Chemical Co., Ltd.
Arkema Group
Bariteworld
BASF SE
Bio-Rad Laboratories Inc.
Blue Pacific Minerals
Clariant AG
Eurecat S.A.
Evoqua Water Technologies LLC
Finex OY
Grupo Coypus S.A. De C.V.
Gujarat Credo Mineral Industries Ltd
Honeywell International Inc.
Ida-Ore Zeolite
Imerys Metallurgy Division
Incal Mineral G�bre Ve Yem San. Ltd.
Ion Exchange (India) Limited
Jacobi Carbons AB
Jiangsu Linhai Resin Science and Technology Co., Ltd
KNT Group
Lanxess AG
MEC Energy, Mining, Construction Ind. and Trade Co.
Mitsubishi Chemical Holdings Corporation
Molecular Products Group Ltd
National Aluminium Company Limited
Ningbo Zhengguang Resin Co., Ltd.
Novasep, LLC
Ovivo Inc.
PQ Corporation
Progressive Planet Solutions Inc.
Purolite Corporation
Resintech, Inc.
Rota Madencilik AS - Rota Mining Corporation
Samyang Corporation
Sawyer Technical Materials, LLC
St. Cloud Mining Company
Sunresin New Materials Co. Ltd
Teague Mineral Products
The Dow Chemical Company
Thermax Global
Tianjin Nankai Hecheng Science & Technology Co., Ltd (Hecheng)
Tosoh Corporation
Union Showa Corporation (Union Showa KK)
W.R. Grace & Co
ZEO, Inc.
Zeocat Soluciones Ecol�gicas S.L.U.
Zeocem, A.S.
Zeochem AG
Zeotech Corporation
ZMM� Canada Minerals Corp.
RELATED REPORTS
Polyamides (PA6, PA66) - A Global Market Overview
Report Code: CHM112 | Pages: 274 | Price: $4500
Published
Jul 2026
Polymethyl Methacrylate (PMMA) - A Global Market Overview
Report Code: CHM113 | Pages: 247 | Price: $4500
Published
Jul 2026
Polyoxymethylene (POM or Polyacetal) - A Global Market Overview
Report Code: CHM114 | Pages: 245 | Price: $4500
Published
Jul 2026
Polybutylene Terephthalate (PBT) - A Global Market Overview
Report Code: CHM115 | Pages: 224 | Price: $4500
Published
Jul 2026
Modified Polyphenylene Ether (mPPE) - A Global Market Overview
Report Code: CHM116 | Pages: 195 | Price: $4050
Published
Jul 2026