Global High Performance Polyamides (HPPA) Market Trends and Outlook
The global High Performance Polyamides (HPPA) market reached US$2.6 billion in 2025, reflecting the growing adoption of advanced engineering polymers in applications requiring superior thermal stability, chemical resistance, and mechanical performance. High performance polyamides bridge the gap between conventional engineering plastics and high-performance polymers, offering improved dimensional stability and durability in demanding operating environments. These materials are increasingly used in automotive systems, electronic components, and industrial machinery where conventional polyamides such as PA6 and PA66 cannot meet long-term performance requirements.
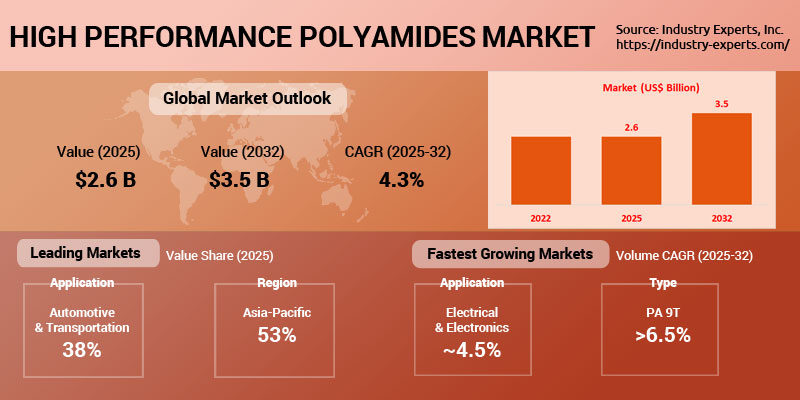
The market is projected to expand steadily to 313 thousand metric tons by 2032, while value is expected to reach US$3.5 billion, representing CAGR of 4.3% in value during 2025-2032. Growth is supported by increasing lightweight material adoption in automotive manufacturing, particularly in electrified vehicles, as well as expanding use in electrical and electronic components that require high temperature resistance and dimensional stability. Additionally, high performance polyamides are gaining traction in industrial applications where durability, wear resistance, and chemical stability are critical. Long-term market expansion is also driven by trends such as the miniaturization of electronic devices, increasing replacement of metals with high-performance polymers, and growing demand for materials capable of operating in extreme environments.
Major companies operating in the High Performance Polyamides market include Arkema Group, BASF SE, Celanese Corporation, EMS-CHEMIE AG, Evonik Industries AG, Envalior GmbH, Syensqo SA, Mitsubishi Gas Chemical Co. Ltd., Mitsui Chemicals, Inc., and Ube Industries, Ltd.
Iran War Impact: "Recent geopolitical developments involving Iran have introduced a degree of uncertainty into global petrochemical markets, which may have downstream implications for the high-performance polyamides (HPPA) sector. Materials such as PA11, PA12, PPA, PA46, PA9T, and PARA/PAMXD6 depend on a combination of aromatic intermediates, butadiene derivatives, and energy-intensive processing, making the market sensitive to fluctuations in crude oil prices, petrochemical feedstock availability, and regional shipping conditions. While some grades such as PA11 are bio-based, their production and distribution remain linked to global energy and logistics networks. At present, the situation remains fluid, and it is too early to determine the precise impact on the 2026 market outlook. Our analysts are closely monitoring developments in energy markets, petrochemical trade flows, and supply chain dynamics to assess potential implications for the high-performance polyamides value chain."
High Performance Polyamides (HPPA) Regional Market Analysis
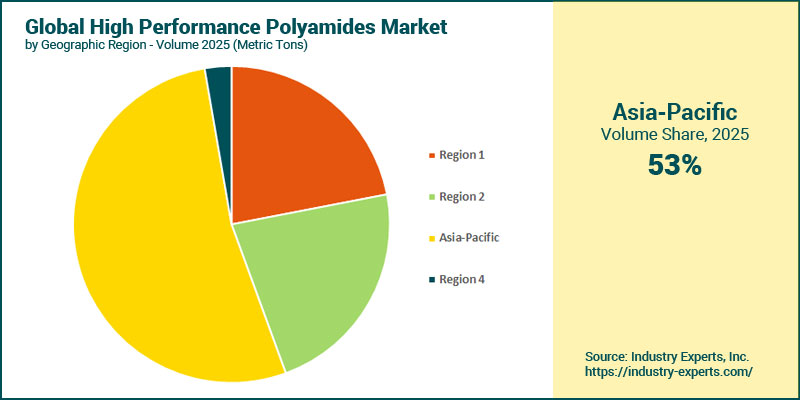
Asia-Pacific dominates the High Performance Polyamides (HPPA) market, accounting for 52.9% of global consumption in 2025, supported by strong automotive manufacturing, expanding electronics production, and rising demand for advanced engineering plastics across China and other emerging Asian economies. The region is also the fastest growing market, projected to expand at a CAGR of 4.7% during 2025-2032, reaching 175 thousand metric tons by 2032, driven by continued industrialization, electronics manufacturing growth, and increasing automotive production. Europe ranks as the second largest market, closely followed by the United States with 22% share, reflecting strong adoption of high performance polyamides in automotive, industrial, and high-end electronics applications. The United States and Europe are expected to grow at comparatively moderate rates, reflecting more mature markets where demand is driven primarily by technological upgrades, vehicle electrification, and replacement of metals with advanced engineering polymers.
High Performance Polyamides (HPPA) Market Analysis by Polyamide Type
By polyamide type, PA 11 & 12 dominate the High Performance Polyamides (HPPA) market, accounting for 48.6% of global consumption in 2025, reflecting their wide adoption across automotive fuel systems, pneumatic tubing, industrial components, and increasingly additive manufacturing applications. Polyphthalamide (PPA) (based on Polyamide 6T) ranks as the second largest segment in 2025, driven by their superior heat resistance and dimensional stability in high-temperature automotive and electronic components. In terms of growth, Polyamide 9T (PA 9T) is projected to be the fastest growing polyamide type, expanding at a CAGR of 6.6% during 2025-2032, reaching 21 thousand metric tons by 2032. Growth in PA 9T consumption is primarily driven by expanding use in automotive applications, followed by electrical & electronics, where high heat resistance, low moisture absorption, and dimensional stability are critical for connectors, high-temperature electronic housings, and advanced automotive components.
High Performance Polyamides (HPPA) Market Analysis by End-use Sector
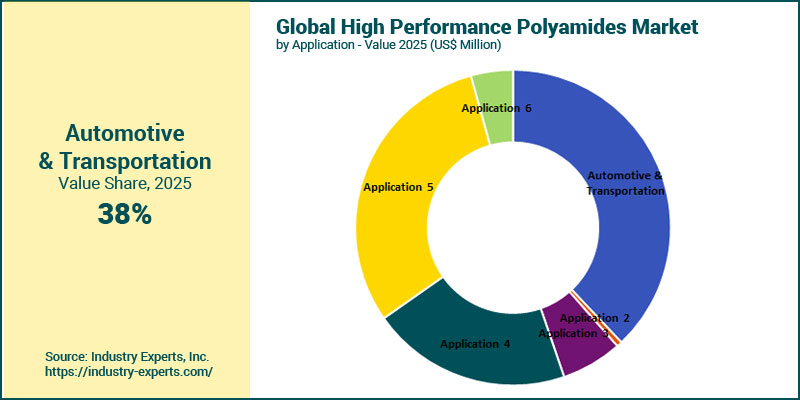
By end-use sector, Automotive & Transportation represents the largest application for High Performance Polyamides (HPPA), accounting for 38% of global demand in 2025, generating US$988.8 million. The segment is projected to reach US$1.4 billion by 2032, supported by increasing adoption of high temperature and chemically resistant polymers in under-the-hood components, fuel systems, connectors, and thermal management components in electric vehicles. Mechanical/Industrial ranks as the second largest segment, driven by applications such as gears, bearings, pumps, and precision industrial components that require high wear resistance and dimensional stability. In terms of growth, Electrical & Electronics is the fastest expanding sector, reaching 77 thousand metric tons and US$750.9 million by 2032, reflecting CAGR of 5% in value, supported by increasing demand for heat-resistant polymers in connectors, switches, and miniaturized electronic assemblies. Automotive & Transportation follows closely as the second fastest growing segment, with 4.8% value CAGR.
High Performance Polyamides (HPPA) Market Report Scope
This global report on High Performance Polyamides (HPPA) analyzes the market based on polyamide type and end-use sector for the period 2022-2032 with projections from 2025 to 2032 in terms of volume in metric tons and value in US$. In addition to providing profiles of major companies operating in the HPPA industry, the latest corporate, product and industrial developments have been covered to offer a clear panorama of High Performance Polyamides (HPPA) industry.
Key Metrics
| Historical Period: | 2022-2025 | |
| Base Year: | 2025 | |
| Forecast Period: | 2025-2032 | |
| Units: | Volume consumption in Metric Tons and Value market in US$ | |
| Companies Mentioned: | 19 |
Global High Performance Polyamides (HPPA) Market by Geographic Region
- The United States
- Europe (France, Germany, Italy, The United Kingdom and other countries)
- Asia-Pacific (China, Japan, India, South Korea and Rest of Asia-Pacific)
- Rest of World
Global High Performance Polyamides (HPPA) Market by Polyamide Type
- Polyamide 11 (PA 11)
- Polyamide 12 (PA 12)
- Polyphthalamide (PPA) or Modified Polyamide 6T (PA 6T)
- Polyamide 46 (PA 46)
- Polyarylamide (PARA) or Polyamide MXD6 (PA MXD6)
- Polyamide 9T (PA9T)
Global High Performance Polyamides (HPPA) Market by End-Use Application
- Automotive & Transportation
- Building & Construction
- Consumer Goods
- Electrical & Electronics
- Mechanical/Industrial
- Other Sectors (include textiles, medical etc.)
High Performance Polyamides (HPPA) Market Frequently Asked Questions (FAQs)
High Performance Polyamides are advanced engineering polymers designed to withstand high temperatures, chemical exposure, and mechanical stress, offering superior performance compared with conventional polyamides such as PA6 and PA66.
The global HPPA market was valued at US$2.6 billion in 2025 and is projected to reach US$3.5 billion by 2032.
Major demand comes from automotive, electrical & electronics, and mechanical/industrial sectors, where materials must perform reliably under demanding conditions.
Key polyamide types include PA 11 & 12, PPA/PA 6T, PA 46, PA 9T, and PARA/PA MXD6.
They offer lightweight strength, heat resistance, chemical durability, and dimensional stability, making them suitable for replacing metal components and conventional plastics in automotive systems.
Asia-Pacific leads the global market, supported by strong automotive production, electronics manufacturing, and expanding industrial activity.
Growth will be supported by vehicle electrification, miniaturization of electronics, increasing use of lightweight materials, and expanding industrial applications requiring high-performance engineering polymers.
PART A: GLOBAL MARKET PERSPECTIVE
1. INTRODUCTION
- Product Outline
- High Performance Polyamides
- Polyamide 11 (PA 11)
- Polyamide 11 Applications
- Polyamide 12 (PA 12)
- Polyamide 12 Applications
- Polyamide 46 (PA 46)
- Polyamide 46 Applications
- Polyarylamide (PARA) or Polyamide MXD6 (PA MXD6)
- Polyarylamide or Polyamide MXD6 Applications
- Polyphthalamide (PPA)
- Polyphthalamide Applications
- Polyamide 9T (PA9T)
- Polyamide 9T Applications
- End-Use Sector Analysis � A Global Snapshot
- Automotive
- Building & Construction
- Consumer Goods
- Electrical & Electronics
- Mechanical/Industrial
- Other Sectors
- Key Market Trends & Growth Drivers
2. INDUSTRY LANDSCAPE
- High Performance Polyamide Production Capacities
- Polyamide 12
- Polyarylamide/Polyamide MXD6
- Polyamide 11
- Polyamide 9T
- Polyamide 46
- Polyphthalamide/Polyamide 6T
- Key Global Players
- Arkema Group
- BASF SE
- Celanese Corporation
- Chongqing Wote Zhicheng New Materials Technology Co., Ltd.
- EMS-CHEMIE AG
- Envalior GmbH
- Evonik Industries AG
- Guangdong Youju Advanced New Materials Co., Ltd.
- Jiangmen Dezhongtai (DZT) Engineering Plastic Technology Co., Ltd.
- Kingfa Sci.&Tech. Co.,Ltd.
- Kuraray Co Ltd
- Mitsubishi Gas Chemical Co. Ltd
- Mitsui Chemicals, Inc.
- Shandong Dongchen New Technology Co ,Ltd
- Shandong Guangyin New Materials Co., Ltd
- Syensqo SA
- Toyobo Co. Ltd
- Ube Industries, Ltd.
- Zhejiang NHU Special Material Co., Ltd.
3. KEY BUSINESS & PRODUCT TRENDS
4. GLOBAL MARKET OVERVIEW
- Global High Performance Polyamides Market Overview by End-use Sector
- High Performance Polyamides End-use Sector Market Overview by Global Region
- Automotive
- Electrical & Electronics
- Mechanical/Industrial
- Other Sectors
- Global High Performance Polyamides Market Overview by Polyamide Type
- Polyamide 11 & 12
- Global Polyamide 11 & 12 Market Overview by Type
- Polyamide 11 & 12 Market Overview by Global Region
- Global Polyamide 11 & 12 Market Overview by End-use Sector
- Polyphthalamide/Polyamide 6T
- Polyphthalamide/Polyamide 6T Market Overview by Global Region
- Global Polyphthalamide/Polyamide 6T Market Overview by End-use Sector
- Polyamide 46
- Polyamide 46 (PA 46) Market Overview by Global Region
- Global Polyamide 46 Market Overview by End-use Sector
- Polyamide 9T
- Polyamide 9T Market Overview by Global Region
- Global Polyamide 9T Market Overview by End-use Sector
- Polyarylamide/Polyamide MXD6
- Polyarylamide/Polyamide MXD6 Market Overview by Global Region
- Global Polyarylamide/Polyamide MXD6 Market Overview by End-use Sector
PART B: REGIONAL MARKET PERSPECTIVE
- High Performance Polyamides Market Overview by Geographic Region
REGIONAL MARKET OVERVIEW
5. THE UNITED STATES
- United States High Performance Polyamides Market Overview by End-use Sector
- United States High Performance Polyamides Market Overview by Polyamide Type
- Polyamide 11 & 12
- United States Polyamide 11 & 12 Market Overview by Type
- United States Polyamide 11 & 12 Market Overview by End-use Sector
- Polyphthalamide/Polyamide 6T
- United States Polyphthalamide/Polyamide 6T Market Overview by End-use Sector
- Polyamide 46
- United States Polyamide 46 Market Overview by End-use Sector
- Polyamide 9T
- United States Polyamide 9T Market Overview by End-use Sector
- Polyarylamide/Polyamide MXD6
- United States Polyarylamide/Polyamide MXD6 Market Overview by End-use Sector
6. EUROPE
- High Performance Polyamides Market Overview by European Region
- European High Performance Polyamides Market Overview by End-use Sector
- European High Performance Polyamides Market Overview by Polyamide Type
- Polyamide 11 & 12
- European Polyamide 11 & 12 Market Overview by Type
- Polyamide 11 & 12 Market Overview by European Region
- European Polyamide 11 & 12 Market Overview by End-use Sector
- Polyphthalamide/Polyamide 6T
- Polyphthalamide/Polyamide 6T Market Overview by European Region
- European Polyphthalamide/Polyamide 6T Market Overview by End-use Sector
- Polyamide 46
- Polyamide 46 Market Overview by European Region
- European Polyamide 46 Market Overview by End-use Sector
- Polyamide 9T
- Polyamide 9T Market Overview by European Region
- European Polyamide 9T Market Overview by End-use Sector
- Polyarylamide/Polyamide MXD6
- Polyarylamide/Polyamide MXD6 Market Overview by European Region
- European Polyarylamide/Polyamide MXD6 Market Overview by End-use Sector
- European High Performance Polyamides Market Overview by Country
- France
- French High Performance Polyamides Market Overview by End-use Sector
- French High Performance Polyamides Market Overview by Polyamide Type
- Polyamide 11 & 12
- French Polyamide 11 & 12 (PA 11 & 12) Market Overview by Type
- French Polyamide 11 & 12 Market Overview by End-use Sector
- Polyphthalamide/Polyamide 6T
- French Polyphthalamide/Polyamide 6T Market Overview by End-use Sector
- Polyamide 46
- French Polyamide 46 Market Overview by End-use Sector
- Polyamide 9T
- French Polyamide 9T Market Overview by End-use Sector
- Polyarylamide/Polyamide MXD6
- French Polyarylamide/Polyamide MXD6 Market Overview by End-use Sector
- Germany
- German High Performance Polyamides Market Overview by End-use Sector
- German High Performance Polyamides Market Overview by Polyamide Type
- Polyamide 11 & 12
- German Polyamide 11 & 12 Market Overview by Type
- German Polyamide 11 & 12 Market Overview by End-use Sector
- Polyphthalamide/Polyamide 6T
- German Polyphthalamide/Polyamide 6T Market Overview by End-use Sector
- Polyamide 46
- German Polyamide 46 Market Overview by End-use Sector
- Polyamide 9T
- German Polyamide 9T Market Overview by End-use Sector
- Polyarylamide/Polyamide MXD6
- German Polyarylamide/Polyamide MXD6 Market Overview by End-use Sector
- Italy
- Italian High Performance Polyamides Market Overview by End-use Sector
- Italian High Performance Polyamides Market Overview by Polyamide Type
- Polyamide 11 & 12
- Italian Polyamide 11 & 12 Market Overview by Type
- Italian Polyamide 11 & 12 Market Overview by End-use Sector
- Polyphthalamide/Polyamide 6T
- Italian Polyphthalamide/Polyamide 6T Market Overview by End-use Sector
- Polyamide 46
- Italian Polyamide 46 Market Overview by End-use Sector
- Polyamide 9T
- Italian Polyamide 9T Market Overview by End-use Sector
- Polyarylamide/Polyamide MXD6
- Italian Polyarylamide/Polyamide MXD6 Market Overview by End-use Sector
- The United Kingdom
- UK High Performance Polyamides Market Overview by End-use Sector
- UK High Performance Polyamides Market Overview by Polyamide Type
- Polyamide 11 & 12
- UK Polyamide 11 & 12 Market Overview by Type
- UK Polyamide 11 & 12 Market Overview by End-use Sector
- Polyphthalamide/Polyamide 6T
- UK Polyphthalamide/Polyamide 6T Market Overview by End-use Sector
- Polyamide 46
- UK Polyamide 46 Market Overview by End-use Sector
- Polyamide 9T
- Polyarylamide/Polyamide MXD6
- UK Polyarylamide/Polyamide MXD6 Market Overview by End-use Sector
- Rest of Europe
- Rest of Europe High Performance Polyamides Market Overview by End-use Sector
- Rest of Europe High Performance Polyamides Market Overview by Polyamide Type
- Polyamide 11 & 12
- Rest of Europe Polyamide 11 & 12 Market Overview by Type
- Rest of Europe Polyamide 11 & 12 Market Overview by End-use Sector
- Polyphthalamide/Polyamide 6T
- Rest of Europe Polyphthalamide/Polyamide 6T Market Overview by End-use Sector
- Polyamide 46
- Rest of Europe Polyamide 46 Market Overview by End-use Sector
- Polyamide 9T
- Rest of Europe Polyamide 9T Market Overview by End-use Sector
- Polyarylamide/Polyamide MXD6
- Rest of Europe Polyarylamide/Polyamide MXD6 Market Overview by End-use Sector
7. ASIA-PACIFIC
- High Performance Polyamides Market Overview by Geographic Region
- Asia-Pacific High Performance Polyamides Market Overview by End-use Sector
- Asia-Pacific High Performance Polyamides Market Overview by Polyamide Type
- Polyamide 11 & 12
- Asia-Pacific Polyamide 11 & 12 Market Overview by Type
- Polyamide 11 & 12 Market Overview by Asia-Pacific Region
- Asia-Pacific Polyamide 11 & 12 Market Overview by End-use Sector
- Polyphthalamide/Polyamide 6T
- Polyphthalamide/Polyamide 6T Market Overview by Asia-Pacific Region
- Asia-Pacific Polyphthalamide (PPA)/Polyamide 6T (PA 6T) Market Overview by End-use Sector
- Polyamide 46
- Polyamide 46 Market Overview by Asia-Pacific Region
- Asia-Pacific Polyamide 46 (PA 46) Market Overview by End-use Sector
- Polyamide 9T
- Polyamide 9T Market Overview by Asia-Pacific Region
- Asia-Pacific Polyamide 9T Market Overview by End-use Sector
- Polyarylamide /Polyamide MXD6
- Polyarylamide/Polyamide MXD6 Market Overview by Asia-Pacific Region
- Asia-Pacific Polyarylamide (PARA)/Polyamide MXD6 (PA MXD6) Market Overview by End-use Sector
- Asia-Pacific High Performance Polyamides Market Overview by Country
- China
- Chinese High Performance Polyamides Market Overview by End-use Sector
- Chinese High Performance Polyamides Market Overview by Polyamide Type
- Polyamide 11 & 12
- Chinese Polyamide 11 & 12 Market Overview by Type
- Chinese Polyamide 11 & 12 Market Overview by End-use Sector
- Polyphthalamide/Polyamide 6T
- Chinese Polyphthalamide/Polyamide 6T Market Overview by End-use Sector
- Polyamide 46
- Chinese Polyamide 46 Market Overview by End-use Sector
- Polyamide 9T
- Chinese Polyamide 9T Market Overview by End-use Sector
- Polyarylamide/Polyamide MXD6
- Chinese Polyarylamide/Polyamide MXD6 Market Overview by End-use Sector
- India
- Indian High Performance Polyamides Market Overview by End-use Sector
- Indian High Performance Polyamides Market Overview by Polyamide Type
- Polyamide 11 & 12
- Indian Polyamide 11 & 12 Market Overview by Type
- Indian Polyamide 11 & 12 Market Overview by End-use Sector
- Polyphthalamide/Polyamide 6T
- Indian Polyphthalamide/Polyamide 6T Market Overview by End-use Sector
- Polyamide 46
- Indian Polyamide 46 Market Overview by End-use Sector
- Polyamide 9T
- Polyarylamide/Polyamide MXD6
- Indian Polyarylamide/Polyamide MXD6 Market Overview by End-use Sector
- Japan
- Japanese High Performance Polyamides Market Overview by End-use Sector
- Japanese High Performance Polyamides Market Overview by Polyamide Type
- Polyamide 11 & 12
- Japanese Polyamide 11 & 12 Market Overview by Type
- Japanese Polyamide 11 & 12 Market Overview by End-use Sector
- Polyphthalamide/Polyamide 6T
- Japanese Polyphthalamide/Polyamide 6T Market Overview by End-use Sector
- Polyamide 46
- Japanese Polyamide 46 Market Overview by End-use Sector
- Polyamide 9T
- Japanese Polyamide 9T Market Overview by End-use Sector
- Polyarylamide/Polyamide MXD6
- Japanese Polyarylamide/Polyamide MXD6 Market Overview by End-use Sector
- South Korea
- South Korean High Performance Polyamides Market Overview by End-use Sector
- South Korean High Performance Polyamides Market Overview by Polyamide Type
- Polyamide 11 & 12
- South Korean Polyamide 11 & 12 Market Overview by Type
- South Korean Polyamide 11 & 12 Market Overview by End-use Sector
- Polyphthalamide/Polyamide 6T
- South Korean Polyphthalamide/Polyamide 6T Market Overview by End-use Sector
- Polyamide 46
- South Korean Polyamide 46 Market Overview by End-use Sector
- Polyamide 9T
- South Korean Polyamide 9T Market Overview by End-use Sector
- Polyarylamide/Polyamide MXD6
- South Korean Polyarylamide/Polyamide MXD6 Market Overview by End-use Sector
- Rest of APAC
- Rest of APAC High Performance Polyamides Market Overview by End-use Sector
- Rest of APAC High Performance Polyamides Market Overview by Polyamide Type
- Polyamide 11 & 12
- Rest of APAC Polyamide 11 & 12 Market Overview by Type
- Rest of APAC Polyamide 11 & 12 Market Overview by End-use Sector
- Polyphthalamide/Polyamide 6T
- Rest of APAC Polyphthalamide/Polyamide 6T Market Overview by End-use Sector
- Polyamide 46
- Rest of APAC Polyamide 46 Market Overview by End-use Sector
- Polyamide 9T
- Polyarylamide/Polyamide MXD6
- Rest of APAC Polyarylamide/Polyamide MXD6 Market Overview by End-use Sector
8. REST OF WORLD
- Rest of World High Performance Polyamides Market Overview by End-use Sector
- Rest of World High Performance Polyamides Market Overview by Polyamide Type
- Rest of World Polyamide 11 & 12 Market Overview by Type
PART C: GUIDE TO THE INDUSTRY
- High Performance Polyamides Manufacturers
- Independent Compounders
PART D: ANNEXURE
- RESEARCH METHODOLOGY
- FEEDBACK
Arkema Group
BASF SE
Celanese Corporation
Chongqing Wote Zhicheng New Materials Technology Co., Ltd.
EMS-CHEMIE AG
Envalior GmbH
Evonik Industries AG
Guangdong Youju Advanced New Materials Co., Ltd.
Jiangmen Dezhongtai (DZT) Engineering Plastic Technology Co., Ltd.
Kingfa Sci.&Tech. Co.,Ltd.
Kuraray Co Ltd
Mitsubishi Gas Chemical Co. Ltd
Mitsui Chemicals, Inc.
Shandong Dongchen New Technology Co ,Ltd
Shandong Guangyin New Materials Co., Ltd
Syensqo SA
Toyobo Co. Ltd
Ube Industries, Ltd.
Zhejiang NHU Special Material Co., Ltd.
RELATED REPORTS
Polyamides (PA6, PA66) - A Global Market Overview
Report Code: CHM112 | Pages: 274 | Price: $4500
Published
Jul 2026
Polymethyl Methacrylate (PMMA) - A Global Market Overview
Report Code: CHM113 | Pages: 247 | Price: $4500
Published
Jul 2026
Polyoxymethylene (POM or Polyacetal) - A Global Market Overview
Report Code: CHM114 | Pages: 245 | Price: $4500
Published
Jul 2026
Polybutylene Terephthalate (PBT) - A Global Market Overview
Report Code: CHM115 | Pages: 224 | Price: $4500
Published
Jul 2026
Modified Polyphenylene Ether (mPPE) - A Global Market Overview
Report Code: CHM116 | Pages: 195 | Price: $4050
Published
Jul 2026