Global Fumed (Pyrogenic) Silica Market Trends and Outlook
Fumed (Pyrogenic) Silica is a high-purity, ultra-fine amorphous silica produced through flame hydrolysis processes and widely utilized as a reinforcing, thickening, anti-caking, rheology-control, and performance-enhancing additive across multiple industries. Its unique properties, including high surface area, low bulk density, thermal stability, and excellent dispersion capability, make it indispensable in synthetic rubber, paints & coatings, adhesives & sealants, electrical & electronics, plastics, personal care, food processing, and specialty chemical formulations. The global Fumed Silica market reached US$2.22 billion in 2025 and is projected to expand to 550.6 thousand metric tons and US$2.84 billion by 2032, registering CAGRs of 3.6% in value during 2025-2032.
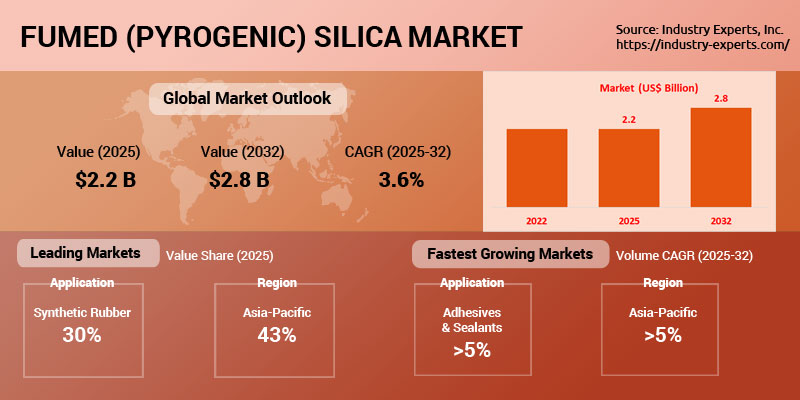
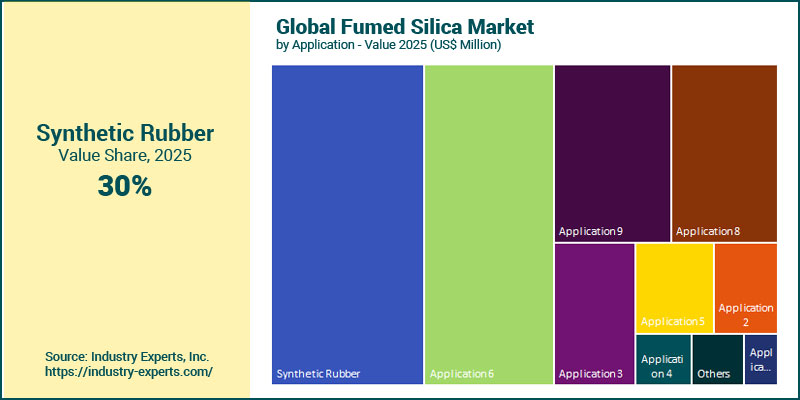
Synthetic Rubber remains the largest application segment due to extensive utilization of fumed silica in premium tire compounds, industrial rubber products, and silicone elastomers, while Adhesives & Sealants and Paints, Coatings & Inks are emerging as the fastest-growing application areas. Demand for high-purity silica materials in semiconductors, battery systems, thermal interface materials, and specialty insulation applications is also accelerating consumption, particularly across Asia-Pacific.
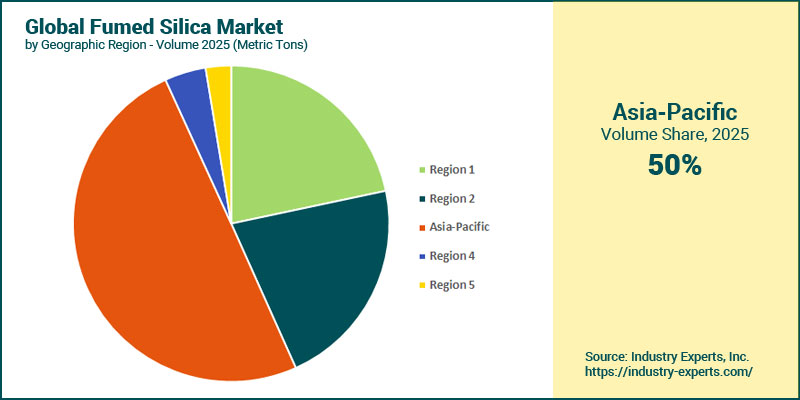
Asia-Pacific dominates the global Fumed Silica market with nearly half of global volume consumption, led by China, Japan, South Korea, and India due to strong manufacturing ecosystems across electronics, automotive, construction chemicals, and industrial materials sectors. North America and Europe continue to represent technologically advanced markets with stable demand for specialty coatings, silicone sealants, personal care products, and engineered materials.
Fumed (Pyrogenic) Silica Regional Market Analysis
Asia-Pacific dominates the global market in 2025, accounting for 50% share, supported by strong manufacturing activity across rubber, electronics, adhesives, coatings, and specialty chemical industries in China, Japan, South Korea, and India. North America and Europe remain closely positioned as the second- and third-largest regional markets, respectively, driven by demand from automotive, industrial coatings, personal care, and advanced material applications. Asia-Pacific is also forecast to be the fastest-growing region with a CAGR of 5.3%, reaching 300 thousand metric tons by 2032 due to expanding EV production, electronics manufacturing, infrastructure investments, and rising consumption of specialty silicones and sealants.
Fumed (Pyrogenic) Silica Market Analysis by Application
Synthetic Rubber dominates the market across both metrics with a value of US$672 million in 2025, accounting for 30.2% of market value, driven by increasing utilization in high-performance tires, industrial rubber compounds, and automotive applications. Paints, Coatings & Inks remains the second-largest application, while Electrical & Electronics and Adhesives & Sealants continue to gain momentum due to expanding electronics manufacturing and industrial assembly requirements. Adhesives & Sealants is forecast to be the fastest-growing segment with CAGRs of 5% in volume, reaching 64 thousand metric tons, closely followed by Paints, Coatings & Inks, supported by rising infrastructure coatings, specialty formulations, and advanced construction material demand globally.
Fumed (Pyrogenic) Silica Market Report Scope
This global report on Fumed (Pyrogenic) Silica analyzes the market based on end-use application for the period 2022-2032 with projections from 2025 to 2032 in terms of volume in metric tons and value in US$. In addition to providing profiles of major companies operating in the Fumed (Pyrogenic) Silica industry, the latest corporate, product, production capacity and industrial developments have been covered to offer a clear panorama of Fumed (Pyrogenic) Silica industry.
Key Metrics
| Historical Period: | 2022-2025 | |
| Base Year: | 2025 | |
| Forecast Period: | 2025-2032 | |
| Units: | Volume consumption in Metric Tons and Value market in US$ | |
| Companies Mentioned: | 30+ |
Global Fumed (Pyrogenic) Silica Market by Geographic Region
- North America (The United States, Canada and Mexico)
- Europe (France, Germany, Italy, Russia, Spain, the United Kingdom and Rest of Europe)
- Asia-Pacific (China, Japan, India, South Korea and Rest of Asia-Pacific)
- South America (Brazil and Rest of South America)
- Rest of World
Global Fumed (Pyrogenic) Silica Market by Application
- Synthetic Rubber
- Electrical & Electronics
- Personal Care & Cosmetics
- Plastics & Resins
- Food & Beverages
- Paints, Coatings & Inks
- Adhesives & Sealants
- Others
Fumed (Pyrogenic) Silica Market Frequently Asked Questions (FAQs)
Growth is being driven by increasing demand from synthetic rubber, electric vehicles, adhesives & sealants, paints & coatings, electronics manufacturing, and specialty industrial applications where fumed silica improves reinforcement, rheology, thermal stability, and formulation performance.
The global Fumed Silica market is projected to reach 550.6 thousand metric tons and US$2.84 billion by 2032.
Synthetic Rubber is the leading application segment, accounting for over 42% of global volume demand due to extensive usage in high-performance tires and industrial rubber products.
Asia-Pacific is the largest and fastest-growing regional market, supported by strong manufacturing activity across automotive, electronics, coatings, and specialty chemicals industries.
Fumed silica improves viscosity control, anti-sagging performance, reinforcement, and stability in adhesives and sealants used in automotive, construction, industrial assembly, and renewable energy applications.
Major companies include Evonik Industries, Cabot Corporation, Wacker Chemie AG, Tokuyama Corporation, and OCI Company Ltd., among several other global and regional manufacturers.
Electric vehicles, semiconductors, advanced electronics, renewable energy systems, specialty coatings, silicone elastomers, and high-performance construction chemicals are expected to create major long-term growth opportunities for the industry.
PART A: GLOBAL MARKET PERSPECTIVE
1. INTRODUCTION
- Product Outline
- Specialty Silicas or Synthetic Amorphous Silicas
- Physical and Chemical Properties of Specialty Silicas
- Purity
- Particle size
- Manufacturing Processes for Specialty Silicas
- Thermal Process
- Wet Process
- Fumed Silica (or Pyrogenic Silica)
- Applications
- Synthetic Rubber
- Electric & Electronics
- Personal Care & Cosmetics
- Plastics & Resins
- Chemicals
- Food & Beverages
- Paints, Coatings & Inks
- Adhesives & Sealants
- Other Applications
2. KEY GLOBAL PLAYERS
- Cabot Corporation (United States)
- Evonik Industries AG (Germany)
- Henan Xunyu Chemical Co., Ltd (China).
- Heraeus Quarzglas GmbH & Co. KG (Germany)
- OCI Company Ltd. (South Korea)
- Tokuyama Corporation (Japan)
- Wacker Chemie AG (Germany)
- Zhejiang Sucon Silicone Co., Ltd (China).
3. KEY BUSINESS AND PRODUCT TRENDS
4. GLOBAL MARKET OVERVIEW
- Global Fumed Silica Market Overview by Application
- Fumed Silica Application Market Overview by Global Region
- Synthetic Rubber
- Electrical & Electronics
- Personal Care & Cosmetics
- Plastics & Resins
- Food & Beverages
- Paints, Coatings & Inks
- Adhesives & Sealants
- Other Applications
PART B: REGIONAL MARKET PERSPECTIVE
- Global Fumed Silica Market Overview by Geographic Region
REGIONAL MARKET OVERVIEW
5. NORTH AMERICA
- North American Fumed Silica Market Overview by Geographic Region
- North American Fumed Silica Market Overview by Application
- Major Market Players
- Country-wise Analysis of North American Fumed Silica Market
- The United States
- United States Fumed Silica Market Overview by Application
- Canada
- Canadian Fumed Silica Market Overview by Application
- Mexico
- Mexican Fumed Silica Market Overview by Application
6. EUROPE
- European Fumed Silica Market Overview by Geographic Region
- European Fumed Silica Market Overview by Application
- Major Market Players
- Country-wise Analysis of European Fumed Silica Market
- France
- French Fumed Silica Market Overview by Application
- Germany
- German Fumed Silica Market Overview by Application
- Italy
- Italian Fumed Silica Market Overview by Application
- Russia
- Russian Fumed Silica Market Overview by Application
- Spain
- Spanish Fumed Silica Market Overview by Application
- The United Kingdom
- United Kingdom Fumed Silica Market Overview by Application
- Rest of Europe
- Rest of Europe Fumed Silica Market Overview by Application
7. ASIA-PACIFIC
- Asia-Pacific Fumed Silica Market Overview by Geographic Region
- Asia-Pacific Fumed Silica Market Overview by Application
- Major Market Players
- Country-wise Analysis of Asia-Pacific Fumed Silica Market
- China
- Chinese Fumed Silica Market Overview by Application
- India
- Indian Fumed Silica Market Overview by Application
- Japan
- Japanese Fumed Silica Market Overview by Application
- South Korea
- South Korean Fumed Silica Market Overview by Application
- Rest of Asia-Pacific
- Rest of Asia-Pacific Fumed Silica Market Overview by Application
8. SOUTH AMERICA
- South American Fumed Silica Market Overview by Geographic Region
- South American Fumed Silica Market Overview by Application
- Country-wise Analysis of South American Fumed Silica Market
- Brazil
- Brazilian Fumed Silica Market Overview by Application
- Rest of South America
- Rest of South America Fumed Silica Market Overview by Application
9. REST OF WORLD
- Rest of World Fumed Silica Market Overview by Application
PART C: GUIDE TO THE INDUSTRY
PART D: ANNEXURE
- RESEARCH METHODOLOGY
- FEEDBACK
Cabot Corporation
Evonik Industries AG
Henan Xunyu Chemical Co., Ltd
Heraeus Quarzglas GmbH & Co. KG
OCI Company Ltd.
Tokuyama Corporation
Wacker Chemie AG
Zhejiang Sucon Silicone Co., Ltd
RELATED REPORTS
Polyamides (PA6, PA66) - A Global Market Overview
Report Code: CHM112 | Pages: 274 | Price: $4500
Published
Jul 2026
Polymethyl Methacrylate (PMMA) - A Global Market Overview
Report Code: CHM113 | Pages: 247 | Price: $4500
Published
Jul 2026
Polyoxymethylene (POM or Polyacetal) - A Global Market Overview
Report Code: CHM114 | Pages: 245 | Price: $4500
Published
Jul 2026
Polybutylene Terephthalate (PBT) - A Global Market Overview
Report Code: CHM115 | Pages: 224 | Price: $4500
Published
Jul 2026
Modified Polyphenylene Ether (mPPE) - A Global Market Overview
Report Code: CHM116 | Pages: 195 | Price: $4050
Published
Jul 2026