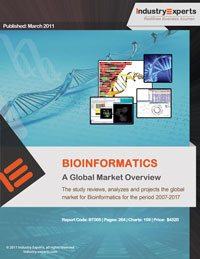
At the beginning of the "genomic revolution", Bioinformatics was applied in creating and maintaining a database that stored biological information, such as nucleotide and amino acid sequences. Development of this type of database involved not only design issues but also the development of complex interfaces, whereby researchers could access existing data, in addition to submitting new or revised data.
Market for Bioinformatics product categories analyzed in this study includes Bioinformatics Content, Bioinformatics Analysis Software & Services and Bioinformatics IT Infrastructure & Other Services. The report also includes the market analysis for end-use application analysis of Bioinformatics - Biopharma & Diagnostics, Genomics, Agriculture, Chemicals and Environmental & Other. The report analyses the market in terms of USD Million. Growing at a CAGR of 18.3% during the period 2007-2017, Global market for Bioinformatics is projected to reach $7.6 billion by 2017. The market for 2011 is estimated at about $2.4 billion.
The report reviews, analyses and projects the Bioinformatics market for global and the regional markets including the United States, Europe, Asia-Pacific and Rest of World. The regional markets further analyzed for 5 independent countries across Europe - France, Germany, the United Kingdom and Rest of Europe; Asia-Pacific - India, Japan and Rest of Asia-Pacific.
This 264 page global market report includes 109 charts (includes a data table and graphical representation for each chart), supported with meaningful and easy to understand graphical presentation, of the market. The statistical tables represent the data for the global market by geographic region, product category and application area. The brief business profiles of 57 key global players and 76 major players across the United States - 40; Europe - 23; Asia-Pacific - 10; and Rest of World - 3 are included in the report. The report also provides the listing of the companies engaged in research and development, equipment manufacturing, processing, supplies and distribution of Bioinformatics. The global list covers the addresses, contact numbers and the website addresses of 473 companies.
1. GLOBAL MARKET PERSPECTIVE
1.1 INTRODUCTION
1.2 PRODUCT OUTLINE
1.2.1 The backdrop
1.2.2 Introduction
1.2.3 Modeling Methods of Biological System
1.2.3.1 Static
1.2.3.2 Dynamic
1.2.4 Primary Research Areas of Bioinformatics
1.2.4.1 Sequence Analysis
1.2.4.2 Genome Annotation
1.2.4.3 Analysis of Gene Expression
1.2.4.4 Analysis of Protein Expression
1.2.4.5 Analysis of Mutations in Cancer
1.2.4.6 Protein Structure Prediction
1.2.4.7 Comparative Genomics
1.2.4.8 Modeling Biological Systems
1.2.4.9 High-Throughput Image Analysis
1.2.4.10 Protein-Protein Docking
1.2.5 Data Management Using Bioinformatics
1.2.5.1 Data Acquisition
1.2.5.2 Database Development
1.2.5.3 Data Analysis
1.2.5.4 Data Integration
1.2.5.5 Analysis of Integrated Data
1.2.6 Software and Tools
1.2.6.1 Web Services in Bioinformatics
1.3 APPLICATION ANALYSIS
1.3.1 Genomics
1.3.2 Proteomics
1.3.3 Transcriptiomics
1.3.4 Cheminformatics and Drug Design
1.3.5 Molecular Phylogenies
1.3.6 Agriculture
1.3.6.1 Crops
1.3.6.2 Resistance to Insects
1.3.6.3 Improving Nutritional Quality
1.3.6.4 Poorer soils and Drought Resistance
1.3.7 Medicine
1.3.7.1 Molecular Medicine
1.3.7.2 Personalized Medicine
1.3.7.3 Preventative Medicine
1.3.8 Nanotechnology
1.3.9 Environmental
1.3.9.1 Waste Cleanup
1.3.9.2 Climate Change Studies
1.3.9.3 Alternative Energy Sources
1.3.10 Data Mining as Applied in Bioinformatics
1.3.10.1 What is Data Mining?
1.3.10.2 Application of Data Mining in Bioinformatics
1.4 KEY MARKET TRENDS
The Role of Bioinformatics in Developing Antimicrobial Agents in Today´s Scenario of New and Reemerging Infectious Diseases and Increasing Antibiotic Resistance
The Emerging Science of Clinical Bioinformatics and the Role of JCBi
Adoption of Bioinformatics and Clinical Informatics to be Enhanced by Systems Integration Capabilities
Bioinformatics: An Indispensable Tool for Drug Discovery
Present Trends
The Need for Joint Initiatives
Technology in Genomics and Bioinformatics
Bioinformatics: India´ New Emerging Sector
Mining New Data Using Bioinformatics
Chemo- and Bioinformatics Approaches to Current Trends in Antimicrobial Agent Research
Adapting Bioinformatics for Genetically Improving Orphan Crops
Identifying miRNA from Porphyra yezoensis Using High-Throughput Sequencing and Bioinformatics
Analysis – A Case Study
Backdrop
Methodology and Chief Findings
Deductions and Implications
Court of Appeal View on Bioinformatics patents in the UK
Benefits to Bioinformatics Portals and Research form Usability Analysis
1.5 KEY GLOBAL PLAYERS
1.6 KEY BUSINESS TRENDS
CCCB Opts for CLC bio´s Enterprise Platform for Next Generation Sequence Analysis
Agilent Technologies Acquires BIOCIUS Life Sciences
Pfizer Acquires King Pharmaceuticals
Affymetrix Introduces Next-Generation microRNA Solution
Fujifilm to Take Over Merck Biomanufacturing Network
Almac Launches Bioinformatics Consultancy
PerkinElmer Completes Acquisition of chemagen Biopolymer-Technologie AG
AB SCIEX and Geneva Bioinformatics Enter Into Partnership
BD to Take Over Accuri Cytometers
Beckman Coulter to be Acquired by Danaher
Partek and Life Technologies in Collaboration
Spain´s CNIO and The Server Labs Team Up to Test Out Cloud (Taken from Trends)
EnSpire® Multimode Plate Reader with Label-Free Detection Technology for Drug Discovery Research from Perkin Elmer
Novartis in Agreement to Acquire Genoptix
PerkinElmer Introduces Next Generation DNA Sequencing and Analysis Services
Intrepid Bioinformatics´ Web-based SNP Chip Data Management System
Affymetrix Introduces Axiom™ Array Solution
Integromics Bioinformatics Software to Assist in Genome Profiling
Caliper Launches LabChip® Dx for Molecular Diagnostics
Pfizer Animal Health Acquires Synbiotics Corporation
Thermo Fisher Scientific Acquires Lomb Scientific
Dionex Corporation to be Acquired by Thermo Fisher
Merck to Take Over SmartCells, Inc
sanofi-aventis Acquires Worldwide Rights on Drug-Delivery Technology in Diabetes and Related Disorders from Ascendis Pharma
Bioinformatics Analysis Software Launched by Integromics
Thomson Reuters Completes Acquisition of GeneGo
GeneSpring GX 11.5 Multi-Omics Bioinformatics System from Agilent Makes its Debut
GeneGo´s MetaCore and Agilent´s GeneSpring Bioinformatics Solution Integrated
Avid Radiopharmaceuticals to be Acquired by Lilly
Pfizer to Use Biovista´s Bioinformatics Platform
Bioinformatics Tools for miRNA, mRNA Analysis Using LNA-Based Assays from Exiqon
Pfizer Acquires FoldRx
VaxDesign to be Taken Over by Sanofi Pasteur
Merck, BGI Sign Statement of Intent
PerkinElmer Acquires VisEn Medical, Inc
Lilly Acquires Alnara Pharmaceuticals
Thermo Fisher Acquires Fermentas
IBM, University of Missouri Partner on Genomics Research Initiative
TargeGen Inc to be Acquired by sanofi-aventis
PerkinElmer´s Prenatal BACs-on-Beads™ Assay Launched in Europe
Roche´s 454 Life Sciences Launches Next-Generation DNA Sequencer
Affymetrix´s Axiom Genome-Wide ASI Array for East Asian Populations
Thermo Fisher Takes Over Proxeon
PerkinElmer to Acquire Signature Genomic Laboratories, LLC
Affymetrix, The Jackson Laboratory Debut First Genotyping Tool for Studying Mouse Strain Diversity
Affymetrix Introduces GeneAtlas™ Personal Microarray System for Whole-Genome Gene Expression
Thermo Fisher Acquires Ahura Scientific
Life Technologies Debuts SOLiD™ 4 System with SOLiD™ 4hq Upgrade in Addition to Launching BioScope™ Software Solution and Announcing Investments for Bioinformatics
454 Life Sciences Introduces REM e System
Abbott to Take Over STARLIMS Technologies Ltd
Living Image 4.0 Software for IVIS® In Vivo Imaging Systems from Caliper
BD Acquires HandyLab, Inc
Thermo Fisher Takes Over B.R.A.H.M.S.
Abbott to Take Over Solvay Pharmaceuticals Business
PerkinElmer Acquires SYM-BIO Lifescience
Bayer CropScience Takes Over Athenix Corp.
Johnson & Johnson Acquires Cougar Biotechnology
PerkinElmer Takes Over Analytica of Branford, Inc
Beckman Coulter Acquires Olympus Corporation´s Lab-Based Diagnostics Business
Suite of Next-Generation Sequencing Kits from Illumina
1.7 GLOBAL MARKET OVERVIEW
1.7.1 Market Overview by Product Category
1.7.2 Market Overview by Application Segment
1.7.3 Product Category Overview by Global Region
1.7.3.1 Bioinformatics Content
1.7.3.2 Bioinformatics Analysis Software & Services
1.7.3.3 Bioinformatics IT Infrastructure & Other Services
1.7.4 Application Segment Overview by Global Region
1.7.4.1 Biopharma & Diagnostics
1.7.4.2 Genomics
1.7.4.3 Agriculture
1.7.4.4 Chemicals
1.7.4.5 Environmental & Other Applications
2. REGIONAL MARKET PERSPECTIVE
REGIONAL MARKET OVERVIEW
2.1 THE UNITED STATES
2.1.1 Market Overview by Product Category
2.1.2 Market Overview by Application Segment
2.1.3 Major Market Players
3rd Millennium, Inc
Abbott Laboratories
Accelrys, Inc
Affymetrix, Inc.
Agilent Technologies, Inc
Amgen, Inc
Applied Biosystems Inc
Beckman Coulter, Inc
Becton, Dickinson And Company
Biodiscovery, Inc
Bio-Rad Laboratories, Inc.
Bruker Daltonics, Inc
Caliper Life Sciences, Inc.
Celera Genomics Group
DNASTAR, Inc.
Eli Lilly and Company
Gene Logic, Inc
Genego
Genomequest, Inc
Geospiza, Inc
Helicos Biosciences Corporation
Hewlett-Packard Company
IBM Life Sciences
Illumina, Inc
Incyte Corporation
Infometrix, Inc
Invitrogen Corporation
Johnson & Johnson
Merck & Co Inc
Millennium Pharmaceuticals Inc
Myriad Genetics Inc
Perkinelmer, Inc
Pfizer Inc
Premier Biosoft International
Roche Diagnostics Corporation
Silicon Graphics, Inc
The Miraibio Group of Hitachi Solutions America Ltd
Thermo Fisher Scientific Inc
Tibco Spotfire
Tripos International
2.2 EUROPE
2.2.1 European Market Overview by Geographic Region
2.2.2 European Market Overview by Product Category
2.2.3 European Market Overview by Application Segment
2.2.4 Product Category Overview by European Region
2.2.4.1 Bioinformatics Content
2.2.4.2 Bioinformatics Analysis Software & Services
2.2.4.3 Bioinformatics IT Infrastructure & Other Services
2.2.5 Application Segment Overview by European Region
2.2.5.1 Biopharma & Diagnostics
2.2.5.2 Genomics
2.2.5.3 Agriculture
2.2.5.4 Chemicals
2.2.5.5 Environmental & Other Applications
2.2.6 Major Market Players
Applied Biosystems Ltd. (United Kingdom)
Astrazeneca Plc (United Kingdom)
Bayer Cropscience AG (Germany)
Biomax Informatics AG (Germany)
Biowisdom Ltd (United Kingdom)
BMI Biomedical Informatics (Germany)
Boehringer Ingelheim GmbH (Germany)
CLC BIO A/S (Denmark)
deCODE Genetics (Iceland)
Epigenomics AG (Germany)
GE Healthcare (United Kingdom)
Genedata AG (Switzerland)
Geneva Bioinformatics (Genebio) SA (Switzerland)
Glaxosmithkline Plc (United Kingdom)
Inforsense Ltd (United Kingdom)
Lion Bioscience AG (Germany)
Nonlinear Dynamics Limited (United Kingdom)
Novartis AG (Switzerland)
Quantiom Bioinformatics Gmbh & Co. Kg (Germany)
Roche Holding AG (Switzerland)
Sanofi-Aventis (France)
Source Bioscience Lifesciences (United Kingdom)
Swiss Institute Of Bioinformatics (Switzerland)
2.2.7 European Market Overview by Country
2.2.7.1 France
2.2.7.1.1 Market Overview by Product Category
2.2.7.1.2 Market Overview by Application Segment
2.2.7.2 Germany
2.2.7.2.1 Market Overview by Product Category
2.2.7.2.2 Market Overview by Application Segment
2.2.7.3 The United Kingdom
2.2.7.3.1 Market Overview by Product Category
2.2.7.3.2 Market Overview by Application Segment
2.2.7.4 Rest of Europe
2.2.7.4.1 Market Overview by Product Category
2.2.7.4.2 Market Overview by Application Segment
2.3 ASIA-PACIFIC
2.3.1 Asia-Pacific Market Overview by Geographic Region
2.3.2 Asia-Pacific Market Overview by Product Category
2.3.3 Asia-Pacific Market Overview by Application Segment
2.3.4 Product Category Overview by Asia-Pacific Region
2.3.4.1 Bioinformatics Content
2.3.4.2 Bioinformatics Analysis Software & Services
2.3.4.3 Bioinformatics IT Infrastructure & Other Services
2.3.5 Application Segment Overview by Asia-Pacific Region
2.3.5.1 Biopharma & Diagnostics
2.3.5.2 Genomics
2.3.5.3 Agriculture
2.3.5.4 Chemicals
2.3.5.5 Environmental & Other Applications
2.3.6 Major Market Players
Australian Genome Research Facility (Australia)
Becton Dickinson India Pvt Ltd (India)
Biomatters Ltd. (New Zealand)
Caliber Technologies Pvt Ltd (India)
C-DAC: Centre for Development of Advanced Computing (India)
GVK Biosciences (India)
HCL Technologies Limited (India)
Ocimum Biosolutions Ltd. (India)
Ranbaxy Laboratories Limited (India)
Reliance Life Sciences (India)
2.3.7 Asia-Pacific Market Overview by Country
2.3.7.1 Japan
2.3.7.1.1 Market Overview by Product Category
2.3.7.1.2 Market Overview by Application Segment
2.3.7.2 India
2.3.7.2.1 Market Overview by Product Category
2.3.7.2.2 Market Overview by Application Segment
2.3.7.3 Rest of Asia-Pacific
2.3.7.3.1 Market Overview by Product Category
2.3.7.3.2 Market Overview by Application Segment
2.4 REST OF WORLD
2.4.1 Market Overview by Product Category
2.4.2 Market Overview by Application Segment
2.4.3 Major Market Players
Genologics Life Sciences Software, Inc (Canada)
Kinexus Bioinformatics Corporation (Canada)
UBI Life Sciences (Canada)
3. GUIDE TO THE INDUSTRY
3.1 NORTH AMERICA
3.1.1 Canada
3.1.2 United States
3.2 EUROPE
3.2.1 Austria
3.2.2 Belgium
3.2.3 Denmark
3.2.4 Finland
3.2.5 France
3.2.6 Germany
3.2.7 Iceland
3.2.8 Italy
3.2.9 Norway
3.2.10 Spain
3.2.11 Sweden
3.2.12 Switzerland
3.2.13 The Netherlands
3.2.14 United Kingdom
3.3 ASIA-PACIFIC
3.3.1 Australia
3.3.2 China
3.3.3 India
3.3.4 Japan
3.3.5 Malaysia
3.3.6 New Zealand
3.3.7 Singapore
3.3.8 South Korea
3.4 REST OF WORLD
3.4.1 Israel
3.4.2 South Africa
4. ANNEXURE
4.1 RESEARCH METHODOLOGY
4.2 THE QUESTIONNAIRE
4.3 FEEDBACK
Charts & Graphs
1. GLOBAL MARKET PERSPECTIVE
Chart 1: Bioinformatics´ Genomic Applications Market (2007-2017) in USD Million
Chart 2: Bioinformatics´ Market in Chemicals Applications (2007-2017) in USD Million
Chart 3: Bioinformatics´ Agricultural Applications Market (2007-2017) in USD Million
Chart 4: Bioinformatics´ Biopharma & Diagnostic Applications Market (2007-2017) in USD Million
Chart 5: Bioinformatics´ Environmental & Other Applications Market (2007-2017) in USD Million
Chart 6: Global Bioinformatics Market Analysis (2007-2017) in USD Million
Chart 7: Global Bioinformatics Market Analysis (2007-2017) by Category – Content, Analysis Software & Services and IT Infrastructure & Other Services in USD Million
Chart 8: Glance at 2007, 2012 and 2017 Global Bioinformatics Market Share (%) by Category – Content, Analysis Software & Services and IT Infrastructure & Other Services
Chart 9: Global Bioinformatics Market Analysis (2007-2017) by Application Segment – Biopharma & Diagnostics, Genomics, Agriculture, Chemicals, Environmental & Other in USD Million
Chart 10: Glance at 2007, 2012 and 2017 Global Bioinformatics Market Share (%) by Application Segment – Biopharma & Diagnostics, Genomics, Agriculture, Chemicals, Environmental & Other
Chart 11: Global Bioinformatics Content Market Analysis (2007-2017) by Geographic Region – United States, Europe, Asia-Pacific and Rest of World in USD Million
Chart 12: Glance at 2007, 2012 and 2017 Global Bioinformatics Content Market Share (%) by Geographic Region – United States, Europe, Asia-Pacific and Rest of World
Chart 13: Global Bioinformatics Analysis Software & Services Market Analysis (2007-2017) by Geographic Region – United States, Europe, Asia-Pacific and Rest of World in USD Million
Chart 14: Glance at 2007, 2012 and 2017 Global Bioinformatics Analysis Software & Services Market Share (%) by Geographic Region – United States, Europe, Asia-Pacific and Rest of World
Chart 15: Global Bioinformatics IT Infrastructure & Other Services Market Analysis (2007-2017) by Geographic Region – United States, Europe, Asia-Pacific and Rest of World in USD Million
Chart 16: Glance at 2007, 2012 and 2017 Global Bioinformatics IT Infrastructure & Other Services Market Share (%) by Geographic Region – United States, Europe, Asia-Pacific and Rest of World
Chart 17: Global Bioinformatics Market Analysis (2007-2017) for Application in Biopharma & Diagnostics by Geographic Region – United States, Europe, Asia-Pacific and Rest of World in USD Million
Chart 18: Glance at 2007, 2012 and 2017 Global Biopharma & Diagnostics Market Share (%) of Bioinformatics by Geographic Region – United States, Europe, Asia-Pacific and Rest of World
Chart 19: Global Bioinformatics Market Analysis (2007-2017) for Application in Genomics by Geographic Region – United States, Europe, Asia-Pacific and Rest of World in USD Million
Chart 20: Glance at 2007, 2012 and 2017 Global Genomics Market Share (%) of Bioinformatics by Geographic Region – United States, Europe, Asia-Pacific and Rest of World
Chart 21: Global Bioinformatics Market Analysis (2007-2017) for Application in Agriculture by Geographic Region – United States, Europe, Asia-Pacific and Rest of World in USD Million
Chart 22: Glance at 2007, 2012 and 2017 Global Agriculture Market Share (%) of Bioinformatics by Geographic Region – United States, Europe, Asia-Pacific and Rest of World
Chart 23: Global Bioinformatics Market Analysis (2007-2017) for Application in Chemicals by Geographic Region – United States, Europe, Asia-Pacific and Rest of World in USD Million
Chart 24: Glance at 2007, 2012 and 2017 Global Chemicals Market Share (%) of Bioinformatics by Geographic Region – United States, Europe, Asia-Pacific and Rest of World
Chart 25: Global Bioinformatics Market Analysis (2007-2017) for Application in Environmental & Other by Geographic Region – United States, Europe, Asia-Pacific and Rest of World in USD Million
Chart 26: Glance at 2007, 2012 and 2017 Global Environmental & Other Applications Market Share (%) of Bioinformatics by Geographic Region – United States, Europe, Asia-Pacific and Rest of World
2. REGIONAL MARKET PERSPECTIVE
Chart 27: The Projection of Largest Regions in terms of Market Growth for Bioinformatics by Geography – Europe, Asia-Pacific, United States and Rest of World
Chart 28: Global Bioinformatics Market Analysis (2007-2017) by Geographic Region – United States, Europe, Asia-Pacific and Rest of World in USD Million
Chart 29: Glance at 2007, 2012 and 2017 Global Bioinformatics Market Share (%) by Geographic Region – United States, Europe, Asia-Pacific and Rest of World
REGIONAL MARKET OVERVIEW
THE UNITED STATES
Chart 30: United States Bioinformatics Market Analysis (2007-2017) by Category – Content, Analysis Software & Services and IT Infrastructure & Other Services in USD Million
Chart 31: Glance at 2007, 2012 and 2017 United States Bioinformatics Market Share (%) by Category – Content, Analysis Software & Services and IT Infrastructure & Other Services
Chart 32: United States Bioinformatics Market Analysis (2007-2017) by Application Segment – Biopharma & Diagnostics, Genomics, Agriculture, Chemicals, Environmental & Other in USD Million
Chart 33: Glance at 2007, 2012 and 2017 United States Bioinformatics Market Share (%) by Application Segment – Biopharma & Diagnostics, Genomics, Agriculture, Chemicals, Environmental & Other
EUROPE
Chart 34: European Bioinformatics Market Analysis (2007-2017) by Geographic Region – France, Germany, United Kingdom and Rest of Europe in USD Million
Chart 35: Glance at 2007, 2012 and 2017 European Bioinformatics Market Share (%) by Geographic Region – France, Germany, United Kingdom and Rest of Europe
Chart 36: European Bioinformatics Market Analysis (2007-2017) by Category – Content, Analysis Software & Services and IT Infrastructure & Other Services in USD Million
Chart 37: Glance at 2007, 2012 and 2017 European Bioinformatics Market Share (%) by Category – Content, Analysis Software & Services and IT Infrastructure & Other Services
Chart 38: European Bioinformatics Market Analysis (2007-2017) by Application Segment – Biopharma & Diagnostics, Genomics, Agriculture, Chemicals, Environmental & Other in USD Million
Chart 39: Glance at 2007, 2012 and 2017 European Bioinformatics Market Share (%) by Application Segment – Biopharma & Diagnostics, Genomics, Agriculture, Chemicals, Environmental & Other
Chart 40: European Bioinformatics Content Market Analysis (2007-2017) by Geographic Region – France, Germany, United Kingdom and Rest of Europe in USD Million
Chart 41: Glance at 2007, 2012 and 2017 European Bioinformatics Content Market Share (%) by Geographic Region – France, Germany, United Kingdom and Rest of Europe
Chart 42: European Bioinformatics Analysis Software & Services Market Analysis (2007-2017) by Geographic Region – France, Germany, United Kingdom and Rest of Europe in USD Million
Chart 43: Glance at 2007, 2012 and 2017 European Bioinformatics Analysis Software & Services Market Share (%) by Geographic Region – France, Germany, United Kingdom and Rest of Europe
Chart 44: European Bioinformatics IT Infrastructure & Other Services Market Analysis (2007-2017) by Geographic Region – France, Germany, United Kingdom and Rest of Europe in USD Million
Chart 45: Glance at 2007, 2012 and 2017 European Bioinformatics IT Infrastructure & Other Services Market Share (%) by Geographic Region – France, Germany, United Kingdom and Rest of Europe
Chart 46: European Bioinformatics Market Analysis (2007-2017) for Application in Biopharma & Diagnostics by Geographic Region – France, Germany, United Kingdom and Rest of Europe in USD Million
Chart 47: Glance at 2007, 2012 and 2017 European Biopharma & Diagnostics Market Share (%) of Bioinformatics by Geographic Region – France, Germany, United Kingdom and Rest of Europe
Chart 48: European Bioinformatics Market Analysis (2007-2017) for Application in Genomics by Geographic Region – France, Germany, United Kingdom and Rest of Europe in USD Million
Chart 49: Glance at 2007, 2012 and 2017 European Genomics Market Share (%) of Bioinformatics by Geographic Region – France, Germany, United Kingdom and Rest of Europe
Chart 50: European Bioinformatics Market Analysis (2007-2017) for Application in Agriculture by Geographic Region – France, Germany, United Kingdom and Rest of Europe in USD Million
Chart 51: Glance at 2007, 2012 and 2017 European Agriculture Market Share (%) of Bioinformatics by Geographic Region – France, Germany, United Kingdom and Rest of Europe
Chart 52: European Bioinformatics Market Analysis (2007-2017) for Application in Chemicals by Geographic Region – France, Germany, United Kingdom and Rest of Europe in USD Million
Chart 53: Glance at 2007, 2012 and 2017 European Chemicals Market Share (%) of Bioinformatics by Geographic Region – France, Germany, United Kingdom and Rest of Europe
Chart 54: European Bioinformatics Market Analysis (2007-2017) for Application in Environmental & Other by Geographic Region – France, Germany, United Kingdom and Rest of Europe in USD Million
Chart 55: Glance at 2007, 2012 and 2017 European Environmental & Other Applications Market Share (%) of Bioinformatics by Geographic Region – France, Germany, United Kingdom and Rest of Europe
France
Chart 56: French Bioinformatics Market Analysis (2007-2017) by Category – Content, Analysis Software & Services and IT Infrastructure & Other Services in USD Million
Chart 57: Glance at 2007, 2012 and 2017 French Bioinformatics Market Share (%) by Category – Content, Analysis Software & Services and IT Infrastructure & Other Services
Chart 58: French Bioinformatics Market Analysis (2007-2017) by Application Segment – Biopharma & Diagnostics, Genomics, Agriculture, Chemicals, Environmental & Other in USD Million
Chart 59: Glance at 2007, 2012 and 2017 French Bioinformatics Market Share (%) by Application Segment – Biopharma & Diagnostics, Genomics, Agriculture, Chemicals, Environmental & Other
Germany
Chart 60: German Bioinformatics Market Analysis (2007-2017) by Category – Content, Analysis Software & Services and IT Infrastructure & Other Services in USD Million
Chart 61: Glance at 2007, 2012 and 2017 German Bioinformatics Market Share (%) by Category – Content, Analysis Software & Services and IT Infrastructure & Other Services
Chart 62: German Bioinformatics Market Analysis (2007-2017) by Application Segment – Biopharma & Diagnostics, Genomics, Agriculture, Chemicals, Environmental & Other in USD Million
Chart 63: Glance at 2007, 2012 and 2017 German Bioinformatics Market Share (%) by Application Segment – Biopharma & Diagnostics, Genomics, Agriculture, Chemicals, Environmental & Other
The United Kingdom
Chart 64: United Kingdom Bioinformatics Market Analysis (2007-2017) by Category – Content, Analysis Software & Services and IT Infrastructure & Other Services in USD Million
Chart 65: Glance at 2007, 2012 and 2017 United Kingdom Bioinformatics Market Share (%) by Category – Content, Analysis Software & Services and IT Infrastructure & Other Services
Chart 66: United Kingdom Bioinformatics Market Analysis (2007-2017) by Application Segment – Biopharma & Diagnostics, Genomics, Agriculture, Chemicals, Environmental & Other in USD Million
Chart 67: Glance at 2007, 2012 and 2017 United Kingdom Bioinformatics Market Share (%) by Application Segment – Biopharma & Diagnostics, Genomics, Agriculture, Chemicals, Environmental & Other
Rest of Europe
Chart 68: Rest of Europe Bioinformatics Market Analysis (2007-2017) by Category – Content, Analysis Software & Services and IT Infrastructure & Other Services in USD Million
Chart 69: Glance at 2007, 2012 and 2017 Rest of Europe Bioinformatics Market Share (%) by Category – Content, Analysis Software & Services and IT Infrastructure & Other Services
Chart 70: Rest of Europe Bioinformatics Market Analysis (2007-2017) by Application Segment – Biopharma & Diagnostics, Genomics, Agriculture, Chemicals, Environmental & Other in USD Million
Chart 71: Glance at 2007, 2012 and 2017 Rest of Europe Bioinformatics Market Share (%) by Application Segment – Biopharma & Diagnostics, Genomics, Agriculture, Chemicals, Environmental & Other
ASIA-PACIFIC
Chart 72: Asia-Pacific Bioinformatics Market Analysis (2007-2017) by Geographic Region – India, Japan and Rest of Asia-Pacific in USD Million
Chart 73: Glance at 2007, 2012 and 2017 Asia-Pacific Bioinformatics Market Share (%) by Geographic Region – India, Japan and Rest of Asia-Pacific
Chart 74: Asia-Pacific Bioinformatics Market Analysis (2007-2017) by Category – Content, Analysis Software & Services and IT Infrastructure & Other Services in USD Million
Chart 75: Glance at 2007, 2012 and 2017 Asia-Pacific Bioinformatics Market Share (%) by Category – Content, Analysis Software & Services and IT Infrastructure & Other Services
Chart 76: Asia-Pacific Bioinformatics Market Analysis (2007-2017) by Application Segment – Biopharma & Diagnostics, Genomics, Agriculture, Chemicals, Environmental & Other in USD Million
Chart 77: Glance at 2007, 2012 and 2017 Asia-Pacific Bioinformatics Market Share (%) by Application Segment – Biopharma & Diagnostics, Genomics, Agriculture, Chemicals, Environmental & Other
Chart 78: Asia-Pacific Bioinformatics Content Market Analysis (2007-2017) by Geographic Region – India, Japan and Rest of Asia-Pacific in USD Million
Chart 79: Glance at 2007, 2012 and 2017 Asia-Pacific Bioinformatics Content Market Share (%) by Geographic Region – India, Japan and Rest of Asia-Pacific
Chart 80: Asia-Pacific Bioinformatics Analysis Software & Services Market Analysis (2007-2017) by Geographic Region – India, Japan and Rest of Asia-Pacific in USD Million
Chart 81: Glance at 2007, 2012 and 2017 Asia-Pacific Bioinformatics Analysis Software & Services Market Share (%) by Geographic Region – India, Japan and Rest of Asia-Pacific
Chart 82: Asia-Pacific Bioinformatics IT Infrastructure & Other Services Market Analysis (2007-2017) by Geographic Region – India, Japan and Rest of Asia-Pacific in USD Million
Chart 83: Glance at 2007, 2012 and 2017 Asia-Pacific Bioinformatics IT Infrastructure & Other Services Market Share (%) by Geographic Region – India, Japan and Rest of Asia-Pacific
Chart 84: Asia-Pacific Bioinformatics Market Analysis (2007-2017) for Application in Biopharma & Diagnostics by Geographic Region – India, Japan and Rest of Asia-Pacific in USD Million
Chart 85: Glance at 2007, 2012 and 2017 Asia-Pacific Biopharma & Diagnostics Market Share (%) of Bioinformatics by Geographic Region – India, Japan and Rest of Asia-Pacific
Chart 86: Asia-Pacific Bioinformatics Market Analysis (2007-2017) for Application in Genomics by Geographic Region – India, Japan and Rest of Asia-Pacific in USD Million
Chart 87: Glance at 2007, 2012 and 2017 Asia-Pacific Genomics Market Share (%) of Bioinformatics by Geographic Region – India, Japan and Rest of Asia-Pacific
Chart 88: Asia-Pacific Bioinformatics Market Analysis (2007-2017) for Application in Agriculture by Geographic Region – India, Japan and Rest of Asia-Pacific in USD Million
Chart 89: Glance at 2007, 2012 and 2017 Asia-Pacific Agriculture Market Share (%) of Bioinformatics by Geographic Region – India, Japan and Rest of Asia-Pacific
Chart 90: Asia-Pacific Bioinformatics Market Analysis (2007-2017) for Application in Chemicals by Geographic Region – India, Japan and Rest of Asia-Pacific in USD Million
Chart 91: Glance at 2007, 2012 and 2017 Asia-Pacific Chemicals Market Share (%) of Bioinformatics by Geographic Region – India, Japan and Rest of Asia-Pacific
Chart 92: Asia-Pacific Bioinformatics Market Analysis (2007-2017) for Application in Environmental & Other by Geographic Region – India, Japan and Rest of Asia-Pacific in USD Million
Chart 93: Glance at 2007, 2012 and 2017 Asia-Pacific Environmental & Other Applications Market Share (%) of Bioinformatics by Geographic Region – India, Japan and Rest of Asia-Pacific
Japan
Chart 94: Japanese Bioinformatics Market Analysis (2007-2017) by Category – Content, Analysis Software & Services and IT Infrastructure & Other Services in USD Million
Chart 95: Glance at 2007, 2012 and 2017 Japanese Bioinformatics Market Share (%) by Category – Content, Analysis Software & Services and IT Infrastructure & Other Services
Chart 96: Japanese Bioinformatics Market Analysis (2007-2017) by Application Segment – Biopharma & Diagnostics, Genomics, Agriculture, Chemicals, Environmental & Other in USD Million
Chart 97: Glance at 2007, 2012 and 2017 Japanese Bioinformatics Market Share (%) by Application Segment – Biopharma & Diagnostics, Genomics, Agriculture, Chemicals, Environmental & Other
India
Chart 98: Indian Bioinformatics Market Analysis (2007-2017) by Category – Content, Analysis Software & Services and IT Infrastructure & Other Services in USD Million
Chart 99: Glance at 2007, 2012 and 2017 Indian Bioinformatics Market Share (%) by Category – Content, Analysis Software & Services and IT Infrastructure & Other Services
Chart 100: Indian Bioinformatics Market Analysis (2007-2017) by Application Segment – Biopharma & Diagnostics, Genomics, Agriculture, Chemicals, Environmental & Other in USD Million
Chart 101: Glance at 2007, 2012 and 2017 Indian Bioinformatics Market Share (%) by Application Segment – Biopharma & Diagnostics, Genomics, Agriculture, Chemicals, Environmental & Other
Rest of Asia-Pacific
Chart 102: Rest of Asia-Pacific Bioinformatics Market Analysis (2007-2017) by Category – Content, Analysis Software & Services and IT Infrastructure & Other Services in USD Million
Chart 103: Glance at 2007, 2012 and 2017 Rest of Asia-Pacific Bioinformatics Market Share (%) by Category – Content, Analysis Software & Services and IT Infrastructure & Other Services
Chart 104: Rest of Asia-Pacific Bioinformatics Market Analysis (2007-2017) by Application Segment – Biopharma & Diagnostics, Genomics, Agriculture, Chemicals, Environmental & Other in USD Million
Chart 105: Glance at 2007, 2012 and 2017 Rest of Asia-Pacific Bioinformatics Market Share (%) by Application Segment – Biopharma & Diagnostics, Genomics, Agriculture, Chemicals, Environmental & Other/p>
REST OF WORLD
Chart 106: Rest of World Bioinformatics Market Analysis (2007-2017) by Category – Content, Analysis Software & Services and IT Infrastructure & Other Services in USD Million
Chart 107: Glance at 2007, 2012 and 2017 Rest of World Bioinformatics Market Share (%) by Category – Content, Analysis Software & Services and IT Infrastructure & Other Services
Chart 108: Rest of World Bioinformatics Market Analysis (2007-2017) by Application Segment – Biopharma & Diagnostics, Genomics, Agriculture, Chemicals, Environmental & Other in USD Million
Chart 109: Glance at 2007, 2012 and 2017 Rest of World Bioinformatics Market Share (%) by Application Segment – Biopharma & Diagnostics, Genomics, Agriculture, Chemicals, Environmental & Other
3rd Millennium, Inc
Abbott Laboratories
Accelrys, Inc
Affymetrix, Inc.
Agilent Technologies, Inc
Amgen, Inc
Applied Biosystems Inc
Applied Biosystems Ltd.
Astrazeneca Plc
Australian Genome Research Facility
Bayer Cropscience AG
Beckman Coulter, Inc
Becton Dickinson India Pvt. Ltd
Becton, Dickinson And Company
Biodiscovery, Inc
Biomatters Ltd.
Biomax Informatics AG
Bio-Rad Laboratories, Inc.
BMI Biomedical Informatics
Boehringer Ingelheim GmbH
Caliber Technologies Pvt. Ltd
Caliper Life Sciences, Inc.
C-DAC: Centre for Development of Advanced Computing
Celera Genomics Group
CLC BIO A/S
Decode Genetics
Eli Lilly and Company
GE Healthcare
Gene Logic, Inc
Genedata AG
Genego
Geneva Bioinformatics (Genebio) SA
Genologics Life Sciences Software, Inc
Glaxosmithkline Plc
GVK Biosciences
HCL Technologies Limited
Hewlett-Packard Company
IBM Life Sciences
Infometrix, Inc
Johnson & Johnson
Kinexus Bioinformatics Corporation
Merck & Co Inc
Millennium Pharmaceuticals Inc
Myriad Genetics Inc
Novartis AG
Perkinelmer, Inc
Pfizer Inc
Quantiom Bioinformatics GmbH & Co. Kg
Ranbaxy Laboratories Limited
Reliance Life Sciences
Roche Diagnostics Corporation
Roche Holding AG
Sanofi-Aventis
Swiss Institute of Bioinformatics
Thermo Fisher Scientific Inc
Tibco Spotfire
Tripos International
PLEASE SELECT LICENSE TYPE
RELATED REPORTS
Global Biosimilars Market – Products, Applications and Regulations
Report Code: BT010 | Pages: 356 | Price: $4050
Published
Jan 2021
Industrial Enzymes – A Global Market Overview
Report Code: BT030 | Pages: 296 | Price: $4500
Published
Sep 2020
Global Apoptosis Assays Market – Products, Detection Technologies, Applications and End-Use Markets
Report Code: BT034 | Pages: 416 | Price: $4860
Published
Jul 2020
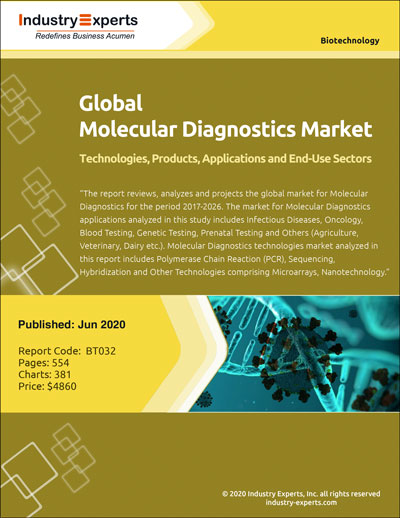
Global Molecular Diagnostics Market – Technologies, Products, Applications and End-Use Sectors
Report Code: BT032 | Pages: 554 | Price: $4860
Published
Jun 2020
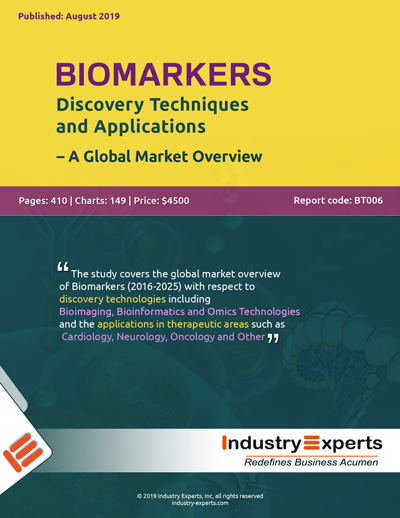
Biomarkers: Discovery Techniques and Applications – A Global Market Overview
Report Code: BT006 | Pages: 410 | Price: $4500
Published
Aug 2019
