Published Date: Nov 2016
Report Code: FB006
Pages: 324
Charts: 248
Health issues regarding the use of synthetic ingredients, such as sweeteners, have been gaining ground, prompting food and beverage manufacturers to seek out viable alternatives. Consumption of calorie-rich artificial sweeteners has been directly linked to an increase in low-density lipoprotein or "bad" cholesterol. Starch derivatives are derived by treating starch physically, chemically or enzymatically to obtain compounds with properties different from native starches. These products find wide application in several industries for a range of functions. In the food and beverage industry, starch derivatives are used as thickeners and stabilizers, while their pharmaceutical applications include tablet binders and drug release agents. Starch derivatives also find application in the cosmetics industry as emulsifiers and as fiber additives in the animal feed sector.
Some starch derivatives, such as glucose syrup and maltodextrin that are low in calorie content are being extensively utilized by this industry as alternative sweeteners, without compromising on product quality. Cyclodextrins are another category of starch derivatives that are used in the pharmaceutical industry for enhancing solubility, bioavailability stability and flavors and reducing evaporation, odors, tastes and haemolysis. This compound can also be used for converting liquids and oils into free-flowing powders and preventing incompatibility among admixtures. Cyclodextrins are also useful for improving pharmaceutical formulations and drug delivery with peptide, protein and oligonucleotide dosage forms. Modified starches constitute another type of starch derivatives that are being widely adopted in industrial applications due to their superior biocompatible properties compared to synthetic polymers. These starches are also being increasingly used as alternatives to synthetic polymers for making sustained and controlled drug delivery systems.
This global market report analyzes the starch derivatives product segments comprising Cyclodextrins Glucose Syrup, Hydrolysates, Maltodextrin and Modified Starches. The study also analyzes the key application areas of starch derivatives including Food & Feed Applications and Industrial Applications. These application areas further explored for sub-types of Food & Feed applications – Animal Feed, Confectioneries & Beverages and Processed Foods; and Industrial applications – Cosmetics & Personal Care Products, Papermaking, Pharmaceuticals and Other Industrial Applications.
Global Starch Derivatives Market by Product Type 2022
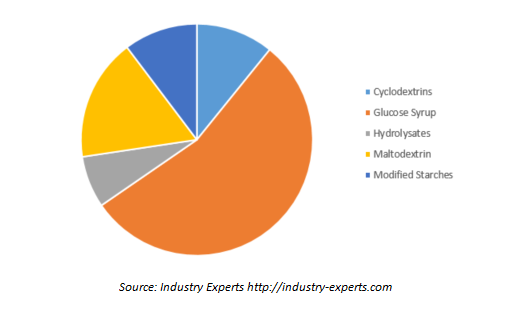
The study reviews, analyses and projects the starch derivatives for the global and regional markets including North America, Europe, Asia-Pacific, Latin America and Rest of World. The global market for Starch Derivatives is projected to reach US$75.4 billion by 2022 from a forecast US$53 billion in 2016 at a CAGR of 6.1% between 2016 and 2022. Cornering a share forecast to be 54.4% equating to US$28.8 billion in 2016, Glucose Syrup dominates the global market for Starch Derivatives, which is projected to reach US$41.1 billion by 2022 at a CAGR of 6.1% between the two years. Over the same period, global demand for Maltodextrin is anticipated to record the fastest CAGR of 6.5% and reach a projected US$12.9 billion by 2022 from a forecast US$8.8 billion in 2016.
The global market for Starch Derivatives is segmented into aforementioned five major regions. The regional markets further analyzed for 14 independent countries across North America – The United States and Canada; Europe – France, Germany, Italy, and the United Kingdom; Asia-Pacific – Australia, China, India, Japan and South Korea; Latin America – Argentina, Brazil and Mexico. The market for starch derivatives is analyzed in terms of value in USD for each region by key country, product segment and key application areas and sub-types of applications.
This 324 page global market research report includes 248 charts (includes a data table and graphical representation for each chart), supported with meaningful and easy to understand graphical presentation, of market numbers. This report profiles 18 global market players across the globe. The research also provides the listing of the companies engaged in manufacturing and supply of starch derivatives. The global list of companies covers the address, contact numbers and the website addresses of 142 companies.
PART A: GLOBAL MARKET PERSPECTIVE
1. INTRODUCTION
1.1 Product Outline
1.1.1 Introduction to Starch
1.1.2 A Brief History of Starch
1.1.3 The Chemistry of Starch
1.1.4 Starch Derivatives
1.1.4.1 Cyclodextrins
1.1.4.1.1 Properties
1.1.4.1.1.1 Inclusion Complex Formation
1.1.4.1.2 Applications of Cyclodextrins
1.1.4.1.2.1 Cosmetics and Personal Care Products
1.1.4.1.2.2 Foods, Flavors and Beverages
1.1.4.1.2.3 Pharmaceuticals
1.1.4.1.2.4 Agriculture and Chemicals
1.1.4.1.2.5 Adhesives, Coatings and Polymers
1.1.4.2 Glucose Syrup
1.1.4.1.3 Applications of Glucose Syrup
1.1.4.1.3.1 42 DE Glucose Syrup
1.1.4.1.3.2 Lower Than 42 DE Glucose Syrup
1.1.4.1.3.3 63 DE Glucose Syrup
1.1.4.1.3.4 95 DE Glucose Syrup
1.1.4.1.3.5 High-Fructose Glucose Syrup (HFGS)
1.1.4.1.3.6 Low-DE (< 20) Glucose Syrups or Maltodextrins
1.1.4.3 Hydrolysates
1.1.4.4 Maltodextrin
1.1.4.4.1 Production of Maltodextrins
1.1.4.4.2 Composition of Maltodextrins
1.1.4.4.3 Properties of Maltodextrins
1.1.4.4.3.1 Physicochemical Properties
1.1.4.4.3.2 Polymer-Water Interaction of Maltodextrins
1.1.4.4.3.2.1 Hygroscopicity and Storage
1.1.4.4.3.2.2 Turbidity
1.1.4.4.3.2.3 Precipitation
1.1.4.4.3.2.4 Free and Bound Water
1.1.4.4.4 Applications of Maltodextrins in Foods
1.1.4.5 Modified Starches
1.1.4.5.1 Acid-Treated Starch (E1401)
1.1.4.5.1.1 Applications
1.1.4.5.2 Alkaline-Treated Starch (E1402)
1.1.4.5.2.1 Applications
1.1.4.5.3 Bleached Starch (E1403)
1.1.4.5.3.1 Applications
1.1.4.5.4 Oxidized Starch (E1404)
1.1.4.5.4.1 Applications
1.1.4.5.5 Enzyme-Treated Starch (E1405)
1.1.4.5.5.1 Applications
1.1.4.5.6 Monostarch Phosphate (E1410)
1.1.4.5.6.1 Applications
1.1.4.5.7 Distarch Phosphate (E1412)
1.1.4.5.7.1 Applications
1.1.4.5.8 Phosphated Distarch Phosphate (E1413)
1.1.4.5.8.1 Applications
1.1.4.5.9 Acetylated Distarch Phosphate (E1414)
1.1.4.5.9.1 Applications
1.1.4.5.10 Acetylated Starch (E1420)
1.1.4.5.10.1 Applications
1.1.4.5.11 Acetylated Distarch Adipate (E1422)
1.1.4.5.11.1 Applications
1.1.4.5.12 Hydroxypropyl Starch (E1440)
1.1.4.5.12.1 Applications
1.1.4.5.13 Hydroxypropyl Distarch Phosphate (E1442)
1.1.4.5.13.1 Applications
1.1.4.5.14 Starch Sodium Octenyl Succinate (E1450)
1.1.4.5.14.1 Applications
1.1.5 Other Key Application Areas
1.1.5.1 Animal Feed
1.1.5.2 Papermaking
1.1.5.3 Other Industrial Applications
1.1.5.3.1 Petroleum
1.1.5.3.2 Plastics
1.1.5.3.3 Textiles
2. KEY MARKET TRENDS
2.1 Maltodextrins Propelling Global Demand for Starch Derivatives
2.2 Novel Techniques for Starch Esterification Developed
2.3 Demand for Starch and Starch Derivatives Growing in Gluten-Free Products
2.4 Clean Label Starch Technologies Gaining Ground
2.5 Starches from Non-Conventional Sources Offer Potential in Industrial Applications
2.6 Modified Starches Expand Pharmaceutical Applications
3. KEY GLOBAL PLAYERS
Archer Daniels Midland (United States)
Agrana Group (Austria)
Avebe U.A. (The Netherlands)
Beneo GmbH (Germany)
Cargill, Inc. (United States)
China Essence Group Ltd. (China)
Emsland Starke GmbH (Germany)
Emsland Group (Germany)
Global Bio-Chem Technology Group Company Limited (Hong Kong)
Grain Processing Corporation (United States)
Ingredion, Inc. (United States)
Lasenor Emul S.L. (Spain)
Lipoid GmbH (Germany)
Roquette Freres (France)
San Soon Seng Food Industry Sdn Bhd (Malayasia)
Stern-Wywiol Gruppe GmbH & Co., KG. (Germany)
Tate & Lyle Plc (United Kingdom)
Zhucheng Dongxiao Biotechnology Co (China)
4. KEY BUSINESS & PRODUCT TRENDS
HL Agro Products Pvt. Ltd., Establishes Corn Starch Business unit in Kanpur, India
Ingredion, Inc. to Acquire Rice Starch & Flour Business from Sun Flour
Archer Daniels Midland Unveils ADM Confectionery Moulding Starch
Tate & Lyle Plc Introduces CLARIA Delight starch, a new starch Ingredient
Archer Daniels Midland Acquires Casablanca
Beneo GmbH Launches new rice Starch, Remypure
Grain Processing Corporation Introduces PURE-DENT® B730 Food Starch Solution
Cargill, Inc Introduces C CreamTex™06329, a new starch solution
Cargill, Inc Unveils C*PulpTex™ 12931 Starch
Ingredion, Inc Acquires Penford Corporation
Cargill, Inc Opens New Corn Processing Plant in Brazil
Tate & Lyle Plc Establishes Manufacturing Facility in Netherlands
Beneo GmbH Introduces Rice Starch
Cargill, Inc Develops new Three Novel Approach for reduced fat levels
Cargill, Inc and Arasco Enter into Joint Venture Agreement
5. GLOBAL MARKET OVERVIEW
5.1 Global Starch Derivatives Market Overview by Product Segment
5.1.1 Starch Derivatives Product Segment Market Overview by Global Region
5.1.1.1 Cyclodextrins
5.1.1.2 Glucose Syrup
5.1.1.3 Hydrolysates
5.1.1.4 Maltodextrin
5.1.1.5 Modified Starches
5.2 Global Starch Derivatives Market Overview by Application Area
5.2.1 Food & Feed Application Market Overview by Type
5.2.1.1 Food & Feed Applications Market Overview by Global Region
5.2.1.1.1 Food & Feed Applications Sub-Type Market Overview by Global Region
5.2.1.1.1.1 Animal Feed
5.2.1.1.1.2 Confectioneries & Beverages
5.2.1.1.1.3 Processed Foods
5.2.2 Industrial Application Market Overview by Type
5.2.2.1 Industrial Applications Market Overview by Global Region
5.2.2.1.1 Industrial Applications Sub-Type Market Overview by Global Region
5.2.2.1.1.1 Cosmetics & Personal Care Products
5.2.2.1.1.2 Papermaking
5.2.2.1.1.3 Pharmaceuticals
5.2.2.1.1.4 Other Industrial Applications
PART B: REGIONAL MARKET PERSPECTIVE
REGIONAL MARKET OVERVIEW
1. NORTH AMERICA
1.1 North American Starch Derivatives Market Overview by Geographic Region
1.2 North American Starch Derivatives Market Overview by Product Segment
1.3 North American Starch Derivatives Market Overview by Application Area
1.3.1 Food & Feed Applications Market Overview by Type
1.3.2 Industrial Applications Market Overview by Type
1.4 North American Starch Derivatives Market Overview by Country
1.4.1 The United States
1.4.1.1 United States Starch Derivatives Market Overview by Product Segment
1.4.1.2 United States Starch Derivatives Market Overview by Application Area
1.4.1.2.1 Food & Feed Applications Market Overview by Type
1.4.1.2.2 Industrial Applications Market Overview by Type
1.4.2 Canada
1.4.2.1 Canadian Starch Derivatives Market Overview by Product Segment
1.4.2.2 Canadian Starch Derivatives Market Overview by Application Area
1.4.2.2.1 Food & Feed Applications Market Overview by Type
1.4.2.2.2 Industrial Applications Market Overview by Type
2. EUROPE
2.1 European Starch Derivatives Market Overview by Geographic Region
2.2 European Starch Derivatives Market Overview by Product Segment
2.3 European Starch Derivatives Market Overview by Application Area
2.3.1 Food & Feed Applications Market Overview by Type
2.3.2 Industrial Applications Market Overview by Type
2.4 European Starch Derivatives Market Overview by Country
2.4.1 France
2.4.1.1 French Starch Derivatives Market Overview by Product Segment
2.4.1.2 French Starch Derivatives Market Overview by Application Area
2.4.1.2.1 Food & Feed Applications Market Overview by Type
2.4.1.2.2 Industrial Applications Market Overview by Type
2.4.2 Germany
2.4.2.1 German Starch Derivatives Market Overview by Product Segment
2.4.2.2 German Starch Derivatives Market Overview by Application Area
2.4.2.2.1 Food & Feed Applications Market Overview by Type
2.4.2.2.2 Industrial Applications Market Overview by Type
2.4.3 Italy
2.4.3.1 Italian Starch Derivatives Market Overview by Product Segment
2.4.3.2 Italian Starch Derivatives Market Overview by Application Area
2.4.3.2.1 Food & Feed Applications Market Overview by Type
2.4.3.2.2 Industrial Applications Market Overview by Type
2.4.4 The United Kingdom
2.4.4.1 United Kingdom Starch Derivatives Market Overview by Product Segment
2.4.4.2 United Kingdom Starch Derivatives Market Overview by Application Area
2.4.4.2.1 Food & Feed Applications Market Overview by Type
2.4.4.2.2 Industrial Applications Market Overview by Type
2.4.5 Rest of Europe
2.4.5.1 Rest of Europe Starch Derivatives Market Overview by Product Segment
2.4.5.2 Rest of Europe Starch Derivatives Market Overview by Application Area
2.4.5.2.1 Food & Feed Applications Market Overview by Type
2.4.5.2.2 Industrial Applications Market Overview by Type
3. ASIA-PACIFIC
3.1 Asia-Pacific Starch Derivatives Market Overview by Geographic Region
3.2 Asia-Pacific Starch Derivatives Market Overview by Product Segment
3.3 Asia-Pacific Starch Derivatives Market Overview by Application Area
3.3.1 Food & Feed Applications Market Overview by Type
3.3.2 Industrial Applications Market Overview by Type
3.4 Asia-Pacific Starch Derivatives Market Overview by Country
3.4.1 Australia
3.4.1.1 Australian Starch Derivatives Market Overview by Product Segment
3.4.1.2 Australian Starch Derivatives Market Overview by Application Area
3.4.1.2.1 Food & Feed Applications Market Overview by Type
3.4.1.2.2 Industrial Applications Market Overview by Type
3.4.2 China
3.4.2.1 Chinese Starch Derivatives Market Overview by Product Segment
3.4.2.2 Chinese Starch Derivatives Market Overview by Application Area
3.4.2.2.1 Food & Feed Applications Market Overview by Type
3.4.2.2.2 Industrial Applications Market Overview by Type
3.4.3 India
3.4.3.1 Indian Starch Derivatives Market Overview by Product Segment
3.4.3.2 Indian Starch Derivatives Market Overview by Application Area
3.4.3.2.1 Food & Feed Applications Market Overview by Type
3.4.3.2.2 Industrial Applications Market Overview by Type
3.4.4 Japan
3.4.4.1 Japanese Starch Derivatives Market Overview by Product Segment
3.4.4.2 Japanese Starch Derivatives Market Overview by Application Area
3.4.4.2.1 Food & Feed Applications Market Overview by Type
3.4.4.2.2 Industrial Applications Market Overview by Type
3.4.5 South Korea
3.4.5.1 South Korean Starch Derivatives Market Overview by Product Segment
3.4.5.2 South Korean Starch Derivatives Market Overview by Application Area
3.4.5.2.1 Food & Feed Applications Market Overview by Type
3.4.5.2.2 Industrial Applications Market Overview by Type
3.4.6 Rest of Asia-Pacific
3.4.6.1 Rest of APAC Starch Derivatives Market Overview by Product Segment
3.4.6.2 Rest of APAC Starch Derivatives Market Overview by Application Area
3.4.6.2.1 Food & Feed Applications Market Overview by Type
3.4.6.2.2 Industrial Applications Market Overview by Type
4. LATIN AMERICA
4.1 Latin American Starch Derivatives Market Overview by Geographic Region
4.2 Latin American Starch Derivatives Market Overview by Product Segment
4.3 Latin American Starch Derivatives Market Overview by Application Area
4.3.1 Food & Feed Applications Market Overview by Type
4.3.2 Industrial Applications Market Overview by Type
4.4 Latin American Starch Derivatives Market Overview by Country
4.4.1 Argentina
4.4.1.1 Argentinean Starch Derivatives Market Overview by Product Segment
4.4.1.2 Argentinean Starch Derivatives Market Overview by Application Area
4.4.1.2.1 Food & Feed Applications Market Overview by Type
4.4.1.2.2 Industrial Applications Market Overview by Type
4.4.2 Brazil
4.4.2.1 Brazilian Starch Derivatives Market Overview by Product Segment
4.4.2.2 Brazilian Starch Derivatives Market Overview by Application Area
4.4.2.2.1 Food & Feed Applications Market Overview by Type
4.4.2.2.2 Industrial Applications Market Overview by Type
4.4.3 Mexico
4.4.3.1 Mexican Starch Derivatives Market Overview by Product Segment
4.4.3.2 Mexican Starch Derivatives Market Overview by Application Area
4.4.3.2.1 Food & Feed Applications Market Overview by Type
4.4.3.2.2 Industrial Applications Market Overview by Type
4.4.4 Rest of Latin America
4.4.4.1 Rest of Latin America Starch Derivatives Market Overview by Product Segment
4.4.4.2 Rest of Latin America Starch Derivatives Market Overview by Application Area
4.4.4.2.1 Food & Feed Applications Market Overview by Type
4.4.4.2.2 Industrial Applications Market Overview by Type
5. REST OF WORLD
5.1 Rest of World Starch Derivatives Market Overview by Product Segment
5.2 Rest of World Starch Derivatives Market Overview by Application Area
5.2.1 Food & Feed Applications Market Overview by Type
5.2.2 Industrial Applications Market Overview by Type
PART C: GUIDE TO THE INDUSTRY
1. North America
2. Europe
3. Asia-Pacific
4. Latin America
5. Rest of World
PART D: ANNEXURE
1. RESEARCH METHODOLOGY
2. FEEDBACK
Charts & Graphs
PART A: GLOBAL MARKET PERSPECTIVE
Chart 1: Global Starch Derivatives Market 2012, 2016 and 2022 in USD Million
Chart 2: Global Starch Derivatives Market 2012, 2016 and 2022 by Product Segment in USD Million
Chart 3: Global Starch Derivatives Market Analysis (2012-2022) in USD Million
Chart 4: Global Starch Derivatives Market Analysis (2012-2022) by Product Segment – Cyclodextrins, Glucose Syrup, Hydrolysates, Maltodextrin and Modified Starches in USD Million
Chart 5: Glance at 2012, 2017 and 2022 Global Starch Derivatives Market Share (%) by Product Segment – Cyclodextrins, Glucose Syrup, Hydrolysates, Maltodextrin and Modified Starches
Chart 6: Global Cyclodextrins Market Analysis (2012-2022) by Geographic Region – North America, Europe, Asia-Pacific, Latin America and Rest of World in USD Million
Chart 7: Glance at 2012, 2017 and 2022 Global Cyclodextrins Market Share (%) by Geographic Region – North America, Europe, Asia-Pacific, Latin America and Rest of World
Chart 8: Global Glucose Syrup Market Analysis (2012-2022) by Geographic Region – North America, Europe, Asia-Pacific, Latin America and Rest of World in USD Million
Chart 9: Glance at 2012, 2017 and 2022 Global Glucose Syrup Market Share (%) by Geographic Region – North America, Europe, Asia-Pacific, Latin America and Rest of World
Chart 10: Global Hydrolysates Market Analysis (2012-2022) by Geographic Region – North America, Europe, Asia-Pacific, Latin America and Rest of World in USD Million
Chart 11: Glance at 2012, 2017 and 2022 Global Hydrolysates Syrup Market Share (%) by Geographic Region – North America, Europe, Asia-Pacific, Latin America and Rest of World
Chart 12: Global Maltodextrin Market Analysis (2012-2022) by Geographic Region – North America, Europe, Asia-Pacific, Latin America and Rest of World in USD Million
Chart 13: Glance at 2012, 2017 and 2022 Global Maltodextrin Market Share (%) by Geographic Region – North America, Europe, Asia-Pacific, Latin America and Rest of World
Chart 14: Global Modified Starches Market Analysis (2012-2022) by Geographic Region – North America, Europe, Asia-Pacific, Latin America and Rest of World in USD Million
Chart 15: Glance at 2012, 2017 and 2022 Global Modified Starches Market Share (%) by Geographic Region – North America, Europe, Asia-Pacific, Latin America and Rest of World
Chart 16: Global Starch Derivatives Market Analysis (2012-2022) by Application Area – Food & Feed Applications and Industrial Applications in USD Million
Chart 17: Glance at 2012, 2017 and 2022 Global Starch Derivatives Market Share (%) by Application Area – Food & Feed Applications and Industrial Applications
Chart 18: Global Starch Derivatives Market Analysis (2012-2022) in Food & Feed Applications by Type – Animal Feed, Confectioneries & Beverages and Processed Foods in USD Million
Chart 19: Glance at 2012, 2017 and 2022 Global Starch Derivatives Market Share (%) in Food & Feed Applications by Type – Animal Feed, Confectioneries & Beverages and Processed Foods
Chart 20: Global Starch Derivatives Market Analysis (2012-2022) in Food & Feed Applications by Geographic Region – North America, Europe, Asia-Pacific, Latin America and Rest of World in USD Million
Chart 21: Glance at 2012, 2017 and 2022 Global Starch Derivatives Market Share (%) in Food & Feed Applications by Geographic Region – North America, Europe, Asia-Pacific, Latin America and Rest of World
Chart 22: Global Starch Derivatives Market Analysis (2012-2022) in Animal Feed by Geographic Region – North America, Europe, Asia-Pacific, Latin America and Rest of World in USD Million
Chart 23: Glance at 2012, 2017 and 2022 Global Starch Derivatives Market Share (%) in Animal Feed by Geographic Region – North America, Europe, Asia-Pacific, Latin America and Rest of World
Chart 24: Global Starch Derivatives Market Analysis (2012-2022) in Confectioneries & Beverages by Geographic Region – North America, Europe, Asia-Pacific, Latin America and Rest of World in USD Million
Chart 25: Glance at 2012, 2017 and 2022 Global Starch Derivatives Market Share (%) in Confectioneries & Beverages by Geographic Region – North America, Europe, Asia-Pacific, Latin America and Rest of World
Chart 26: Global Starch Derivatives Market Analysis (2012-2022) in Processed Foods by Geographic Region – North America, Europe, Asia-Pacific, Latin America and Rest of World in USD Million
Chart 27: Glance at 2012, 2017 and 2022 Global Starch Derivatives Market Share (%) in Processed Foods by Geographic Region – North America, Europe, Asia-Pacific, Latin America and Rest of World
Chart 28: Global Starch Derivatives Market Analysis (2012-2022) in Industrial Applications by Type – Cosmetics & Personal Care Products, Papermaking, Pharmaceuticals and Other Industrial Applications in USD Million
Chart 29: Glance at 2012, 2017 and 2022 Global Starch Derivatives Market Share (%) in Industrial Applications by Type – Cosmetics & Personal Care Products, Papermaking, Pharmaceuticals and Other Industrial Applications
Chart 30: Global Starch Derivatives Market Analysis (2012-2022) in Industrial Applications by Geographic Region – North America, Europe, Asia-Pacific, Latin America and Rest of World in USD Million
Chart 31: Glance at 2012, 2017 and 2022 Global Starch Derivatives Market Share (%) in Industrial Applications by Geographic Region – North America, Europe, Asia-Pacific, Latin America and Rest of World
Chart 32: Global Starch Derivatives Market Analysis (2012-2022) in Cosmetics & Personal Care Products by Geographic Region – North America, Europe, Asia-Pacific, Latin America and Rest of World in USD Million
Chart 33: Glance at 2012, 2017 and 2022 Global Starch Derivatives Market Share (%) in Cosmetics & Personal Care Products by Geographic Region – North America, Europe, Asia-Pacific, Latin America and Rest of World
Chart 34: Global Starch Derivatives Market Analysis (2012-2022) in Papermaking by Geographic Region – North America, Europe, Asia-Pacific, Latin America and Rest of World in USD Million
Chart 35: Glance at 2012, 2017 and 2022 Global Starch Derivatives Market Share (%) in Papermaking by Geographic Region – North America, Europe, Asia-Pacific, Latin America and Rest of World
Chart 36: Global Starch Derivatives Market Analysis (2012-2022) in Pharmaceuticals by Geographic Region – North America, Europe, Asia-Pacific, Latin America and Rest of World in USD Million
Chart 37: Glance at 2012, 2017 and 2022 Global Starch Derivatives Market Share (%) in Pharmaceuticals by Geographic Region – North America, Europe, Asia-Pacific, Latin America and Rest of World
Chart 38: Global Starch Derivatives Market Analysis (2012-2022) in Other Industrial Applications by Geographic Region – North America, Europe, Asia-Pacific, Latin America and Rest of World in USD Million
Chart 39: Glance at 2012, 2017 and 2022 Global Starch Derivatives Market Share (%) in Other Industrial Applications by Geographic Region – North America, Europe, Asia-Pacific, Latin America and Rest of World
PART B: REGIONAL MARKET PERSPECTIVE
Chart 40: Fastest Growing Markets (2016-2022) by Geographic Region – North America, Europe, Asia-Pacific and Latin America in %CAGR
Chart 41: Global Starch Derivatives Market Analysis (2012-2022) by Geographic Region – North America, Europe, Asia-Pacific, Latin America and Rest of World in USD Million
Chart 42: Glance at 2012, 2017 and 2022 Global Starch Derivatives Market Share (%) by Geographic Region – North America, Europe, Asia-Pacific, Latin America and Rest of World
REGIONAL MARKET OVERVIEW
NORTH AMERICA
Chart 43: North American Starch Derivatives Market Analysis (2012-2022) in USD Million
Chart 44: North American Starch Derivatives Market Analysis (2012-2022) by Geographic Region – United States and Canada in USD Million
Chart 45: Glance at 2012, 2017 and 2022 North American Starch Derivatives Market Share (%) by Geographic Region – United States and Canada
Chart 46: North American Starch Derivatives Market Analysis (2012-2022) by Product Segment – Cyclodextrins, Glucose Syrup, Hydrolysates, Maltodextrin and Modified Starches in USD Million
Chart 47: Glance at 2012, 2017 and 2022 North American Starch Derivatives Market Share (%) by Product Segment – Cyclodextrins, Glucose Syrup, Hydrolysates, Maltodextrin and Modified Starches
Chart 48: North American Starch Derivatives Market Analysis (2012-2022) by Application Area – Food & Feed Applications and Industrial Applications in USD Million
Chart 49: Glance at 2012, 2017 and 2022 North American Starch Derivatives Market Share (%) by Application Area – Food & Feed Applications and Industrial Applications
Chart 50: North American Starch Derivatives Market Analysis (2012-2022) in Food & Feed Applications by Type – Animal Feed, Confectioneries & Beverages and Processed Foods in USD Million
Chart 51: Glance at 2012, 2017 and 2022 North American Starch Derivatives Market Share (%) in Food & Feed Applications Sub-Application – Animal Feed, Confectioneries & Beverages and Processed Foods
Chart 52: North American Starch Derivatives Market Analysis (2012-2022) in Industrial Applications by Type – Cosmetics & Personal Care Products, Papermaking, Pharmaceuticals and Other Industrial Applications in USD Million
Chart 53: Glance at 2012, 2017 and 2022 North American Starch Derivatives Market Share (%) in Food & Feed Applications by Type – Cosmetics & Personal Care Products, Papermaking, Pharmaceuticals and Other Industrial Applications
The United States
Chart 54: United States Starch Derivatives Market Analysis (2012-2022) in USD Million
Chart 55: United States Starch Derivatives Market Analysis (2012-2022) by Product Segment – Cyclodextrins, Glucose Syrup, Hydrolysates, Maltodextrin and Modified Starches in USD Million
Chart 56: Glance at 2012, 2017 and 2022 United States Starch Derivatives Market Share (%) by Product Segment – Cyclodextrins, Glucose Syrup, Hydrolysates, Maltodextrin and Modified Starches
Chart 57: United States Starch Derivatives Market Analysis (2012-2022) by Application Area – Food & Feed Applications and Industrial Applications in USD Million
Chart 58: Glance at 2012, 2017 and 2022 United States Starch Derivatives Market Share (%) by Application Area – Food & Feed Applications and Industrial Applications
Chart 59: United States Starch Derivatives Market Analysis (2012-2022) in Food & Feed Applications by Type – Animal Feed, Confectioneries & Beverages and Processed Foods in USD Million
Chart 60: Glance at 2012, 2017 and 2022 United States Starch Derivatives Market Share (%) in Food & Feed Applications Sub-Application – Animal Feed, Confectioneries & Beverages and Processed Foods
Chart 61: United States Starch Derivatives Market Analysis (2012-2022) in Industrial Applications by Type – Cosmetics & Personal Care Products, Papermaking, Pharmaceuticals and Other Industrial Applications in USD Million
Chart 62: Glance at 2012, 2017 and 2022 United States Starch Derivatives Market Share (%) in Industrial Applications by Type – Cosmetics & Personal Care Products, Papermaking, Pharmaceuticals and Other Industrial Applications
Canada
Chart 63: Canadian Starch Derivatives Market Analysis (2012-2022) in USD Million
Chart 64: Canadian Starch Derivatives Market Analysis (2012-2022) by Product Segment – Cyclodextrins, Glucose Syrup, Hydrolysates, Maltodextrin and Modified Starches in USD Million
Chart 65: Glance at 2012, 2017 and 2022 Canadian Starch Derivatives Market Share (%) by Product Segment – Cyclodextrins, Glucose Syrup, Hydrolysates, Maltodextrin and Modified Starches
Chart 66: Canadian Starch Derivatives Market Analysis (2012-2022) by Application Area – Food & Feed Applications and Industrial Applications in USD Million
Chart 67: Glance at 2012, 2017 and 2022 Canadian Starch Derivatives Market Share (%) by Application Area – Food & Feed Applications and Industrial Applications
Chart 68: Canadian Starch Derivatives Market Analysis (2012-2022) in Food & Feed Applications by Type – Animal Feed, Confectioneries & Beverages and Processed Foods in USD Million
Chart 69: Glance at 2012, 2017 and 2022 Canadian Starch Derivatives Market Share (%) in Food & Feed Applications Sub-Application – Animal Feed, Confectioneries & Beverages and Processed Foods
Chart 70: Canadian Starch Derivatives Market Analysis (2012-2022) in Industrial Applications by Type – Cosmetics & Personal Care Products, Papermaking, Pharmaceuticals and Other Industrial Applications in USD Million
Chart 71: Glance at 2012, 2017 and 2022 Canadian Starch Derivatives Market Share (%) in Industrial Applications by Type – Cosmetics & Personal Care Products, Papermaking, Pharmaceuticals and Other Industrial Applications
EUROPE
Chart 72: European Starch Derivatives Market Analysis (2012-2022) in USD Million
Chart 73: European Starch Derivatives Market Analysis (2012-2022) by Geographic Region – France, Germany, Italy, United Kingdom and Rest of Europe in USD Million
Chart 74: Glance at 2012, 2017 and 2022 European Starch Derivatives Market Share (%) by Geographic Region – France, Germany, Italy, United Kingdom and Rest of Europe
Chart 75: European Starch Derivatives Market Analysis (2012-2022) by Product Segment – Cyclodextrins, Glucose Syrup, Hydrolysates, Maltodextrin and Modified Starches in USD Million
Chart 76: Glance at 2012, 2017 and 2022 European Starch Derivatives Market Share (%) by Product Segment – Cyclodextrins, Glucose Syrup, Hydrolysates, Maltodextrin and Modified Starches
Chart 77: European Starch Derivatives Market Analysis (2012-2022) by Application Area – Food & Feed Applications and Industrial Applications in USD Million
Chart 78: Glance at 2012, 2017 and 2022 European Starch Derivatives Market Share (%) by Application Area – Food & Feed Applications and Industrial Applications
Chart 79: European Starch Derivatives Market Analysis (2012-2022) in Food & Feed Applications by Type – Animal Feed, Confectioneries & Beverages and Processed Foods in USD Million
Chart 80: Glance at 2012, 2017 and 2022 European Starch Derivatives Market Share (%) in Food & Feed Applications Sub-Application – Animal Feed, Confectioneries & Beverages and Processed Foods
Chart 81: European Starch Derivatives Market Analysis (2012-2022) in Industrial Applications by Type – Cosmetics & Personal Care Products, Papermaking, Pharmaceuticals and Other Industrial Applications in USD Million
Chart 82: Glance at 2012, 2017 and 2022 European Starch Derivatives Market Share (%) in Food & Feed Applications by Type – Cosmetics & Personal Care Products, Papermaking, Pharmaceuticals and Other Industrial Applications
France
Chart 83: French Starch Derivatives Market Analysis (2012-2022) in USD Million
Chart 84: French Starch Derivatives Market Analysis (2012-2022) by Product Segment – Cyclodextrins, Glucose Syrup, Hydrolysates, Maltodextrin and Modified Starches in USD Million
Chart 85: Glance at 2012, 2017 and 2022 French Starch Derivatives Market Share (%) by Product Segment – Cyclodextrins, Glucose Syrup, Hydrolysates, Maltodextrin and Modified Starches
Chart 86: French Starch Derivatives Market Analysis (2012-2022) by Application Area – Food & Feed Applications and Industrial Applications in USD Million
Chart 87: Glance at 2012, 2017 and 2022 French Starch Derivatives Market Share (%) by Application Area – Food & Feed Applications and Industrial Applications
Chart 88: French Starch Derivatives Market Analysis (2012-2022) in Food & Feed Applications by Type – Animal Feed, Confectioneries & Beverages and Processed Foods in USD Million
Chart 89: Glance at 2012, 2017 and 2022 French Starch Derivatives Market Share (%) in Food & Feed Applications Sub-Application – Animal Feed, Confectioneries & Beverages and Processed Foods
Chart 90: French Starch Derivatives Market Analysis (2012-2022) in Industrial Applications by Type – Cosmetics & Personal Care Products, Papermaking, Pharmaceuticals and Other Industrial Applications in USD Million
Chart 91: Glance at 2012, 2017 and 2022 French Starch Derivatives Market Share (%) in Food & Feed Applications by Type – Cosmetics & Personal Care Products, Papermaking, Pharmaceuticals and Other Industrial Applications
Germany
Chart 92: German Starch Derivatives Market Analysis (2012-2022) in USD Million
Chart 93: German Starch Derivatives Market Analysis (2012-2022) by Product Segment – Cyclodextrins, Glucose Syrup, Hydrolysates, Maltodextrin and Modified Starches in USD Million
Chart 94: Glance at 2012, 2017 and 2022 German Starch Derivatives Market Share (%) by Product Segment – Cyclodextrins, Glucose Syrup, Hydrolysates, Maltodextrin and Modified Starches
Chart 95: German Starch Derivatives Market Analysis (2012-2022) by Application Area – Food & Feed Applications and Industrial Applications in USD Million
Chart 96: Glance at 2012, 2017 and 2022 German Starch Derivatives Market Share (%) by Application Area – Food & Feed Applications and Industrial Applications
Chart 97: German Starch Derivatives Market Analysis (2012-2022) in Food & Feed Applications by Type – Animal Feed, Confectioneries & Beverages and Processed Foods in USD Million
Chart 98: Glance at 2012, 2017 and 2022 German Starch Derivatives Market Share (%) in Food & Feed Applications Sub-Application – Animal Feed, Confectioneries & Beverages and Processed Foods
Chart 99: German Starch Derivatives Market Analysis (2012-2022) in Industrial Applications by Type – Cosmetics & Personal Care Products, Papermaking, Pharmaceuticals and Other Industrial Applications in USD Million
Chart 100: Glance at 2012, 2017 and 2022 German Starch Derivatives Market Share (%) in Food & Feed Applications by Type – Cosmetics & Personal Care Products, Papermaking, Pharmaceuticals and Other Industrial Applications
Italy
Chart 101: Italian Starch Derivatives Market Analysis (2012-2022) in USD Million
Chart 102: Italian Starch Derivatives Market Analysis (2012-2022) by Product Segment – Cyclodextrins, Glucose Syrup, Hydrolysates, Maltodextrin and Modified Starches in USD Million
Chart 103: Glance at 2012, 2017 and 2022 Italian Starch Derivatives Market Share (%) by Product Segment – Cyclodextrins, Glucose Syrup, Hydrolysates, Maltodextrin and Modified Starches
Chart 104: Italian Starch Derivatives Market Analysis (2012-2022) by Application Area – Food & Feed Applications and Industrial Applications in USD Million
Chart 105: Glance at 2012, 2017 and 2022 Italian Starch Derivatives Market Share (%) by Application Area – Food & Feed Applications and Industrial Applications
Chart 106: Italian Starch Derivatives Market Analysis (2012-2022) in Food & Feed Applications by Type – Animal Feed, Confectioneries & Beverages and Processed Foods in USD Million
Chart 107: Glance at 2012, 2017 and 2022 Italian Starch Derivatives Market Share (%) in Food & Feed Applications Sub-Application – Animal Feed, Confectioneries & Beverages and Processed Foods
Chart 108: Italian Starch Derivatives Market Analysis (2012-2022) in Industrial Applications by Type – Cosmetics & Personal Care Products, Papermaking, Pharmaceuticals and Other Industrial Applications in USD Million
Chart 109: Glance at 2012, 2017 and 2022 Italian Starch Derivatives Market Share (%) in Food & Feed Applications by Type – Cosmetics & Personal Care Products, Papermaking, Pharmaceuticals and Other Industrial Applications
The United Kingdom
Chart 110: United Kingdom Starch Derivatives Market Analysis (2012-2022) in USD Million
Chart 111: United Kingdom Starch Derivatives Market Analysis (2012-2022) by Product Segment – Cyclodextrins, Glucose Syrup, Hydrolysates, Maltodextrin and Modified Starches in USD Million
Chart 112: Glance at 2012, 2017 and 2022 United Kingdom Starch Derivatives Market Share (%) by Product Segment – Cyclodextrins, Glucose Syrup, Hydrolysates, Maltodextrin and Modified Starches
Chart 113: United Kingdom Starch Derivatives Market Analysis (2012-2022) by Application Area – Food & Feed Applications and Industrial Applications in USD Million
Chart 114: Glance at 2012, 2017 and 2022 United Kingdom Starch Derivatives Market Share (%) by Application Area – Food & Feed Applications and Industrial Applications
Chart 115: United Kingdom Starch Derivatives Market Analysis (2012-2022) in Food & Feed Applications by Type – Animal Feed, Confectioneries & Beverages and Processed Foods in USD Million
Chart 116: Glance at 2012, 2017 and 2022 United Kingdom Starch Derivatives Market Share (%) in Food & Feed Applications Sub-Application – Animal Feed, Confectioneries & Beverages and Processed Foods
Chart 117: United Kingdom Starch Derivatives Market Analysis (2012-2022) in Industrial Applications by Type – Cosmetics & Personal Care Products, Papermaking, Pharmaceuticals and Other Industrial Applications in USD Million
Chart 118: Glance at 2012, 2017 and 2022 United Kingdom Starch Derivatives Market Share (%) in Food & Feed Applications by Type – Cosmetics & Personal Care Products, Papermaking, Pharmaceuticals and Other Industrial Applications
Rest of Europe
Chart 119: Rest of Europe Starch Derivatives Market Analysis (2012-2022) in USD Million
Chart 120: Rest of Europe Starch Derivatives Market Analysis (2012-2022) by Product Segment – Cyclodextrins, Glucose Syrup, Hydrolysates, Maltodextrin and Modified Starches in USD Million
Chart 121: Glance at 2012, 2017 and 2022 Rest of Europe Starch Derivatives Market Share (%) by Product Segment – Cyclodextrins, Glucose Syrup, Hydrolysates, Maltodextrin and Modified Starches
Chart 122: Rest of Europe Starch Derivatives Market Analysis (2012-2022) by Application Area – Food & Feed Applications and Industrial Applications in USD Million
Chart 123: Glance at 2012, 2017 and 2022 Rest of Europe Starch Derivatives Market Share (%) by Application Area – Food & Feed Applications and Industrial Applications
Chart 124: Rest of Europe Starch Derivatives Market Analysis (2012-2022) in Food & Feed Applications by Type – Animal Feed, Confectioneries & Beverages and Processed Foods in USD Million
Chart 125: Glance at 2012, 2017 and 2022 Rest of Europe Starch Derivatives Market Share (%) in Food & Feed Applications Sub-Application – Animal Feed, Confectioneries & Beverages and Processed Foods
Chart 126: Rest of Europe Starch Derivatives Market Analysis (2012-2022) in Industrial Applications by Type – Cosmetics & Personal Care Products, Papermaking, Pharmaceuticals and Other Industrial Applications in USD Million
Chart 127: Glance at 2012, 2017 and 2022 Rest of Europe Starch Derivatives Market Share (%) in Food & Feed Applications by Type – Cosmetics & Personal Care Products, Papermaking, Pharmaceuticals and Other Industrial Applications
ASIA-PACIFIC
Chart 128: Asia-Pacific Starch Derivatives Market Analysis (2012-2022) in USD Million
Chart 129: Asia-Pacific Starch Derivatives Market Analysis (2012-2022) by Geographic Region – Australia, China, India, Japan, South Korea and Rest of Asia-Pacific in USD Million
Chart 130: Glance at 2012, 2017 and 2022 Asia-Pacific Starch Derivatives Market Share (%) by Geographic Region – Australia, China, India, Japan, South Korea and Rest of Asia-Pacific
Chart 131: Asia-Pacific Starch Derivatives Market Analysis (2012-2022) by Product Segment – Cyclodextrins, Glucose Syrup, Hydrolysates, Maltodextrin and Modified Starches in USD Million
Chart 132: Glance at 2012, 2017 and 2022 Asia-Pacific Starch Derivatives Market Share (%) by Product Segment – Cyclodextrins, Glucose Syrup, Hydrolysates, Maltodextrin and Modified Starches
Chart 133: Asia-Pacific Starch Derivatives Market Analysis (2012-2022) by Application Area – Food & Feed Applications and Industrial Applications in USD Million
Chart 134: Glance at 2012, 2017 and 2022 Asia-Pacific Starch Derivatives Market Share (%) by Application Area – Food & Feed Applications and Industrial Applications
Chart 135: Asia-Pacific Starch Derivatives Market Analysis (2012-2022) in Food & Feed Applications by Type – Animal Feed, Confectioneries & Beverages and Processed Foods in USD Million
Chart 136: Glance at 2012, 2017 and 2022 Asia-Pacific Starch Derivatives Market Share (%) in Food & Feed Applications Sub-Application – Animal Feed, Confectioneries & Beverages and Processed Foods
Chart 137: Asia-Pacific Starch Derivatives Market Analysis (2012-2022) in Industrial Applications by Type – Cosmetics & Personal Care Products, Papermaking, Pharmaceuticals and Other Industrial Applications in USD Million
Chart 138: Glance at 2012, 2017 and 2022 Asia-Pacific Starch Derivatives Market Share (%) in Food & Feed Applications by Type – Cosmetics & Personal Care Products, Papermaking, Pharmaceuticals and Other Industrial Applications
Australia
Chart 139: Australian Starch Derivatives Market Analysis (2012-2022) in USD Million
Chart 140: Australian Starch Derivatives Market Analysis (2012-2022) by Product Segment – Cyclodextrins, Glucose Syrup, Hydrolysates, Maltodextrin and Modified Starches in USD Million
Chart 141: Glance at 2012, 2017 and 2022 Australian Starch Derivatives Market Share (%) by Product Segment – Cyclodextrins, Glucose Syrup, Hydrolysates, Maltodextrin and Modified Starches
Chart 142: Australian Starch Derivatives Market Analysis (2012-2022) by Application Area – Food & Feed Applications and Industrial Applications in USD Million
Chart 143: Glance at 2012, 2017 and 2022 Australian Starch Derivatives Market Share (%) by Application Area – Food & Feed Applications and Industrial Applications
Chart 144: Australian Starch Derivatives Market Analysis (2012-2022) in Food & Feed Applications by Type – Animal Feed, Confectioneries & Beverages and Processed Foods in USD Million
Chart 145: Glance at 2012, 2017 and 2022 Australian Starch Derivatives Market Share (%) in Food & Feed Applications Sub-Application – Animal Feed, Confectioneries & Beverages and Processed Foods
Chart 146: Australian Starch Derivatives Market Analysis (2012-2022) in Industrial Applications by Type – Cosmetics & Personal Care Products, Papermaking, Pharmaceuticals and Other Industrial Applications in USD Million
Chart 147: Glance at 2012, 2017 and 2022 Australian Starch Derivatives Market Share (%) in Food & Feed Applications by Type – Cosmetics & Personal Care Products, Papermaking, Pharmaceuticals and Other Industrial Applications
China
Chart 148: Chinese Starch Derivatives Market Analysis (2012-2022) in USD Million
Chart 149: Chinese Starch Derivatives Market Analysis (2012-2022) by Product Segment – Cyclodextrins, Glucose Syrup, Hydrolysates, Maltodextrin and Modified Starches in USD Million
Chart 150: Glance at 2012, 2017 and 2022 Chinese Starch Derivatives Market Share (%) by Product Segment – Cyclodextrins, Glucose Syrup, Hydrolysates, Maltodextrin and Modified Starches
Chart 151: Chinese Starch Derivatives Market Analysis (2012-2022) by Application Area – Food & Feed Applications and Industrial Applications in USD Million
Chart 152: Glance at 2012, 2017 and 2022 Chinese Starch Derivatives Market Share (%) by Application Area – Food & Feed Applications and Industrial Applications
Chart 153: Chinese Starch Derivatives Market Analysis (2012-2022) in Food & Feed Applications by Type – Animal Feed, Confectioneries & Beverages and Processed Foods in USD Million
Chart 154: Glance at 2012, 2017 and 2022 Chinese Starch Derivatives Market Share (%) in Food & Feed Applications Sub-Application – Animal Feed, Confectioneries & Beverages and Processed Foods
Chart 155: Chinese Starch Derivatives Market Analysis (2012-2022) in Industrial Applications by Type – Cosmetics & Personal Care Products, Papermaking, Pharmaceuticals and Other Industrial Applications in USD Million
Chart 156: Glance at 2012, 2017 and 2022 Chinese Starch Derivatives Market Share (%) in Food & Feed Applications by Type – Cosmetics & Personal Care Products, Papermaking, Pharmaceuticals and Other Industrial Applications
India
Chart 157: Indian Starch Derivatives Market Analysis (2012-2022) in USD Million
Chart 158: Indian Starch Derivatives Market Analysis (2012-2022) by Product Segment – Cyclodextrins, Glucose Syrup, Hydrolysates, Maltodextrin and Modified Starches in USD Million
Chart 159: Glance at 2012, 2017 and 2022 Indian Starch Derivatives Market Share (%) by Product Segment – Cyclodextrins, Glucose Syrup, Hydrolysates, Maltodextrin and Modified Starches
Chart 160: Indian Starch Derivatives Market Analysis (2012-2022) by Application Area – Food & Feed Applications and Industrial Applications in USD Million
Chart 161: Glance at 2012, 2017 and 2022 Indian Starch Derivatives Market Share (%) by Application Area – Food & Feed Applications and Industrial Applications
Chart 162: Indian Starch Derivatives Market Analysis (2012-2022) in Food & Feed Applications by Type – Animal Feed, Confectioneries & Beverages and Processed Foods in USD Million
Chart 163: Glance at 2012, 2017 and 2022 Indian Starch Derivatives Market Share (%) in Food & Feed Applications Sub-Application – Animal Feed, Confectioneries & Beverages and Processed Foods
Chart 164: Indian Starch Derivatives Market Analysis (2012-2022) in Industrial Applications by Type – Cosmetics & Personal Care Products, Papermaking, Pharmaceuticals and Other Industrial Applications in USD Million
Chart 165: Glance at 2012, 2017 and 2022 Indian Starch Derivatives Market Share (%) in Food & Feed Applications by Type – Cosmetics & Personal Care Products, Papermaking, Pharmaceuticals and Other Industrial Applications
Japan
Chart 166: Japanese Starch Derivatives Market Analysis (2012-2022) in USD Million
Chart 167: Japanese Starch Derivatives Market Analysis (2012-2022) by Product Segment – Cyclodextrins, Glucose Syrup, Hydrolysates, Maltodextrin and Modified Starches in USD Million
Chart 168: Glance at 2012, 2017 and 2022 Japanese Starch Derivatives Market Share (%) by Product Segment – Cyclodextrins, Glucose Syrup, Hydrolysates, Maltodextrin and Modified Starches
Chart 169: Japanese Starch Derivatives Market Analysis (2012-2022) by Application Area – Food & Feed Applications and Industrial Applications in USD Million
Chart 170: Glance at 2012, 2017 and 2022 Japanese Starch Derivatives Market Share (%) by Application Area – Food & Feed Applications and Industrial Applications
Chart 171: Japanese Starch Derivatives Market Analysis (2012-2022) in Food & Feed Applications by Type – Animal Feed, Confectioneries & Beverages and Processed Foods in USD Million
Chart 172: Glance at 2012, 2017 and 2022 Japanese Starch Derivatives Market Share (%) in Food & Feed Applications Sub-Application – Animal Feed, Confectioneries & Beverages and Processed Foods
Chart 173: Japanese Starch Derivatives Market Analysis (2012-2022) in Industrial Applications by Type – Cosmetics & Personal Care Products, Papermaking, Pharmaceuticals and Other Industrial Applications in USD Million
Chart 174: Glance at 2012, 2017 and 2022 Japanese Starch Derivatives Market Share (%) in Food & Feed Applications by Type – Cosmetics & Personal Care Products, Papermaking, Pharmaceuticals and Other Industrial Applications
South Korea
Chart 175: South Korean Starch Derivatives Market Analysis (2012-2022) in USD Million
Chart 176: South Korean Starch Derivatives Market Analysis (2012-2022) by Product Segment – Cyclodextrins, Glucose Syrup, Hydrolysates, Maltodextrin and Modified Starches in USD Million
Chart 177: Glance at 2012, 2017 and 2022 South Korean Starch Derivatives Market Share (%) by Product Segment – Cyclodextrins, Glucose Syrup, Hydrolysates, Maltodextrin and Modified Starches
Chart 178: South Korean Starch Derivatives Market Analysis (2012-2022) by Application Area – Food & Feed Applications and Industrial Applications in USD Million
Chart 179: Glance at 2012, 2017 and 2022 South Korean Starch Derivatives Market Share (%) by Application Area – Food & Feed Applications and Industrial Applications
Chart 180: South Korean Starch Derivatives Market Analysis (2012-2022) in Food & Feed Applications by Type – Animal Feed, Confectioneries & Beverages and Processed Foods in USD Million
Chart 181: Glance at 2012, 2017 and 2022 South Korean Starch Derivatives Market Share (%) in Food & Feed Applications Sub-Application – Animal Feed, Confectioneries & Beverages and Processed Foods
Chart 182: South Korean Starch Derivatives Market Analysis (2012-2022) in Industrial Applications by Type – Cosmetics & Personal Care Products, Papermaking, Pharmaceuticals and Other Industrial Applications in USD Million
Chart 183: Glance at 2012, 2017 and 2022 South Korean Starch Derivatives Market Share (%) in Food & Feed Applications by Type – Cosmetics & Personal Care Products, Papermaking, Pharmaceuticals and Other Industrial Applications
Rest of Asia-Pacific
Chart 184: Rest of Asia-Pacific Starch Derivatives Market Analysis (2012-2022) in USD Million
Chart 185: Rest of Asia-Pacific Starch Derivatives Market Analysis (2012-2022) by Product Segment – Cyclodextrins, Glucose Syrup, Hydrolysates, Maltodextrin and Modified Starches in USD Million
Chart 186: Glance at 2012, 2017 and 2022 Rest of Asia-Pacific Starch Derivatives Market Share (%) by Product Segment – Cyclodextrins, Glucose Syrup, Hydrolysates, Maltodextrin and Modified Starches
Chart 187: Rest of Asia-Pacific Starch Derivatives Market Analysis (2012-2022) by Application Area – Food & Feed Applications and Industrial Applications in USD Million
Chart 188: Glance at 2012, 2017 and 2022 Rest of Asia-Pacific Starch Derivatives Market Share (%) by Application Area – Food & Feed Applications and Industrial Applications
Chart 189: Rest of Asia-Pacific Starch Derivatives Market Analysis (2012-2022) in Food & Feed Applications by Type – Animal Feed, Confectioneries & Beverages and Processed Foods in USD Million
Chart 190: Glance at 2012, 2017 and 2022 Rest of Asia-Pacific Starch Derivatives Market Share (%) in Food & Feed Applications Sub-Application – Animal Feed, Confectioneries & Beverages and Processed Foods
Chart 191: Rest of Asia-Pacific Starch Derivatives Market Analysis (2012-2022) in Industrial Applications by Type – Cosmetics & Personal Care Products, Papermaking, Pharmaceuticals and Other Industrial Applications in USD Million
Chart 192: Glance at 2012, 2017 and 2022 Rest of Asia-Pacific Starch Derivatives Market Share (%) in Food & Feed Applications by Type – Cosmetics & Personal Care Products, Papermaking, Pharmaceuticals and Other Industrial Applications
LATIN AMERICA
Chart 193: Latin American Starch Derivatives Market Analysis (2012-2022) in USD Million
Chart 194: Latin American Starch Derivatives Market Analysis (2012-2022) by Geographic Region – Argentina, Brazil, Mexico and Rest of Latin America in USD Million
Chart 195: Glance at 2012, 2017 and 2022 Latin American Starch Derivatives Market Share (%) by Geographic Region – Argentina, Brazil, Mexico and Rest of Latin America
Chart 196: Latin American Starch Derivatives Market Analysis (2012-2022) by Product Segment – Cyclodextrins, Glucose Syrup, Hydrolysates, Maltodextrin and Modified Starches in USD Million
Chart 197: Glance at 2012, 2017 and 2022 Latin American Starch Derivatives Market Share (%) by Product Segment – Cyclodextrins, Glucose Syrup, Hydrolysates, Maltodextrin and Modified Starches
Chart 198: Latin American Starch Derivatives Market Analysis (2012-2022) by Application Area – Food & Feed Applications and Industrial Applications in USD Million
Chart 199: Glance at 2012, 2017 and 2022 Latin American Starch Derivatives Market Share (%) by Application Area – Food & Feed Applications and Industrial Applications
Chart 200: Latin American Starch Derivatives Market Analysis (2012-2022) in Food & Feed Applications by Type – Animal Feed, Confectioneries & Beverages and Processed Foods in USD Million
Chart 201: Glance at 2012, 2017 and 2022 Latin American Starch Derivatives Market Share (%) in Food & Feed Applications Sub-Application – Animal Feed, Confectioneries & Beverages and Processed Foods
Chart 202: Latin American Starch Derivatives Market Analysis (2012-2022) in Industrial Applications by Type – Cosmetics & Personal Care Products, Papermaking, Pharmaceuticals and Other Industrial Applications in USD Million
Chart 203: Glance at 2012, 2017 and 2022 Latin American Starch Derivatives Market Share (%) in Food & Feed Applications by Type – Cosmetics & Personal Care Products, Papermaking, Pharmaceuticals and Other Industrial Applications
Argentina
Chart 204: Argentine Starch Derivatives Market Analysis (2012-2022) in USD Million
Chart 205: Argentine Starch Derivatives Market Analysis (2012-2022) by Product Segment – Cyclodextrins, Glucose Syrup, Hydrolysates, Maltodextrin and Modified Starches in USD Million
Chart 206: Glance at 2012, 2017 and 2022 Argentine Starch Derivatives Market Share (%) by Product Segment – Cyclodextrins, Glucose Syrup, Hydrolysates, Maltodextrin and Modified Starches
Chart 207: Argentine Starch Derivatives Market Analysis (2012-2022) by Application Area – Food & Feed Applications and Industrial Applications in USD Million
Chart 208: Glance at 2012, 2017 and 2022 Argentine Starch Derivatives Market Share (%) by Application Area – Food & Feed Applications and Industrial Applications
Chart 209: Argentine Starch Derivatives Market Analysis (2012-2022) in Food & Feed Applications by Type – Animal Feed, Confectioneries & Beverages and Processed Foods in USD Million
Chart 210: Glance at 2012, 2017 and 2022 Argentine Starch Derivatives Market Share (%) in Food & Feed Applications Sub-Application – Animal Feed, Confectioneries & Beverages and Processed Foods
Chart 211: Argentine Starch Derivatives Market Analysis (2012-2022) in Industrial Applications by Type – Cosmetics & Personal Care Products, Papermaking, Pharmaceuticals and Other Industrial Applications in USD Million
Chart 212: Glance at 2012, 2017 and 2022 Argentine Starch Derivatives Market Share (%) in Food & Feed Applications by Type – Cosmetics & Personal Care Products, Papermaking, Pharmaceuticals and Other Industrial Applications
Brazil
Chart 213: Brazilian Starch Derivatives Market Analysis (2012-2022) in USD Million
Chart 214: Brazilian Starch Derivatives Market Analysis (2012-2022) by Product Segment – Cyclodextrins, Glucose Syrup, Hydrolysates, Maltodextrin and Modified Starches in USD Million
Chart 215: Glance at 2012, 2017 and 2022 Brazilian Starch Derivatives Market Share (%) by Product Segment – Cyclodextrins, Glucose Syrup, Hydrolysates, Maltodextrin and Modified Starches
Chart 216: Brazilian Starch Derivatives Market Analysis (2012-2022) by Application Area – Food & Feed Applications and Industrial Applications in USD Million
Chart 217: Glance at 2012, 2017 and 2022 Brazilian Starch Derivatives Market Share (%) by Application Area – Food & Feed Applications and Industrial Applications
Chart 218: Brazilian Starch Derivatives Market Analysis (2012-2022) in Food & Feed Applications by Type – Animal Feed, Confectioneries & Beverages and Processed Foods in USD Million
Chart 219: Glance at 2012, 2017 and 2022 Brazilian Starch Derivatives Market Share (%) in Food & Feed Applications Sub-Application – Animal Feed, Confectioneries & Beverages and Processed Foods
Chart 220: Brazilian Starch Derivatives Market Analysis (2012-2022) in Industrial Applications by Type – Cosmetics & Personal Care Products, Papermaking, Pharmaceuticals and Other Industrial Applications in USD Million
Chart 221: Glance at 2012, 2017 and 2022 Brazilian Starch Derivatives Market Share (%) in Food & Feed Applications by Type – Cosmetics & Personal Care Products, Papermaking, Pharmaceuticals and Other Industrial Applications
Mexico
Chart 222: Mexican Starch Derivatives Market Analysis (2012-2022) in USD Million
Chart 223: Mexican Starch Derivatives Market Analysis (2012-2022) by Product Segment – Cyclodextrins, Glucose Syrup, Hydrolysates, Maltodextrin and Modified Starches in USD Million
Chart 224: Glance at 2012, 2017 and 2022 Mexican Starch Derivatives Market Share (%) by Product Segment – Cyclodextrins, Glucose Syrup, Hydrolysates, Maltodextrin and Modified Starches
Chart 225: Mexican Starch Derivatives Market Analysis (2012-2022) by Application Area – Food & Feed Applications and Industrial Applications in USD Million
Chart 226: Glance at 2012, 2017 and 2022 Mexican Starch Derivatives Market Share (%) by Application Area – Food & Feed Applications and Industrial Applications
Chart 227: Mexican Starch Derivatives Market Analysis (2012-2022) in Food & Feed Applications by Type – Animal Feed, Confectioneries & Beverages and Processed Foods in USD Million
Chart 228: Glance at 2012, 2017 and 2022 Mexican Starch Derivatives Market Share (%) in Food & Feed Applications Sub-Application – Animal Feed, Confectioneries & Beverages and Processed Foods
Chart 229: Mexican Starch Derivatives Market Analysis (2012-2022) in Industrial Applications by Type – Cosmetics & Personal Care Products, Papermaking, Pharmaceuticals and Other Industrial Applications in USD Million
Chart 230: Glance at 2012, 2017 and 2022 Mexican Starch Derivatives Market Share (%) in Food & Feed Applications by Type – Cosmetics & Personal Care Products, Papermaking, Pharmaceuticals and Other Industrial Applications
Rest of Latin America
Chart 231: Rest of Latin America Starch Derivatives Market Analysis (2012-2022) in USD Million
Chart 232: Rest of Latin America Starch Derivatives Market Analysis (2012-2022) by Product Segment – Cyclodextrins, Glucose Syrup, Hydrolysates, Maltodextrin and Modified Starches in USD Million
Chart 233: Glance at 2012, 2017 and 2022 Rest of Latin America Starch Derivatives Market Share (%) by Product Segment – Cyclodextrins, Glucose Syrup, Hydrolysates, Maltodextrin and Modified Starches
Chart 234: Rest of Latin America Starch Derivatives Market Analysis (2012-2022) by Application Area – Food & Feed Applications and Industrial Applications in USD Million
Chart 235: Glance at 2012, 2017 and 2022 Rest of Latin America Starch Derivatives Market Share (%) by Application Area – Food & Feed Applications and Industrial Applications
Chart 236: Rest of Latin America Starch Derivatives Market Analysis (2012-2022) in Food & Feed Applications by Type – Animal Feed, Confectioneries & Beverages and Processed Foods in USD Million
Chart 237: Glance at 2012, 2017 and 2022 Rest of Latin America Starch Derivatives Market Share (%) in Food & Feed Applications Sub-Application – Animal Feed, Confectioneries & Beverages and Processed Foods
Chart 238: Rest of Latin America Starch Derivatives Market Analysis (2012-2022) in Industrial Applications by Type – Cosmetics & Personal Care Products, Papermaking, Pharmaceuticals and Other Industrial Applications in USD Million
Chart 239: Glance at 2012, 2017 and 2022 Rest of Latin America Starch Derivatives Market Share (%) in Food & Feed Applications by Type – Cosmetics & Personal Care Products, Papermaking, Pharmaceuticals and Other Industrial Applications
REST OF WORLD
Chart 240: Rest of World Starch Derivatives Market Analysis (2012-2022) in USD Million
Chart 241: Rest of World Starch Derivatives Market Analysis (2012-2022) by Product Segment – Cyclodextrins, Glucose Syrup, Hydrolysates, Maltodextrin and Modified Starches in USD Million
Chart 242: Glance at 2012, 2017 and 2022 Rest of World Starch Derivatives Market Share (%) by Product Segment – Cyclodextrins, Glucose Syrup, Hydrolysates, Maltodextrin and Modified Starches
Chart 243: Rest of World Starch Derivatives Market Analysis (2012-2022) by Application Area – Food & Feed Applications and Industrial Applications in USD Million
Chart 244: Glance at 2012, 2017 and 2022 Rest of World Starch Derivatives Market Share (%) by Application Area – Food & Feed Applications and Industrial Applications
Chart 245: Rest of World Starch Derivatives Market Analysis (2012-2022) in Food & Feed Applications by Type – Animal Feed, Confectioneries & Beverages and Processed Foods in USD Million
Chart 246: Glance at 2012, 2017 and 2022 Rest of World Starch Derivatives Market Share (%) in Food & Feed Applications Sub-Application – Animal Feed, Confectioneries & Beverages and Processed Foods
Chart 247: Rest of World Starch Derivatives Market Analysis (2012-2022) in Industrial Applications by Type – Cosmetics & Personal Care Products, Papermaking, Pharmaceuticals and Other Industrial Applications in USD Million
Chart 248: Glance at 2012, 2017 and 2022 Rest of World Starch Derivatives Market Share (%) in Food & Feed Applications by Type – Cosmetics & Personal Care Products, Papermaking, Pharmaceuticals and Other Industrial Applications
Tables:
Table 1: Major Properties of the Three Main Categories of Cyclodextrins
Table 2: Enzymes Used in Starch Hydrolysis
Table 3: Sugar Spectra of Glucose Syrups Produced Using Different Methods of Starch Hydrolysis
Table 4: Effects of Temperatures and Solids on the Viscosity of Glucose Syrups
Table 5: Typical Sweetness Levels of Various Glucose Syrups Compared to Sucrose, Dextrose and Fructose
Table 6: Typical Sugar Analysis of 42 DE and Lower Syrups
Table 7: Various Applications of 63 DE Glucose Syrup
Table 8: Various Applications of 95 DE Glucose Syrup
Table 9: Sweetness Values of HFGS Compared to Sugar
Table 10: Various Applications of HFGS
Table 11: Various Applications of Low-DE (< 20) Glucose Syrups or Maltodextrins
Table 12: Various Sources and Requirements of Applications of Modified starches
Table 13: Classification of Currently Avaialble Modified starches
Table 14: Various Clean Label Starches and their Applications
Table 15: Non-Conventional Sources of Starch along with their Potential Applications
Table 16: Chemical Modification of Modified Starches – Relevance in Pharmaceutical Applications
Table 17: Physical Modification of Modified Starches – Relevance in Pharmaceutical Applications
Table 18: Enzymatic Modification of Modified Starches – Relevance in Pharmaceutical Applications
Agrana Group
Archer Daniels Midland
Avebe U.A.
Beneo GmbH
Cargill, Inc.
China Essence Group Ltd.
Emsland Group
Emsland Starke GmbH
Global Bio-Chem Technology Group Company Limited
Grain Processing Corporation
Ingredion, Inc.
Lasenor Emul S.L.
Lipoid GmbH
Roquette Freres
San Soon Seng Food Industry Sdn Bhd
Stern-Wywiol Gruppe GmbH & Co., KG.
Tate & Lyle Plc
Zhucheng Dongxiao Biotechnology Co
Take Advantage of Year-end Discounts!
Click "Avail Offer", and email us to get the discount!
20% off
Offer ends Jan 31, 2026
RELATED REPORTS
Plant-Based Meat - A Global Market Overview
Report Code: FNB088 | Pages: 511 | Price: $4950
Published
Sep 2025
Health & Wellness Foods - A Global Market Overview
Report Code: FNB072 | Pages: 457 | Price: $4950
Published
Sep 2025
Dehydrated Foods - A Global Market Overview
Report Code: FNB039 | Pages: 392 | Price: $4950
Published
Sep 2025
Global Taste Modulators Market - Types, Sources, Forms and Applications
Report Code: FNB107 | Pages: 401 | Price: $4950
Published
Aug 2025

Global Fat Replacers Market - Types, Sources, Forms and Applications
Report Code: FNB040 | Pages: 363 | Price: $4500
Published
Aug 2025