Report Synopsis
Precipitated silica offers several advantages in the production of tires compared to its counterpart carbon black. It improves tensile strength, abrasion resistance, and yields a lower rolling resistance and better wet grip at equal wear resistance than carbon black. In the tire industry, both conventional and highly dispersible precipitated silicas are used. Highly dispersible precipitated silica is used in tires due to its better dispersibility making it better reinforcing filler in tires than conventional precipitated silica. In response to the burgeoning demand from the tire industry for precipitated silica, several industry players such as Evonik, Solvay and PPG Industries has ramped their production capacities in the recent past.
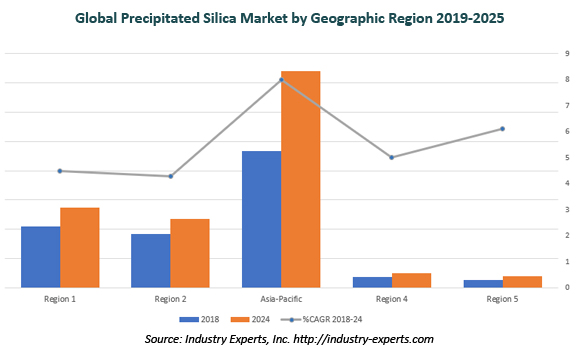
Asia-Pacific is the largest region for the global precipitated silica market with 56.2% share in 2019, followed by Europe with 25.3%. The region is also forecasted to lead the growth of global precipitated silica market at a 2019 to 2025 CAGR of 7.6% to reach 2.3 million metric tons by 2025.
Research Findings & Coverage
- The market for Precipitated Silica is explored in this study with respect to major applications
- The study exclusively analyzes the market size of Precipitated Silica in each major region/country globally for the analysis period
- Performance of Highly Dispersible Silica Surpasses Conventional Precipitated Silica
- Silica Producers Expand Capacities in Response to Demand from Tire Industry
- Key business trends focusing on product innovations/developments, M&As, JVs and other recent industry developments
- Major companies profiled – 48
- The industry guide includes the contact details for 70 companies
Product Outline
The report analyzes the market for the key applications of Precipitated Silica including:
- Tire Rubber
- Non-tire Rubber
- Personal Care & Cosmetics
- Plastics
- Chemicals
- Agriculture & Animal Feed
- Food & Beverages
- Paints, Coatings & Inks
- Paper & Textiles
- Adhesives & Sealants
- Other Precipitated Silica
Analysis Period, Units and Growth Rates
- The report reviews, analyzes and projects the global Precipitated Silica market for the period 2016-2025 in terms of volume in Metric Tons and value in US$ and the compound annual growth rates (CAGRs) projected from 2019 through 2025
Geographic Coverage
- North America (The United States, Canada and Mexico)
- Europe (France, Germany, Italy, Russia, Spain, the United Kingdom and Rest of Europe)
- Asia-Pacific (China, Japan, India, South Korea and Rest of Asia-Pacific)
- South America (Brazil and Rest of South America)
- Rest of World
PART A: GLOBAL MARKET PERSPECTIVE
1. INTRODUCTION
Market Trends and Drivers
1.1 Product Outline
1.1.1 Specialty Silicas or Synthetic Amorphous Silicas
1.1.1.1 Physical and Chemical Properties of Specialty Silicas
1.1.1.2 Purity
1.1.1.3 Particle size
1.1.2 Manufacturing Processes for Specialty Silicas
1.1.2.1 Thermal Process
1.1.2.2 Wet Process
1.1.3 Precipitated Silica
1.1.3.1 Applications of Precipitated Silica
1.1.3.1.1 Tires
1.1.3.1.2 Non-tire rubber
1.1.3.1.3 Food Products
1.1.3.1.4 Personal Care & Cosmetics
1.1.3.1.5 Plastics
1.1.3.1.6 Chemicals
1.1.3.1.7 Agriculture & Animal Feed
1.1.3.1.8 Paints, Coatings & Inks
1.1.3.1.9 Paper & Textiles
1.1.3.1.10 Adhesives & Sealants
1.1.3.1.11 Other Applications
2. KEY GLOBAL PLAYERS
Evonik Industries AG (Germany)
Gujarat Multi Gas Base Chemicals Pvt. Ltd. (China)
Industrias Quimicas del Ebro, S.A. (IQE Group) (Spain)
Madhu Silica Pvt. Ltd. (India)
Oriental Silicas Corporation (Taiwan)
PPG Industries, Inc. (United States)
PQ Corporation (United States)
Quechen Silicon Chemical Co., Ltd. (China)
Solvay S.A. (Belgium)
Tosoh Silica Corporation (Japan)
W.R. Grace & Co. (United States)
3. KEY BUSINESS AND PRODUCT TRENDS
Evonik Introduced New Precipitated Silica Grades for Polymer Films
RV� Technologies Partners with Tricentris for the Transformation of Used Glass to Precipitated Silica
Evonik Introduced New SIPERNAT® Precipitated Silica Grades for use in Cosmetics
Evonik's ULTRASIL® 9100 GR for Use in Truck and Bus Tires
Expansion of Madhu Silica's Precipitated Silica Production Capacity
Launch of Evonik's ACEMATT® 3400 for High-Transparency clear Coatings and Soft-Touch Coatings with Smooth Surfaces
Evonik Opens a New Precipitated Silica Production Plant in South Carolina
New Precipitated Silica Production Plant Opened by Industrias Qu�micas del Ebro
Expansion of Evonik's Precipitated Silica Production Capacity in Turkey
Allied Silica's Precipitated Silica Business Acquired by Tata Chemicals
Launch of Evonik's ULTRASIL® 7800 GR for Large SUV and High Mileage All-Season Tires
Evonik Industries Takeover Silica Business of Huber Engineered Materials
Grace to Takeover Dental Silica and Defoamer Product Ranges from Evonik
Launch of Solvay's New Premium SW Highly Dispersible Silica
Evonik Introduces a New Functional Additive to Substitute Microplastics in Cosmetics
US DOE to Offer Funds to PPG for developing AGILON® Silica-based Performance Fillers
Solvay's New Gunsan Plant is Now Ready to Produce Highly Dispersible Silica
Start of Production in Evonik's New Precipitated Silica Plant in Brazil
PPG Expands Precipitated Silica Production Capacity at Delfzijl Plant
Solvay to add 10,000 Metric Tons of Silica Capacity to its Plant in Chicago Heights, Illinois
US DOE Offers Funds to Support Joint Project of PPG with Bridgestone for Developing Fuel Efficient Tires for Trucks and Buses
Expansion of PPG's Precipitated Silica Capacity at Louisiana Production Plant
4. GLOBAL MARKET OVERVIEW
4.1 Global Precipitated Silica Market Overview by Application
4.1.1 Precipitated Silica Application Market Overview by Global Region
4.1.1.1 Tire Rubber
4.1.1.2 Non-tire Rubber
4.1.1.3 Personal Care & Cosmetics
4.1.1.4 Plastics
4.1.1.5 Chemicals
4.1.1.6 Agriculture & Animal Feed
4.1.1.7 Food & Beverages
4.1.1.8 Paints, Coatings & Inks
4.1.1.9 Paper & Textiles
4.1.1.10 Adhesives & Sealants
4.1.1.11 Other Applications
PART B: REGIONAL MARKET PERSPECTIVE
Global Precipitated Silica Market Overview by Geographic Region
REGIONAL MARKET OVERVIEW
5. NORTH AMERICA
5.1 North American Precipitated Silica Market Overview by Geographic Region
5.2 North American Precipitated Silica Market Overview by Application
5.3 Major Market Players
Applied Material Solutions, Inc. (United States)
Evonik Corporation (United States)
PPG Industries, Inc. (United States)
PQ Corporation (United States)
Solvay USA Inc. (United States)
W.R. Grace & Co. (United States)
5.4 Country-wise Analysis of North American Precipitated Silica Market
5.4.1 The United States
5.4.1.1 United States Precipitated Silica Market Overview by Application
5.4.2 Canada
5.4.2.1 Canadian Precipitated Silica Market Overview by Application
5.4.3 Mexico
5.4.3.1 Mexican Precipitated Silica Market Overview by Application
6. EUROPE
6.1 European Precipitated Silica Market Overview by Geographic Region
6.2 European Precipitated Silica Market Overview by Application
6.3 Major Market Players
Evonik Industries AG (Germany)
Grace GmbH & Co. KG (Germany)
Industrias Quimicas del Ebro, S.A. (IQE Group) (Spain)
JSC "Bashkir Soda Company" (Russia)
PPG Industries Chemicals B.V. (The Netherlands)
Solvay SA (Belgium)
6.4 Country-wise Analysis of European Precipitated Silica Market
6.4.1 France
6.4.1.1 French Precipitated Silica Market Overview by Application
6.4.2 Germany
6.4.2.1 German Precipitated Silica Market Overview by Application
6.4.3 Italy
6.4.3.1 Italian Precipitated Silica Market Overview by Application
6.4.4 Russia
6.4.4.1 Russian Precipitated Silica Market Overview by Application
6.4.5 Spain
6.4.5.1 Spanish Precipitated Silica Market Overview by Application
6.4.6 The United Kingdom
6.4.6.1 United Kingdom Precipitated Silica Market Overview by Application
6.4.7 Rest of Europe
6.4.7.1 Rest of Europe Precipitated Silica Market Overview by Application
7. ASIA-PACIFIC
7.1 Asia-Pacific Precipitated Silica Market Overview by Geographic Region
7.2 Asia-Pacific Precipitated Silica Market Overview by Application
7.3 Major Market Players
Anten Chemical Co., Ltd. (China)
Brisil (India)
Dalian Fuchang Chemical Co., Ltd. (China)
DSL. Japan Co., Ltd. (Japan)
Evonik Specialty Silica India Pvt. Ltd. (India)
Evonik United Silica (Siam) Ltd. (Thailand)
Evonik Wellink Silica (Nanping) Co., Ltd. (China)
Fujian Sanming Tongsheng Chemical Co., Ltd. (China)
Fujian Sanming Zhengyuan Chemical Co., Ltd. (China)
Fujian Zhengsheng Inorganic Material Co., Ltd. (China)
Glassven Yangzhong Silicas and Chemicals J.V. Ltd. (China)
Gujarat Multi Gas Base Chemicals Pvt. Ltd. (China)
Insilco Limited (India)
Iota Silicone Oil (Anhui) Co., Ltd. (China)
Jiangxi Blackcat Carbon Black Co., Ltd. (China)
Jinsha Precipitated Silica Manufacturing Co., Ltd. (China)
LongXing Chemical Stock Co., Ltd. (China)
Madhu Silica Pvt. Ltd. (India)
MLA Group of Industries (India)
Oriental Silicas Corporation (Taiwan)
Quechen Silicon Chemical Co., Ltd. (China)
Sanming Fengrun Chemical Co., Ltd. (China)
Shanxi Tond Chemical Co., Ltd. (China)
Solvay Fine Chemical Additives (Qingdao) Co., Ltd. (China)
Solvay Silica Korea Co., Ltd. (South Korea)
Speciality Silica Private Limited (India)
Supersil Chemicals (I) Pvt. Ltd (India)
Tata Chemicals Limited (India)
Tosoh Silica Corporation (Japan)
W. R. Grace Specialty Chemicals (Malaysia) Sdn Bhd (Malaysia)
Wuxi Hengcheng Silicon Industry Co., Ltd. (China)
7.4 Country-wise Analysis of Asia-Pacific Precipitated Silica Market
7.4.1 China
7.4.1.1 Chinese Precipitated Silica Market Overview by Application
7.4.2 India
7.4.2.1 Indian Precipitated Silica Market Overview by Application
7.4.3 Japan
7.4.3.1 Japanese Precipitated Silica Market Overview by Application
7.4.4 South Korea
7.4.4.1 South Korean Precipitated Silica Market Overview by Application
7.4.5 Rest of Asia-Pacific
7.4.5.1 Rest of Asia-Pacific Precipitated Silica Market Overview by Application
8. SOUTH AMERICA
8.1 South American Precipitated Silica Market Overview by Geographic Region
8.2 South American Precipitated Silica Market Overview by Application
8.3 Major Market Players
Evonik Brasil Ltda. (Brazil)
Glassven C.A. (Venezuela)
Rhodia Brasil Ltda (Brazil)
Rhodia Silices De Venezuela C.A. (Venezuela)
8.4 Country-wise Analysis of South American Precipitated Silica Market
8.4.1 Brazil
8.4.1.1 Brazilian Precipitated Silica Market Overview by Application
8.4.2 Rest of South America
8.4.2.1 Rest of South America Precipitated Silica Market Overview by Application
9. REST OF WORLD
9.1 Rest of World Precipitated Silica Market Overview by Application
9.2 Egesil Kimya Sanayi Ve Ticaret A.S. (Turkey) – A Major Market Player
PART C: GUIDE TO THE INDUSTRY
1. NORTH AMERICA
2. EUROPE
3. ASIA-PACIFIC
4. REST OF WORLD
PART D: ANNEXURE
1. RESEARCH METHODOLOGY
2. FEEDBACK
Charts & Graphs
PART A: GLOBAL MARKET PERSPECTIVE
Chart 1: Global Precipitated Silica Market (2019 & 2025) by Application
Chart 2: Global Precipitated Silica Market (2019 & 2025) by Geographic Region
Chart 3: Global Precipitated Silica Market Analysis (2016-2025) – Volume in Thousand Metric Tons and Value in USD Million
Chart 4: Global Precipitated Silica Market Analysis (2016-2025) by Application – Tire Rubber, Non-tire Rubber, Personal Care & Cosmetics, Plastics, Chemicals, Agriculture & Animal Feed, Food & Beverages, Paints, Coatings & Inks, Paper & Textiles, Adhesives & Sealants and Others in Thousand Metric Tons
Chart 5: Glance at 2016, 2019 and 2025 Global Precipitated Silica Volume Market Share (%) by Application – Tire Rubber, Non-tire Rubber, Personal Care & Cosmetics, Plastics, Chemicals, Agriculture & Animal Feed, Food & Beverages, Paints, Coatings & Inks, Paper & Textiles, Adhesives & Sealants and Others
Chart 6: Global Precipitated Silica Market Analysis (2016-2025) by Application – Tire Rubber, Non-tire Rubber, Personal Care & Cosmetics, Plastics, Chemicals, Agriculture & Animal Feed, Food & Beverages, Paints, Coatings & Inks, Paper & Textiles, Adhesives & Sealants and Others in USD Million
Chart 7: Glance at 2016, 2019 and 2025 Global Precipitated Silica Value Market Share (%) by Application – Tire Rubber, Non-tire Rubber, Personal Care & Cosmetics, Plastics, Chemicals, Agriculture & Animal Feed, Food & Beverages, Paints, Coatings & Inks, Paper & Textiles, Adhesives & Sealants and Others
Chart 8: Global Precipitated Silica Market Analysis (2016-2025) in Tire Rubber by Geographic Region – North America, Europe, Asia-Pacific, South America and Rest of World in Thousand Metric Tons
Chart 9: Glance at 2016, 2019 and 2025 Global Precipitated Silica Volume Market Share (%) in Tire Rubber by Geographic Region – North America, Europe, Asia-Pacific, South America and Rest of World
Chart 10: Global Precipitated Silica Market Analysis (2016-2025) in Tire Rubber by Geographic Region – North America, Europe, Asia-Pacific, South America and Rest of World in USD Million
Chart 11: Glance at 2016, 2019 and 2025 Global Precipitated Silica Value Market Share (%) in Tire Rubber by Geographic Region – North America, Europe, Asia-Pacific, South America and Rest of World
Chart 12: Global Precipitated Silica Market Analysis (2016-2025) in Non-tire Rubber by Geographic Region – North America, Europe, Asia-Pacific, South America and Rest of World in Thousand Metric Tons
Chart 13: Glance at 2016, 2019 and 2025 Global Precipitated Silica Volume Market Share (%) in Non-tire Rubber by Geographic Region – North America, Europe, Asia-Pacific, South America and Rest of World
Chart 14: Global Precipitated Silica Market Analysis (2016-2025) in Non-tire Rubber by Geographic Region – North America, Europe, Asia-Pacific, South America and Rest of World in USD Million
Chart 15: Glance at 2016, 2019 and 2025 Global Precipitated Silica Value Market Share (%) in Non-tire Rubber by Geographic Region – North America, Europe, Asia-Pacific, South America and Rest of World
Chart 16: Global Precipitated Silica Market Analysis (2016-2025) in Personal Care & Cosmetics by Geographic Region – North America, Europe, Asia-Pacific, South America and Rest of World in Thousand Metric Tons
Chart 17: Glance at 2016, 2019 and 2025 Global Precipitated Silica Volume Market Share (%) in Personal Care & Cosmetics by Geographic Region – North America, Europe, Asia-Pacific, South America and Rest of World
Chart 18: Global Precipitated Silica Market Analysis (2016-2025) in Personal Care & Cosmetics by Geographic Region – North America, Europe, Asia-Pacific, South America and Rest of World in USD Million
Chart 19: Glance at 2016, 2019 and 2025 Global Precipitated Silica Value Market Share (%) in Personal Care & Cosmetics by Geographic Region – North America, Europe, Asia-Pacific, South America and Rest of World
Chart 20: Global Precipitated Silica Market Analysis (2016-2025) in Plastics by Geographic Region – North America, Europe, Asia-Pacific, South America and Rest of World in Thousand Metric Tons
Chart 21: Glance at 2016, 2019 and 2025 Global Precipitated Silica Volume Market Share (%) in Plastics by Geographic Region – North America, Europe, Asia-Pacific, South America and Rest of World
Chart 22: Global Precipitated Silica Market Analysis (2016-2025) in Plastics by Geographic Region – North America, Europe, Asia-Pacific, South America and Rest of World in USD Million
Chart 23: Glance at 2016, 2019 and 2025 Global Precipitated Silica Value Market Share (%) in Plastics by Geographic Region – North America, Europe, Asia-Pacific, South America and Rest of World
Chart 24: Global Precipitated Silica Market Analysis (2016-2025) in Chemicals by Geographic Region – North America, Europe, Asia-Pacific, South America and Rest of World in Thousand Metric Tons
Chart 25: Glance at 2016, 2019 and 2025 Global Precipitated Silica Volume Market Share (%) in Chemicals by Geographic Region – North America, Europe, Asia-Pacific, South America and Rest of World
Chart 26: Global Precipitated Silica Market Analysis (2016-2025) in Chemicals by Geographic Region – North America, Europe, Asia-Pacific, South America and Rest of World in USD Million
Chart 27: Glance at 2016, 2019 and 2025 Global Precipitated Silica Value Market Share (%) in Chemicals by Geographic Region – North America, Europe, Asia-Pacific, South America and Rest of World
Chart 28: Global Precipitated Silica Market Analysis (2016-2025) in Agriculture & Animal Feed by Geographic Region – North America, Europe, Asia-Pacific, South America and Rest of World in Thousand Metric Tons
Chart 29: Glance at 2016, 2019 and 2025 Global Precipitated Silica Volume Market Share (%) in Agriculture & Animal Feed by Geographic Region – North America, Europe, Asia-Pacific, South America and Rest of World
Chart 30: Global Precipitated Silica Market Analysis (2016-2025) in Agriculture & Animal Feed by Geographic Region – North America, Europe, Asia-Pacific, South America and Rest of World in USD Million
Chart 31: Glance at 2016, 2019 and 2025 Global Precipitated Silica Value Market Share (%) in Agriculture & Animal Feed by Geographic Region – North America, Europe, Asia-Pacific, South America and Rest of World
Chart 32: Global Precipitated Silica Market Analysis (2016-2025) in Food & Beverages by Geographic Region – North America, Europe, Asia-Pacific, South America and Rest of World in Thousand Metric Tons
Chart 33: Glance at 2016, 2019 and 2025 Global Precipitated Silica Volume Market Share (%) in Food & Beverages by Geographic Region – North America, Europe, Asia-Pacific, South America and Rest of World
Chart 34: Global Precipitated Silica Market Analysis (2016-2025) in Food & Beverages by Geographic Region – North America, Europe, Asia-Pacific, South America and Rest of World in USD Million
Chart 35: Glance at 2016, 2019 and 2025 Global Precipitated Silica Value Market Share (%) in Food & Beverages by Geographic Region – North America, Europe, Asia-Pacific, South America and Rest of World
Chart 36: Global Precipitated Silica Market Analysis (2016-2025) in Paints, Coatings & Inks by Geographic Region – North America, Europe, Asia-Pacific, South America and Rest of World in Thousand Metric Tons
Chart 37: Glance at 2016, 2019 and 2025 Global Precipitated Silica Volume Market Share (%) in Paints, Coatings & Inks by Geographic Region – North America, Europe, Asia-Pacific, South America and Rest of World
Chart 38: Global Precipitated Silica Market Analysis (2016-2025) in Paints, Coatings & Inks by Geographic Region – North America, Europe, Asia-Pacific, South America and Rest of World in USD Million
Chart 39: Glance at 2016, 2019 and 2025 Global Precipitated Silica Value Market Share (%) in Paints, Coatings & Inks by Geographic Region – North America, Europe, Asia-Pacific, South America and Rest of World
Chart 40: Global Precipitated Silica Market Analysis (2016-2025) in Paper & Textiles by Geographic Region – North America, Europe, Asia-Pacific, South America and Rest of World in Thousand Metric Tons
Chart 41: Glance at 2016, 2019 and 2025 Global Precipitated Silica Volume Market Share (%) in Paper & Textiles by Geographic Region – North America, Europe, Asia-Pacific, South America and Rest of World
Chart 42: Global Precipitated Silica Market Analysis (2016-2025) in Paper & Textiles by Geographic Region – North America, Europe, Asia-Pacific, South America and Rest of World in USD Million
Chart 43: Glance at 2016, 2019 and 2025 Global Precipitated Silica Value Market Share (%) in Paper & Textiles by Geographic Region – North America, Europe, Asia-Pacific, South America and Rest of World
Chart 44: Global Precipitated Silica Market Analysis (2016-2025) in Adhesives & Sealants by Geographic Region – North America, Europe, Asia-Pacific, South America and Rest of World in Thousand Metric Tons
Chart 45: Glance at 2016, 2019 and 2025 Global Precipitated Silica Volume Market Share (%) in Adhesives & Sealants by Geographic Region – North America, Europe, Asia-Pacific, South America and Rest of World
Chart 46: Global Precipitated Silica Market Analysis (2016-2025) in Adhesives & Sealants by Geographic Region – North America, Europe, Asia-Pacific, South America and Rest of World in USD Million
Chart 47: Glance at 2016, 2019 and 2025 Global Precipitated Silica Value Market Share (%) in Adhesives & Sealants by Geographic Region – North America, Europe, Asia-Pacific, South America and Rest of World
Chart 48: Global Precipitated Silica Market Analysis (2016-2025) in Other Applications by Geographic Region – North America, Europe, Asia-Pacific, South America and Rest of World in Thousand Metric Tons
Chart 49: Glance at 2016, 2019 and 2025 Global Precipitated Silica Volume Market Share (%) in Other Applications by Geographic Region – North America, Europe, Asia-Pacific, South America and Rest of World
Chart 50: Global Precipitated Silica Market Analysis (2016-2025) in Other Applications by Geographic Region – North America, Europe, Asia-Pacific, South America and Rest of World in USD Million
Chart 51: Glance at 2016, 2019 and 2025 Global Precipitated Silica Value Market Share (%) in Other Applications by Geographic Region – North America, Europe, Asia-Pacific, South America and Rest of World
PART B: REGIONAL MARKET PERSPECTIVE
Chart 52: Global Precipitated Silica Market Analysis (2016-2025) by Geographic Region – North America, Europe, Asia-Pacific, South America and Rest of World in Thousand Metric Tons
Chart 53: Glance at 2016, 2019 and 2025 Global Precipitated Silica Volume Market Share (%) by Geographic Region – North America, Europe, Asia-Pacific, South America and Rest of World
Chart 54: Global Precipitated Silica Market Analysis (2016-2025) by Geographic Region – North America, Europe, Asia-Pacific, South America and Rest of World in USD Million
Chart 55: Glance at 2016, 2019 and 2025 Global Precipitated Silica Value Market Share (%) by Geographic Region – North America, Europe, Asia-Pacific, South America and Rest of World
REGIONAL MARKET OVERVIEW
NORTH AMERICA
Chart 56: North American Precipitated Silica Market Analysis (2016-2025) – Volume in Thousand Metric Tons and Value in USD Million
Chart 57: North American Precipitated Silica Market Analysis (2016-2025) by Geographic Region – The United States, Canada and Mexico in Thousand Metric Tons
Chart 58: Glance at 2016, 2019 and 2025 North American Precipitated Silica Volume Market Share (%) by Geographic Region – The United States, Canada and Mexico
Chart 59: North American Precipitated Silica Market Analysis (2016-2025) by Geographic Region – The United States, Canada and Mexico in USD Million
Chart 60: Glance at 2016, 2019 and 2025 North American Precipitated Silica Value Market Share (%) by Geographic Region – The United States, Canada and Mexico
Chart 61: North American Precipitated Silica Market Analysis (2016-2025) by Application – Tire Rubber, Non-tire Rubber, Personal Care & Cosmetics, Plastics, Chemicals, Agriculture & Animal Feed, Food & Beverages, Paints, Coatings & Inks, Paper & Textiles, Adhesives & Sealants and Others in Thousand Metric Tons
Chart 62: Glance at 2016, 2019 and 2025 North American Precipitated Silica Volume Market Share (%) by Application – Tire Rubber, Non-tire Rubber, Personal Care & Cosmetics, Plastics, Chemicals, Agriculture & Animal Feed, Food & Beverages, Paints, Coatings & Inks, Paper & Textiles, Adhesives & Sealants and Others
Chart 63: North American Precipitated Silica Market Analysis (2016-2025) by Application – Tire Rubber, Non-tire Rubber, Personal Care & Cosmetics, Plastics, Chemicals, Agriculture & Animal Feed, Food & Beverages, Paints, Coatings & Inks, Paper & Textiles, Adhesives & Sealants and Others in USD Million
Chart 64: Glance at 2016, 2019 and 2025 North American Precipitated Silica Value Market Share (%) by Application – Tire Rubber, Non-tire Rubber, Personal Care & Cosmetics, Plastics, Chemicals, Agriculture & Animal Feed, Food & Beverages, Paints, Coatings & Inks, Paper & Textiles, Adhesives & Sealants and Others
The United States
Chart 65: United States Precipitated Silica Market Analysis (2016-2025) – Volume in Thousand Metric Tons and Value in USD Million
Chart 66: United States Precipitated Silica Market Analysis (2016-2025) by Application – Tire Rubber, Non-tire Rubber, Personal Care & Cosmetics, Plastics, Chemicals, Agriculture & Animal Feed, Food & Beverages, Paints, Coatings & Inks, Paper & Textiles, Adhesives & Sealants and Others in Thousand Metric Tons
Chart 67: Glance at 2016, 2019 and 2025 United States Precipitated Silica Volume Market Share (%) by Application – Tire Rubber, Non-tire Rubber, Personal Care & Cosmetics, Plastics, Chemicals, Agriculture & Animal Feed, Food & Beverages, Paints, Coatings & Inks, Paper & Textiles, Adhesives & Sealants and Others
Chart 68: United States Precipitated Silica Market Analysis (2016-2025) by Application – Tire Rubber, Non-tire Rubber, Personal Care & Cosmetics, Plastics, Chemicals, Agriculture & Animal Feed, Food & Beverages, Paints, Coatings & Inks, Paper & Textiles, Adhesives & Sealants and Others in USD Million
Chart 69: Glance at 2016, 2019 and 2025 United States Precipitated Silica Value Market Share (%) by Application – Tire Rubber, Non-tire Rubber, Personal Care & Cosmetics, Plastics, Chemicals, Agriculture & Animal Feed, Food & Beverages, Paints, Coatings & Inks, Paper & Textiles, Adhesives & Sealants and Others
Canada
Chart 70: Canadian Precipitated Silica Market Analysis (2016-2025) – Volume in Thousand Metric Tons and Value in USD Million
Chart 71: Canadian Precipitated Silica Market Analysis (2016-2025) by Application – Tire Rubber, Non-tire Rubber, Personal Care & Cosmetics, Plastics, Chemicals, Agriculture & Animal Feed, Food & Beverages, Paints, Coatings & Inks and Others in Thousand Metric Tons
Chart 72: Glance at 2016, 2019 and 2025 Canadian Precipitated Silica Volume Market Share (%) by Application – Tire Rubber, Non-tire Rubber, Personal Care & Cosmetics, Plastics, Chemicals, Agriculture & Animal Feed, Food & Beverages, Paints, Coatings & Inks and Others
Chart 73: Canadian Precipitated Silica Market Analysis (2016-2025) by Application – Tire Rubber, Non-tire Rubber, Personal Care & Cosmetics, Plastics, Chemicals, Agriculture & Animal Feed, Food & Beverages, Paints, Coatings & Inks and Others in USD Million
Chart 74: Glance at 2016, 2019 and 2025 Canadian Precipitated Silica Value Market Share (%) by Application – Tire Rubber, Non-tire Rubber, Personal Care & Cosmetics, Plastics, Chemicals, Agriculture & Animal Feed, Food & Beverages, Paints, Coatings & Inks and Others
Mexico
Chart 75: Mexican Precipitated Silica Market Analysis (2016-2025) – Volume in Thousand Metric Tons and Value in USD Million
Chart 76: Mexican Precipitated Silica Market Analysis (2016-2025) by Application – Tire Rubber, Non-tire Rubber, Personal Care & Cosmetics, Chemicals, Agriculture & Animal Feed, Food & Beverages, Paints, Coatings & Inks, Adhesives & Sealants and Others in Thousand Metric Tons
Chart 77: Glance at 2016, 2019 and 2025 Mexican Precipitated Silica Volume Market Share (%) by Application – Tire Rubber, Non-tire Rubber, Personal Care & Cosmetics, Chemicals, Agriculture & Animal Feed, Food & Beverages, Paints, Coatings & Inks, Adhesives & Sealants and Others
Chart 78: Mexican Precipitated Silica Market Analysis (2016-2025) by Application – Tire Rubber, Non-tire Rubber, Personal Care & Cosmetics, Chemicals, Agriculture & Animal Feed, Food & Beverages, Paints, Coatings & Inks, Adhesives & Sealants and Others in USD Million
Chart 79: Glance at 2016, 2019 and 2025 Mexican Precipitated Silica Value Market Share (%) by Application – Tire Rubber, Non-tire Rubber, Personal Care & Cosmetics, Chemicals, Agriculture & Animal Feed, Food & Beverages, Paints, Coatings & Inks, Adhesives & Sealants and Others
EUROPE
Chart 80: European Precipitated Silica Market Analysis (2016-2025) – Volume in Thousand Metric Tons and Value in USD Million
Chart 81: European Precipitated Silica Market Analysis (2016-2025) by Geographic Region – France, Germany, Italy, Russia, Spain, The United Kingdom and Rest of Europe in Thousand Metric Tons
Chart 82: Glance at 2016, 2019 and 2025 European Precipitated Silica Volume Market Share (%) by Geographic Region – France, Germany, Italy, Russia, Spain, The United Kingdom and Rest of Europe
Chart 83: European Precipitated Silica Market Analysis (2016-2025) by Geographic Region – France, Germany, Italy, Russia, Spain, The United Kingdom and Rest of Europe in USD Million
Chart 84: Glance at 2016, 2019 and 2025 European Precipitated Silica Value Market Share (%) by Geographic Region – France, Germany, Italy, Russia, Spain, The United Kingdom and Rest of Europe
Chart 85: European Precipitated Silica Market Analysis (2016-2025) by Application – Tire Rubber, Non-tire Rubber, Personal Care & Cosmetics, Plastics, Chemicals, Agriculture & Animal Feed, Food & Beverages, Paints, Coatings & Inks, Paper & Textiles, Adhesives & Sealants and Others in Thousand Metric Tons
Chart 86: Glance at 2016, 2019 and 2025 European Precipitated Silica Volume Market Share (%) by Application – Tire Rubber, Non-tire Rubber, Personal Care & Cosmetics, Plastics, Chemicals, Agriculture & Animal Feed, Food & Beverages, Paints, Coatings & Inks, Paper & Textiles, Adhesives & Sealants and Others
Chart 87: European Precipitated Silica Market Analysis (2016-2025) by Application – Tire Rubber, Non-tire Rubber, Personal Care & Cosmetics, Plastics, Chemicals, Agriculture & Animal Feed, Food & Beverages, Paints, Coatings & Inks, Paper & Textiles, Adhesives & Sealants and Others in USD Million
Chart 88: Glance at 2016, 2019 and 2025 European Precipitated Silica Value Market Share (%) by Application – Tire Rubber, Non-tire Rubber, Personal Care & Cosmetics, Plastics, Chemicals, Agriculture & Animal Feed, Food & Beverages, Paints, Coatings & Inks, Paper & Textiles, Adhesives & Sealants and Others
France
Chart 89: French Precipitated Silica Market Analysis (2016-2025) – Volume in Thousand Metric Tons and Value in USD Million
Chart 90: French Precipitated Silica Market Analysis (2016-2025) by Application – Tire Rubber, Non-tire Rubber, Personal Care & Cosmetics, Plastics, Chemicals, Agriculture & Animal Feed, Food & Beverages, Paints, Coatings & Inks, Paper & Textiles, Adhesives & Sealants and Others in Thousand Metric Tons
Chart 91: Glance at 2016, 2019 and 2025 French Precipitated Silica Volume Market Share (%) by Application – Tire Rubber, Non-tire Rubber, Personal Care & Cosmetics, Plastics, Chemicals, Agriculture & Animal Feed, Food & Beverages, Paints, Coatings & Inks, Paper & Textiles, Adhesives & Sealants and Others
Chart 92: French Precipitated Silica Market Analysis (2016-2025) by Application – Tire Rubber, Non-tire Rubber, Personal Care & Cosmetics, Plastics, Chemicals, Agriculture & Animal Feed, Food & Beverages, Paints, Coatings & Inks, Paper & Textiles, Adhesives & Sealants and Others in USD Million
Chart 93: Glance at 2016, 2019 and 2025 French Precipitated Silica Value Market Share (%) by Application – Tire Rubber, Non-tire Rubber, Personal Care & Cosmetics, Plastics, Chemicals, Agriculture & Animal Feed, Food & Beverages, Paints, Coatings & Inks, Paper & Textiles, Adhesives & Sealants and Others
Germany
Chart 94: German Precipitated Silica Market Analysis (2016-2025) – Volume in Thousand Metric Tons and Value in USD Million
Chart 95: German Precipitated Silica Market Analysis (2016-2025) by Application – Tire Rubber, Non-tire Rubber, Personal Care & Cosmetics, Plastics, Chemicals, Agriculture & Animal Feed, Food & Beverages, Paints, Coatings & Inks, Paper & Textiles, Adhesives & Sealants and Others in Thousand Metric Tons
Chart 96: Glance at 2016, 2019 and 2025 German Precipitated Silica Volume Market Share (%) by Application – Tire Rubber, Non-tire Rubber, Personal Care & Cosmetics, Plastics, Chemicals, Agriculture & Animal Feed, Food & Beverages, Paints, Coatings & Inks, Paper & Textiles, Adhesives & Sealants and Others
Chart 97: German Precipitated Silica Market Analysis (2016-2025) by Application – Tire Rubber, Non-tire Rubber, Personal Care & Cosmetics, Plastics, Chemicals, Agriculture & Animal Feed, Food & Beverages, Paints, Coatings & Inks, Paper & Textiles, Adhesives & Sealants and Others in USD Million
Chart 98: Glance at 2016, 2019 and 2025 German Precipitated Silica Value Market Share (%) by Application – Tire Rubber, Non-tire Rubber, Personal Care & Cosmetics, Plastics, Chemicals, Agriculture & Animal Feed, Food & Beverages, Paints, Coatings & Inks, Paper & Textiles, Adhesives & Sealants and Others
Italy
Chart 99: Italian Precipitated Silica Market Analysis (2016-2025) – Volume in Thousand Metric Tons and Value in USD Million
Chart 100: Italian Precipitated Silica Market Analysis (2016-2025) by Application – Tire Rubber, Non-tire Rubber, Personal Care & Cosmetics, Plastics, Chemicals, Agriculture & Animal Feed, Food & Beverages, Paints, Coatings & Inks, Paper & Textiles, Adhesives & Sealants and Others in Thousand Metric Tons
Chart 101: Glance at 2016, 2019 and 2025 Italian Precipitated Silica Volume Market Share (%) by Application – Tire Rubber, Non-tire Rubber, Personal Care & Cosmetics, Plastics, Chemicals, Agriculture & Animal Feed, Food & Beverages, Paints, Coatings & Inks, Paper & Textiles, Adhesives & Sealants and Others
Chart 102: Italian Precipitated Silica Market Analysis (2016-2025) by Application – Tire Rubber, Non-tire Rubber, Personal Care & Cosmetics, Plastics, Chemicals, Agriculture & Animal Feed, Food & Beverages, Paints, Coatings & Inks, Paper & Textiles, Adhesives & Sealants and Others in USD Million
Chart 103: Glance at 2016, 2019 and 2025 Italian Precipitated Silica Value Market Share (%) by Application – Tire Rubber, Non-tire Rubber, Personal Care & Cosmetics, Plastics, Chemicals, Agriculture & Animal Feed, Food & Beverages, Paints, Coatings & Inks, Paper & Textiles, Adhesives & Sealants and Others
Russia
Chart 104: Russian Precipitated Silica Market Analysis (2016-2025) – Volume in Thousand Metric Tons and Value in USD Million
Chart 105: Russian Precipitated Silica Market Analysis (2016-2025) by Application – Tire Rubber, Non-tire Rubber, Personal Care & Cosmetics, Plastics, Chemicals, Agriculture & Animal Feed, Food & Beverages, Paints, Coatings & Inks, Paper & Textiles, Adhesives & Sealants and Others in Thousand Metric Tons
Chart 106: Glance at 2016, 2019 and 2025 Russian Precipitated Silica Volume Market Share (%) by Application – Tire Rubber, Non-tire Rubber, Personal Care & Cosmetics, Plastics, Chemicals, Agriculture & Animal Feed, Food & Beverages, Paints, Coatings & Inks, Paper & Textiles, Adhesives & Sealants and Others
Chart 107: Russian Precipitated Silica Market Analysis (2016-2025) by Application – Tire Rubber, Non-tire Rubber, Personal Care & Cosmetics, Plastics, Chemicals, Agriculture & Animal Feed, Food & Beverages, Paints, Coatings & Inks, Paper & Textiles, Adhesives & Sealants and Others in USD Million
Chart 108: Glance at 2016, 2019 and 2025 Russian Precipitated Silica Value Market Share (%) by Application – Tire Rubber, Non-tire Rubber, Personal Care & Cosmetics, Plastics, Chemicals, Agriculture & Animal Feed, Food & Beverages, Paints, Coatings & Inks, Paper & Textiles, Adhesives & Sealants and Others
Spain
Chart 109: Spanish Precipitated Silica Market Analysis (2016-2025) – Volume in Thousand Metric Tons and Value in USD Million
Chart 110: Spanish Precipitated Silica Market Analysis (2016-2025) by Application – Tire Rubber, Non-tire Rubber, Personal Care & Cosmetics, Plastics, Chemicals, Agriculture & Animal Feed, Food & Beverages, Paints, Coatings & Inks, Paper & Textiles, Adhesives & Sealants and Others in Thousand Metric Tons
Chart 111: Glance at 2016, 2019 and 2025 Spanish Precipitated Silica Volume Market Share (%) by Application – Tire Rubber, Non-tire Rubber, Personal Care & Cosmetics, Plastics, Chemicals, Agriculture & Animal Feed, Food & Beverages, Paints, Coatings & Inks, Paper & Textiles, Adhesives & Sealants and Others
Chart 112: Spanish Precipitated Silica Market Analysis (2016-2025) by Application – Tire Rubber, Non-tire Rubber, Personal Care & Cosmetics, Plastics, Chemicals, Agriculture & Animal Feed, Food & Beverages, Paints, Coatings & Inks, Paper & Textiles, Adhesives & Sealants and Others in USD Million
Chart 113: Glance at 2016, 2019 and 2025 Spanish Precipitated Silica Value Market Share (%) by Application – Tire Rubber, Non-tire Rubber, Personal Care & Cosmetics, Plastics, Chemicals, Agriculture & Animal Feed, Food & Beverages, Paints, Coatings & Inks, Paper & Textiles, Adhesives & Sealants and Others
The United Kingdom
Chart 114: United Kingdom Precipitated Silica Market Analysis (2016-2025) – Volume in Thousand Metric Tons and Value in USD Million
Chart 115: United Kingdom Precipitated Silica Market Analysis (2016-2025) by Application – Tire Rubber, Non-tire Rubber, Personal Care & Cosmetics, Plastics, Chemicals, Agriculture & Animal Feed, Food & Beverages, Paints, Coatings & Inks, Paper & Textiles, Adhesives & Sealants and Others in Thousand Metric Tons
Chart 116: Glance at 2016, 2019 and 2025 United Kingdom Precipitated Silica Volume Market Share (%) by Application – Tire Rubber, Non-tire Rubber, Personal Care & Cosmetics, Plastics, Chemicals, Agriculture & Animal Feed, Food & Beverages, Paints, Coatings & Inks, Paper & Textiles, Adhesives & Sealants and Others
Chart 117: United Kingdom Precipitated Silica Market Analysis (2016-2025) by Application – Tire Rubber, Non-tire Rubber, Personal Care & Cosmetics, Plastics, Chemicals, Agriculture & Animal Feed, Food & Beverages, Paints, Coatings & Inks, Paper & Textiles, Adhesives & Sealants and Others in USD Million
Chart 118: Glance at 2016, 2019 and 2025 United Kingdom Precipitated Silica Value Market Share (%) by Application – Tire Rubber, Non-tire Rubber, Personal Care & Cosmetics, Plastics, Chemicals, Agriculture & Animal Feed, Food & Beverages, Paints, Coatings & Inks, Paper & Textiles, Adhesives & Sealants and Others
Rest of Europe
Chart 119: Rest of Europe Precipitated Silica Market Analysis (2016-2025) – Volume in Thousand Metric Tons and Value in USD Million
Chart 120: Rest of Europe Precipitated Silica Market Analysis (2016-2025) by Application – Tire Rubber, Non-tire Rubber, Personal Care & Cosmetics, Plastics, Chemicals, Agriculture & Animal Feed, Food & Beverages, Paints, Coatings & Inks, Paper & Textiles, Adhesives & Sealants and Others in Thousand Metric Tons
Chart 121: Glance at 2016, 2019 and 2025 Rest of Europe Precipitated Silica Volume Market Share (%) by Application – Tire Rubber, Non-tire Rubber, Personal Care & Cosmetics, Plastics, Chemicals, Agriculture & Animal Feed, Food & Beverages, Paints, Coatings & Inks, Paper & Textiles, Adhesives & Sealants and Others
Chart 122: Rest of Europe Precipitated Silica Market Analysis (2016-2025) by Application – Tire Rubber, Non-tire Rubber, Personal Care & Cosmetics, Plastics, Chemicals, Agriculture & Animal Feed, Food & Beverages, Paints, Coatings & Inks, Paper & Textiles, Adhesives & Sealants and Others in USD Million
Chart 123: Glance at 2016, 2019 and 2025 Rest of Europe Precipitated Silica Value Market Share (%) by Application – Tire Rubber, Non-tire Rubber, Personal Care & Cosmetics, Plastics, Chemicals, Agriculture & Animal Feed, Food & Beverages, Paints, Coatings & Inks, Paper & Textiles, Adhesives & Sealants and Others
ASIA-PACIFIC
Chart 124: Asia-Pacific Precipitated Silica Market Analysis (2016-2025) – Volume in Thousand Metric Tons and Value in USD Million
Chart 125: Asia-Pacific Precipitated Silica Market Analysis (2016-2025) by Geographic Region – China, India, Japan, South Korea and Rest of Asia-Pacific in Thousand Metric Tons
Chart 126: Glance at 2016, 2019 and 2025 Asia-Pacific Precipitated Silica Volume Market Share (%) by Geographic Region – China, India, Japan, South Korea and Rest of Asia-Pacific
Chart 127: Asia-Pacific Precipitated Silica Market Analysis (2016-2025) by Geographic Region – China, India, Japan, South Korea and Rest of Asia-Pacific in USD Million
Chart 128: Glance at 2016, 2019 and 2025 Asia-Pacific Precipitated Silica Value Market Share (%) by Geographic Region – China, India, Japan, South Korea and Rest of Asia-Pacific
Chart 129: Asia-Pacific Precipitated Silica Market Analysis (2016-2025) by Application – Tire Rubber, Non-tire Rubber, Personal Care & Cosmetics, Plastics, Chemicals, Agriculture & Animal Feed, Food & Beverages, Paints, Coatings & Inks, Paper & Textiles, Adhesives & Sealants and Others in Thousand Metric Tons
Chart 130: Glance at 2016, 2019 and 2025 Asia-Pacific Precipitated Silica Volume Market Share (%) by Application – Tire Rubber, Non-tire Rubber, Personal Care & Cosmetics, Plastics, Chemicals, Agriculture & Animal Feed, Food & Beverages, Paints, Coatings & Inks, Paper & Textiles, Adhesives & Sealants and Others
Chart 131: Asia-Pacific Precipitated Silica Market Analysis (2016-2025) by Application – Tire Rubber, Non-tire Rubber, Personal Care & Cosmetics, Plastics, Chemicals, Agriculture & Animal Feed, Food & Beverages, Paints, Coatings & Inks, Paper & Textiles, Adhesives & Sealants and Others in USD Million
Chart 132: Glance at 2016, 2019 and 2025 Asia-Pacific Precipitated Silica Value Market Share (%) by Application – Tire Rubber, Non-tire Rubber, Personal Care & Cosmetics, Plastics, Chemicals, Agriculture & Animal Feed, Food & Beverages, Paints, Coatings & Inks, Paper & Textiles, Adhesives & Sealants and Others
China
Chart 133: Chinese Precipitated Silica Market Analysis (2016-2025) – Volume in Thousand Metric Tons and Value in USD Million
Chart 134: Chinese Precipitated Silica Market Analysis (2016-2025) by Application – Tire Rubber, Non-tire Rubber, Personal Care & Cosmetics, Plastics, Chemicals, Agriculture & Animal Feed, Food & Beverages, Paints, Coatings & Inks, Paper & Textiles, Adhesives & Sealants and Others in Thousand Metric Tons
Chart 135: Glance at 2016, 2019 and 2025 Chinese Precipitated Silica Volume Market Share (%) by Application – Tire Rubber, Non-tire Rubber, Personal Care & Cosmetics, Plastics, Chemicals, Agriculture & Animal Feed, Food & Beverages, Paints, Coatings & Inks, Paper & Textiles, Adhesives & Sealants and Others
Chart 136: Chinese Precipitated Silica Market Analysis (2016-2025) by Application – Tire Rubber, Non-tire Rubber, Personal Care & Cosmetics, Plastics, Chemicals, Agriculture & Animal Feed, Food & Beverages, Paints, Coatings & Inks, Paper & Textiles, Adhesives & Sealants and Others in USD Million
Chart 137: Glance at 2016, 2019 and 2025 Chinese Precipitated Silica Value Market Share (%) by Application – Tire Rubber, Non-tire Rubber, Personal Care & Cosmetics, Plastics, Chemicals, Agriculture & Animal Feed, Food & Beverages, Paints, Coatings & Inks, Paper & Textiles, Adhesives & Sealants and Others
India
Chart 138: Indian Precipitated Silica Market Analysis (2016-2025) – Volume in Thousand Metric Tons and Value in USD Million
Chart 139: Indian Precipitated Silica Market Analysis (2016-2025) by Application – Tire Rubber, Non-tire Rubber, Personal Care & Cosmetics, Plastics, Chemicals, Agriculture & Animal Feed, Food & Beverages, Paints, Coatings & Inks, Paper & Textiles, Adhesives & Sealants and Others in Thousand Metric Tons
Chart 140: Glance at 2016, 2019 and 2025 Indian Precipitated Silica Volume Market Share (%) by Application – Tire Rubber, Non-tire Rubber, Personal Care & Cosmetics, Plastics, Chemicals, Agriculture & Animal Feed, Food & Beverages, Paints, Coatings & Inks, Paper & Textiles, Adhesives & Sealants and Others
Chart 141: Indian Precipitated Silica Market Analysis (2016-2025) by Application – Tire Rubber, Non-tire Rubber, Personal Care & Cosmetics, Plastics, Chemicals, Agriculture & Animal Feed, Food & Beverages, Paints, Coatings & Inks, Paper & Textiles, Adhesives & Sealants and Others in USD Million
Chart 142: Glance at 2016, 2019 and 2025 Indian Precipitated Silica Value Market Share (%) by Application – Tire Rubber, Non-tire Rubber, Personal Care & Cosmetics, Plastics, Chemicals, Agriculture & Animal Feed, Food & Beverages, Paints, Coatings & Inks, Paper & Textiles, Adhesives & Sealants and Others
Japan
Chart 143: Japanese Precipitated Silica Market Analysis (2016-2025) – Volume in Thousand Metric Tons and Value in USD Million
Chart 144: Japanese Precipitated Silica Market Analysis (2016-2025) by Application – Tire Rubber, Non-tire Rubber, Personal Care & Cosmetics, Plastics, Chemicals, Agriculture & Animal Feed, Food & Beverages, Paints, Coatings & Inks, Paper & Textiles, Adhesives & Sealants and Others in Thousand Metric Tons
Chart 145: Glance at 2016, 2019 and 2025 Japanese Precipitated Silica Volume Market Share (%) by Application – Tire Rubber, Non-tire Rubber, Personal Care & Cosmetics, Plastics, Chemicals, Agriculture & Animal Feed, Food & Beverages, Paints, Coatings & Inks, Paper & Textiles, Adhesives & Sealants and Others
Chart 146: Japanese Precipitated Silica Market Analysis (2016-2025) by Application – Tire Rubber, Non-tire Rubber, Personal Care & Cosmetics, Plastics, Chemicals, Agriculture & Animal Feed, Food & Beverages, Paints, Coatings & Inks, Paper & Textiles, Adhesives & Sealants and Others in USD Million
Chart 147: Glance at 2016, 2019 and 2025 Japanese Precipitated Silica Value Market Share (%) by Application – Tire Rubber, Non-tire Rubber, Personal Care & Cosmetics, Plastics, Chemicals, Agriculture & Animal Feed, Food & Beverages, Paints, Coatings & Inks, Paper & Textiles, Adhesives & Sealants and Others
South Korea
Chart 148: South Korean Precipitated Silica Market Analysis (2016-2025) – Volume in Thousand Metric Tons and Value in USD Million
Chart 149: South Korean Precipitated Silica Market Analysis (2016-2025) by Application – Tire Rubber, Non-tire Rubber, Personal Care & Cosmetics, Plastics, Chemicals, Agriculture & Animal Feed, Food & Beverages, Paints, Coatings & Inks, Paper & Textiles, Adhesives & Sealants and Others in Thousand Metric Tons
Chart 150: Glance at 2016, 2019 and 2025 South Korean Precipitated Silica Volume Market Share (%) by Application – Tire Rubber, Non-tire Rubber, Personal Care & Cosmetics, Plastics, Chemicals, Agriculture & Animal Feed, Food & Beverages, Paints, Coatings & Inks, Paper & Textiles, Adhesives & Sealants and Others
Chart 151: South Korean Precipitated Silica Market Analysis (2016-2025) by Application – Tire Rubber, Non-tire Rubber, Personal Care & Cosmetics, Plastics, Chemicals, Agriculture & Animal Feed, Food & Beverages, Paints, Coatings & Inks, Paper & Textiles, Adhesives & Sealants and Others in USD Million
Chart 152: Glance at 2016, 2019 and 2025 South Korean Precipitated Silica Value Market Share (%) by Application – Tire Rubber, Non-tire Rubber, Personal Care & Cosmetics, Plastics, Chemicals, Agriculture & Animal Feed, Food & Beverages, Paints, Coatings & Inks, Paper & Textiles, Adhesives & Sealants and Others
Rest of Asia-Pacific
Chart 153: Rest of Asia-Pacific Precipitated Silica Market Analysis (2016-2025) – Volume in Thousand Metric Tons and Value in USD Million
Chart 154: Rest of Asia-Pacific Precipitated Silica Market Analysis (2016-2025) by Application – Tire Rubber, Non-tire Rubber, Personal Care & Cosmetics, Plastics, Chemicals, Agriculture & Animal Feed, Food & Beverages, Paints, Coatings & Inks, Paper & Textiles, Adhesives & Sealants and Others in Thousand Metric Tons
Chart 155: Glance at 2016, 2019 and 2025 Rest of Asia-Pacific Precipitated Silica Volume Market Share (%) by Application – Tire Rubber, Non-tire Rubber, Personal Care & Cosmetics, Plastics, Chemicals, Agriculture & Animal Feed, Food & Beverages, Paints, Coatings & Inks, Paper & Textiles, Adhesives & Sealants and Others
Chart 156: Rest of Asia-Pacific Precipitated Silica Market Analysis (2016-2025) by Application – Tire Rubber, Non-tire Rubber, Personal Care & Cosmetics, Plastics, Chemicals, Agriculture & Animal Feed, Food & Beverages, Paints, Coatings & Inks, Paper & Textiles, Adhesives & Sealants and Others in USD Million
Chart 157: Glance at 2016, 2019 and 2025 Rest of Asia-Pacific Precipitated Silica Value Market Share (%) by Application – Tire Rubber, Non-tire Rubber, Personal Care & Cosmetics, Plastics, Chemicals, Agriculture & Animal Feed, Food & Beverages, Paints, Coatings & Inks, Paper & Textiles, Adhesives & Sealants and Others
SOUTH AMERICA
Chart 158: South American Precipitated Silica Market Analysis (2016-2025) – Volume in Thousand Metric Tons and Value in USD Million
Chart 159: South American Precipitated Silica Market Analysis (2016-2025) by Geographic Region – Brazil and Rest of South America in Thousand Metric Tons
Chart 160: Glance at 2016, 2019 and 2025 South American Precipitated Silica Volume Market Share (%) by Geographic Region – Brazil and Rest of South America
Chart 161: South American Precipitated Silica Market Analysis (2016-2025) by Geographic Region – Brazil and Rest of South America in USD Million
Chart 162: Glance at 2016, 2019 and 2025 South American Precipitated Silica Value Market Share (%) by Geographic Region – Brazil and Rest of South America
Chart 163: South American Precipitated Silica Market Analysis (2016-2025) by Application – Tire Rubber, Non-tire Rubber, Personal Care & Cosmetics, Plastics, Chemicals, Agriculture & Animal Feed, Food & Beverages, Paints, Coatings & Inks, Paper & Textiles, Adhesives & Sealants and Others in Thousand Metric Tons
Chart 164: Glance at 2016, 2019 and 2025 South American Precipitated Silica Volume Market Share (%) by Application – Tire Rubber, Non-tire Rubber, Personal Care & Cosmetics, Plastics, Chemicals, Agriculture & Animal Feed, Food & Beverages, Paints, Coatings & Inks, Paper & Textiles, Adhesives & Sealants and Others
Chart 165: South American Precipitated Silica Market Analysis (2016-2025) by Application – Tire Rubber, Non-tire Rubber, Personal Care & Cosmetics, Plastics, Chemicals, Agriculture & Animal Feed, Food & Beverages, Paints, Coatings & Inks, Paper & Textiles, Adhesives & Sealants and Others in USD Million
Chart 166: Glance at 2016, 2019 and 2025 South American Precipitated Silica Value Market Share (%) by Application – Tire Rubber, Non-tire Rubber, Personal Care & Cosmetics, Plastics, Chemicals, Agriculture & Animal Feed, Food & Beverages, Paints, Coatings & Inks, Paper & Textiles, Adhesives & Sealants and Others
Brazil
Chart 167: Brazilian Precipitated Silica Market Analysis (2016-2025) – Volume in Thousand Metric Tons and Value in USD Million
Chart 168: Brazilian Precipitated Silica Market Analysis (2016-2025) by Application – Tire Rubber, Non-tire Rubber, Personal Care & Cosmetics, Plastics, Chemicals, Agriculture & Animal Feed, Food & Beverages, Paints, Coatings & Inks, Paper & Textiles, Adhesives & Sealants and Others in Thousand Metric Tons
Chart 169: Glance at 2016, 2019 and 2025 Brazilian Precipitated Silica Volume Market Share (%) by Application – Tire Rubber, Non-tire Rubber, Personal Care & Cosmetics, Plastics, Chemicals, Agriculture & Animal Feed, Food & Beverages, Paints, Coatings & Inks, Paper & Textiles, Adhesives & Sealants and Others
Chart 170: Brazilian Precipitated Silica Market Analysis (2016-2025) by Application – Tire Rubber, Non-tire Rubber, Personal Care & Cosmetics, Plastics, Chemicals, Agriculture & Animal Feed, Food & Beverages, Paints, Coatings & Inks, Paper & Textiles, Adhesives & Sealants and Others in USD Million
Chart 171: Glance at 2016, 2019 and 2025 Brazilian Precipitated Silica Value Market Share (%) by Application – Tire Rubber, Non-tire Rubber, Personal Care & Cosmetics, Plastics, Chemicals, Agriculture & Animal Feed, Food & Beverages, Paints, Coatings & Inks, Paper & Textiles, Adhesives & Sealants and Others
Rest of South America
Chart 172: Rest of South America Precipitated Silica Market Analysis (2016-2025) – Volume in Thousand Metric Tons and Value in USD Million
Chart 173: Rest of South America Precipitated Silica Market Analysis (2016-2025) by Application – Tire Rubber, Non-tire Rubber, Personal Care & Cosmetics, Chemicals, Agriculture & Animal Feed, Food & Beverages, Paints, Coatings & Inks and Others in Thousand Metric Tons
Chart 174: Glance at 2016, 2019 and 2025 Rest of South America Precipitated Silica Volume Market Share (%) by Application – Tire Rubber, Non-tire Rubber, Personal Care & Cosmetics, Chemicals, Agriculture & Animal Feed, Food & Beverages, Paints, Coatings & Inks and Others
Chart 175: Rest of South America Precipitated Silica Market Analysis (2016-2025) by Application – Tire Rubber, Non-tire Rubber, Personal Care & Cosmetics, Chemicals, Agriculture & Animal Feed, Food & Beverages, Paints, Coatings & Inks and Others in USD Million
Chart 176: Glance at 2016, 2019 and 2025 Rest of South America Precipitated Silica Value Market Share (%) by Application – Tire Rubber, Non-tire Rubber, Personal Care & Cosmetics, Chemicals, Agriculture & Animal Feed, Food & Beverages, Paints, Coatings & Inks and Others
REST OF WORLD
Chart 177: Rest of World Precipitated Silica Market Analysis (2016-2025) – Volume in Thousand Metric Tons and Value in USD Million
Chart 178: Rest of World Precipitated Silica Market Analysis (2016-2025) by Application – Tire Rubber, Non-tire Rubber, Personal Care & Cosmetics, Plastics, Chemicals, Agriculture & Animal Feed, Food & Beverages, Paints, Coatings & Inks and Others in Thousand Metric Tons
Chart 179: Glance at 2016, 2019 and 2025 Rest of World Precipitated Silica Volume Market Share (%) by Application – Tire Rubber, Non-tire Rubber, Personal Care & Cosmetics, Plastics, Chemicals, Agriculture & Animal Feed, Food & Beverages, Paints, Coatings & Inks and Others
Chart 180: Rest of World Precipitated Silica Market Analysis (2016-2025) by Application – Tire Rubber, Non-tire Rubber, Personal Care & Cosmetics, Plastics, Chemicals, Agriculture & Animal Feed, Food & Beverages, Paints, Coatings & Inks and Others in USD Million
Chart 181: Glance at 2016, 2019 and 2025 Rest of World Precipitated Silica Value Market Share (%) by Application – Tire Rubber, Non-tire Rubber, Personal Care & Cosmetics, Plastics, Chemicals, Agriculture & Animal Feed, Food & Beverages, Paints, Coatings & Inks and Others
Table & Figure:
Table 1: Physical and chemical properties of specialty silicas
Figure 1: Theoretical SAS particles at infinite dilution
Evonik Industries AG
Gujarat Multi Gas Base Chemicals Pvt. Ltd.
Industrias Quimicas del Ebro, S.A. (IQE Group)
Madhu Silica Pvt. Ltd.
Oriental Silicas Corporation
PPG Industries, Inc.
PQ Corporation
Quechen Silicon Chemical Co., Ltd.
Solvay S.A.
Tosoh Silica Corporation
W.R. Grace & Co.
PLEASE SELECT LICENSE TYPE
RELATED REPORTS
Sulfone Polymers (PSU, PPSU & PESU) – A Global Market Overview
Report Code: CP041 | Pages: 398 | Price: $4500
Published
Apr 2024
Engineering Plastics – A Global Market Overview
Report Code: CP002 | Pages: 535 | Price: $5400
Published
Feb 2024
Modified Polyphenylene Ether (mPPE) – A Global Market Overview
Report Code: CP116 | Pages: 188 | Price: $4050
Published
Jan 2024
Titanium Dioxide (TiO2) – A Global Market Overview
Report Code: CP040 | Pages: 252 | Price: $4050
Published
Jan 2024

Global Bioadhesives Market – Types and Applications
Report Code: CP102 | Pages: 212 | Price: $4500
Published
Jun 2023