Monolithic ceramics constitute the largest product category within the broader field of technical ceramics and include those ceramics that, as a rule, are not composites. On the other hand, in monolithic ceramics, the interface chemistry, as also the nature of mechanical and chemical bonding established between the two phases can be entirely different from that obtained in ceramic composites. Monolithic ceramics are typified by their special features, such as reliability, durability and resistance to high temperatures, which makes them indispensable in some of the more demanding applications. These ceramics can be fabricated without a reinforcement material and have a polycrystalline microstructure.
Much of the demand for Monolithic Ceramics is derived from their extensive use in the automotive, electrical and electronics, power and defense industries. A growing global demand for electronic devices, such as laptops and mobile phones, has been instrumental in propelling the market for these materials. Asia-Pacific’s rapidly expanding electrical and electronics sector has ensured that the region remains at forefront in terms of demand for Monolithic Ceramics. One possible limiting factor to this momentum can be the high cost of processing and excessive requirement of energy that go into obtaining the final product. Some of the other factors playing prominent roles in impacting the market for Monolithic Ceramics include greater use of these ceramics in fabricating turbine blades and other automotive components and stringent pollution control measures being rolled out by developing nations.
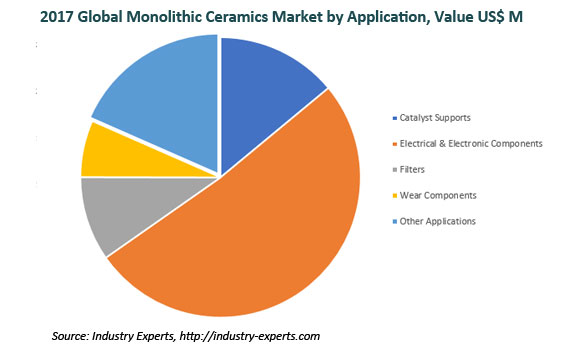
Worldwide market for Monolithic Ceramics forecast to be US$51.2 billion in 2017 and projected to reach US$67.5 billion by 2022 at a CAGR of 5.7% between 2017 and 2022. Electrical & Electronic Components lead the global demand for Monolithic Ceramics which is forecast to be US$26.3 billion in 2017 and is expected to maintain a CAGR of 5.7% between 2017 and 2022 and reach a projected US$34.7 billion by 2022.
The report analyzes the monolithic ceramic product types comprising Non-Oxides and Oxides. Monolithic Oxide Ceramics’ market further reviewed by its sub-type including Aluminum Oxide and Zirconium Oxide. The study also analyzes the key applications of monolithic ceramics consisting of Catalyst Supports, Electrical & Electronic Components, Filters, Wear Components and Others. The global markets for aforementioned ceramic types and applications of monolithic ceramics are analyzed in terms of value in USD for 2014-2022 analysis period in the global markets comprising North America, Europe, Asia-Pacific, Latin America and Rest of World. The regional markets further analyzed for 16 independent countries across North America – The United States and Canada; Europe – France, Germany, Italy, Russia, Spain and the United Kingdom; Asia-Pacific – China, India, Japan, South Korea and Taiwan; Latin America – Argentina, Brazil and Mexico. The market is analyzed in all of these major regions by key countries, ceramic types/sub-types and by key applications in terms of USD.
This 432 page global monolithic ceramics’ market report includes 282 charts (includes a data table and graphical representation for each chart), supported with meaningful and easy to understand graphical presentation, of market numbers. The report profiles 17 key global players and 41 major players across North America – 18; Europe – 8 and Asia-Pacific – 15. The study also provides the listing of the companies engaged in manufacturing and supply of monolithic ceramics. The global list of companies covers the address, contact numbers and the website addresses of 448 companies.
PART A: GLOBAL MARKET PERSPECTIVE
1. INTRODUCTION
1.1 Product Outline
1.1.1 A Primer on Monolithic Ceramics
1.1.2 Classification of Monolithic Ceramics
1.1.2.1 Non-Oxides
1.1.2.1.1 Nitrides
1.1.2.1.1.1 Aluminum Nitride (AlN)
1.1.2.1.1.2 Boron Nitride (BN)
1.1.2.1.1.3 Silicon Nitride (Si3N4)
1.1.2.1.2 Carbides
1.1.2.1.2.1 Tungsten Carbide (WC)
1.1.2.1.2.2 Boron Carbide (B4C)
1.1.2.1.2.3 Silicon Carbide (SiC)
1.1.2.1.3 Borides
1.1.2.1.3.1 Titanium Diboride (TiB2)
1.1.2.1.4 Manufacture of Non-Oxide Monolithic Ceramics
1.1.2.1.4.1 Green Forming of Monolithic Ceramics
1.1.2.1.4.2 Low or Pressureless Densification Methods
1.1.2.1.4.3 Pressure Densification Methods
1.1.2.1.4.3.1 Hot Pressing
1.1.2.1.4.3.2 Hot Isostatic Pressing (HIPing)
1.1.2.1.5 Finishing of Non-Oxide Monolithic Ceramics
1.1.2.2 Oxides
1.1.2.2.1 Aluminum Oxide or Alumina (Al2O3)
1.1.2.2.1.1 Extraction Methods
1.1.2.2.1.2 Applications
1.1.2.2.2 Zirconium Oxide or Zirconia (ZrO2)
1.1.2.2.2.1 Processing of Zirconia
1.1.2.2.2.1.1 Blank Fabrication
1.1.2.2.2.1.2 Sintering Process
1.1.2.2.2.2 Material Properties
1.1.2.2.2.3 Physical Properties
1.1.2.2.2.4 Applications
2. MONOLITHIC CERAMICS APPLICATIONS – A MARKET SNAPSHOT
2.1 Catalyst Supports
2.1.1 Categories
2.1.1.1 Fumed Silica and Metal Oxides
2.1.1.2 Pressed Ceramic Ring Supports and Carriers
2.1.1.3 Ceramic Honeycomb Catalyst Supports and Carriers
2.1.1.4 Colloidal Silica Supports and Carriers
2.1.1.5 Zeolites
2.1.2 Materials Used
2.1.3 Applications
2.2 Electrical & Electronic Components
2.2.1 Kiln and Furnace Engineering
2.2.2 Onshore and Offshore Engineering
2.2.3 Power Electronics
2.2.4 Measuring Systems
2.2.5 Wafer Production
2.2.6 Telecommunications
2.2.7 Lighting Systems
2.3 Filters
2.3.1 Raw Materials
2.3.2 Design
2.3.3 Production Process
2.4 Wear Components
2.5 Other Applications
2.5.1 Body & Vehicle Armor
2.5.2 Cutting Tools
2.5.3 Engine Components
2.5.4 Membranes
3. KEY MARKET TRENDS
3.1 Garnet Ceramic Solid-State Batteries Offer Improved Performance with Ultrathin Aluminum Oxide Layer
3.2 Zirconia Ceramics May Be a Reality in Apple’s iPhone 8
3.3 Aerospace Sector Takes Off with Ceramics
3.4 Extreme Temperature Resistant Ceramic Developed
3.5 Fabrication of Ceramic Electronics Enhanced through Perovskites
3.6 Functionally Graded Ceramics (FGCs): Materials of the Future?
3.6.1 Ceramic-Metal
3.6.2 Ceramic-Ceramic and Glass-Ceramic
3.6.3 Ceramic-Polymer
3.6.4 In Conclusion
3.7 Novel High-Performance Monolithic Ceramics Boost Turbomachinery Performance
3.8 Carbon Nanotubes and Graphene-Reinforced Ceramics Nanocomposites Strengthen Monolithic Ceramics
3.9 Ceramic Components Find Application in Gas Turbines for Industrial Cogeneration
3.10 Porous and Dense Layers of Monolithic YSZ Developed for Ceramic Fuel Cell Applications
3.11 Low Temperature Co-Fired Ceramic Fuel Processor for Micro-Scale SOFCs Developed
4. KEY GLOBAL PLAYERS
Advanced Ceramics Manufacturing, LLC (United States)
Ceradyne, Inc. (United States)
Ceramtec GmbH (Germany)
Coorstek, Inc. (United States)
Elan Technology, Inc. (United States)
Ferro Corporation (United States)
HC Starck GmbH (Germany)
Kyocera Corporation (Japan)
Materion Corporation (United States)
Mcdanel Advanced Ceramic Technologies, LLC (United States)
Momentive Performance Materials, Inc. (United States)
Morgan Advanced Materials PLC (United Kingdom)
Murata Manufacturing Co., Ltd. (Japan)
NGK Insulators Limited (Japan)
Rauschert Group (Germany)
Saint-Gobain Ceramic Materials (France)
Zircoa, Inc. (United States)
5. KEY BUSINESS TRENDS
VY1 Compact Series Ceramic Disc Capacitors from Vishay Intertechnology, Inc Qualifies “biased 85/85“ Accelerated Life Test
Coorstek Inc Showcases Engineered Ceramic Components at AHR Expo 2017, US
Ceradyne Receives US Army soldier protection programs contract
Ferro Corporation Acquires Electro-Science Laboratories, Inc
AVX Corporation Launches MM Series Medical Grade Multilayer Ceramic Capacitors (MLCCs)
Morgan Advanced Materials Plc Expands Silicon Carbide Volumes in UK
NGK Insulators, Ltd Increases Ceramic Production Volumes in China
CoorsTek Inc Showcases Wear-Resistant Ceramics at MINExpo in Las Vegas
Morgan Advanced Materials Plc Unveils new alumina sensor
Morgan Advanced Materials Plc Introduces new Nilcra® Zirconia TS Grade Ceramic Die
CoorsTek Inc Develops New Ceramic Membrane
Blasch Precision Ceramics, Inc Develops VERKAPSE™ Hydrocyclone Liners
CoorsTek Inc Acquires Philips Ceramics Uden
Ceradyne Bags Body Armor Plates Contract from US Defense Logistics Agency
CoorsTek Inc to Establish New Center for Advanced Ceramic Materials in Golden, Colorado
3M Deutschland GmbH and Schuberth GmbH Enter into Collaboration
AVX Corporation Introduces Multilayer Organic (MLO®) High Pass Filters For Wireless Applications
CoorsTek Inc Showcases Semiconductor Processing Ceramic Components at SEMICON Japan
Aremco Products, Inc Develops Alumina Ceramic Material Aremcolox™ 502-1400-99
Blasch Precision Ceramics, Inc Launches CeraLine™
NASA Approves AVX’s Space-Level X7R BME Multilayer Ceramic Capacitors (MLCCs)
AVX Corporation Launches new AVX Radial CapGuard™ Varistors
CoorsTek Inc Acquires BLS Textiles, Inc
Morgan Advanced Materials Plc Develops New PGS-100 Graphite-Loaded Silicon Carbon Material
AVX Corporation Introduces SV Series Multilayer Ceramic (MLC) Radial-Leaded Capacitors
CoorsTek Inc Acquires Covalent Materials Corporation
Aremco Products, Inc Develops Ceramacast™ 900 ceramic
Morgan Advanced Materials Plc Develops Silicon Carbide Degassing Rotors
6. GLOBAL MARKET OVERVIEW
6.1 Global Monolithic Ceramics Market Overview by Ceramic Type
6.1.1 Global Monolithic Oxide Ceramics Market Overview by Sub-Type
6.1.2 Monolithic Ceramic Types Market Overview by Global Region
6.1.2.1 Non-Oxides
6.1.2.2 Oxides
6.1.2.2.1 Monolithic Oxide Ceramics Sub-Types Market Overview by Global Region
6.1.2.2.1.1 Aluminum Oxide
6.1.2.2.1.2 Zirconium Oxide
6.2 Global Monolithic Ceramics Market Overview by Application
6.2.1 Monolithic Ceramics Applications Market Overview by Global Region
6.2.1.1 Catalyst Supports
6.2.1.2 Electrical & Electronic Components
6.2.1.3 Filters
6.2.1.4 Wear Components
6.2.1.5 Other Applications
PART B: REGIONAL MARKET PERSPECTIVE
REGIONAL MARKET OVERVIEW
1. NORTH AMERICA
1.1 North American Monolithic Ceramics Market Overview by Geographic Region
1.2 North American Monolithic Ceramics Market Overview by Ceramic Type
1.2.1 North American Monolithic Oxide Ceramics Market Overview by Sub-Type
1.2.2 Monolithic Ceramic Types Market Overview by NA Region
1.2.2.1 Non-Oxides
1.2.2.2 Oxides
1.2.2.2.1 Monolithic Oxide Ceramics Sub-Types Market Overview by NA Region
1.2.2.2.1.1 Aluminum Oxide
1.2.2.2.1.2 Zirconium Oxide
1.3 North American Monolithic Ceramics Market Overview by Application
1.3.1 Monolithic Ceramics Applications Market Overview by NA Region
1.3.1.1 Catalyst Supports
1.3.1.2 Electrical & Electronic Components
1.3.1.3 Filters
1.3.1.4 Wear Components
1.3.1.5 Other Applications
1.4 Major Market Players
Advanced Ceramics Manufacturing, LLC (United States)
Advanced Monolythic Ceramics, Inc (United States)
Aremco Products, Inc. (United States)
AVX Corporation (United States)
Blasch Precision Ceramics, Inc. (United States)
Ceradyne, Inc. (United States)
Cerco Corporation (United States)
Coorstek, Inc. (United States)
Elan Technology, Inc. (United States)
Ferro Corporation (United States)
Kemet Corporation (United States)
Materion Corporation (United States)
Mcdanel Advanced Ceramic Technologies, LLC (United States)
Momentive Performance Materials, Inc. (United States)
NEO Tech (United States)
Refractron Technologies Corporation (United States)
Vishay Intertechnology, Inc. (United States)
Zircoa, Inc. (United States)
1.5 Country-wise Analysis of North American Monolithic Ceramics Market
1.5.1 The United States
1.5.1.1 United States Monolithic Ceramics Market Overview by Ceramic Type
1.5.1.1.1 United States Monolithic Oxide Ceramics Market Overview by Sub-Type
1.5.1.2 United States Monolithic Ceramics Market Overview by Application
1.5.2 Canada
1.5.2.1 Canadian Monolithic Ceramics Market Overview by Ceramic Type
1.5.2.1.1 Canadian Monolithic Oxide Ceramics Market Overview by Sub-Type
1.5.2.2 Canadian Monolithic Ceramics Market Overview by Application
2. EUROPE
2.1 European Monolithic Ceramics Market Overview by Geographic Region
2.2 European Monolithic Ceramics Market Overview by Ceramic Type
2.2.1 European Monolithic Oxide Ceramics Market Overview by Sub-Type
2.2.2 Monolithic Ceramic Types Market Overview by European Region
2.2.2.1 Non-Oxides
2.2.2.2 Oxides
2.2.2.2.1 Monolithic Oxide Ceramics Sub-Types Market Overview by European Region
2.2.2.2.1.1 Aluminum Oxide
2.2.2.2.1.2 Zirconium Oxide
2.3 European Monolithic Ceramics Market Overview by Application
2.3.1 Monolithic Ceramics Applications Market Overview by European Region
2.3.1.1 Catalyst Supports
2.3.1.2 Electrical & Electronic Components
2.3.1.3 Filters
2.3.1.4 Wear Components
2.3.1.5 Other Applications
2.4 Major Market Players
BCE Special Ceramics GmbH (Germany)
CeramTec GmbH (Germany)
HC Starck GmbH (Germany)
Morgan Advanced Materials Plc (United Kingdom)
Nabaltec AG (Germany)
Rauschert Group (Germany)
Saint-Gobain Ceramic Materials (France)
Vesuvius PLC (United Kingdom)
2.5 Country-wise Analysis of European Monolithic Ceramics Market
2.5.1 France
2.5.1.1 French Monolithic Ceramics Market Overview by Ceramic Type
2.5.1.1.1 French Monolithic Oxide Ceramics Market Overview by Sub-Type
2.5.1.2 French Monolithic Ceramics Market Overview by Application
2.5.2 Germany
2.5.2.1 German Monolithic Ceramics Market Overview by Ceramic Type
2.5.2.1.1 German Monolithic Oxide Ceramics Market Overview by Sub-Type
2.5.2.2 German Monolithic Ceramics Market Overview by Application
2.5.3 Italy
2.5.3.1 Italian Monolithic Ceramics Market Overview by Ceramic Type
2.5.3.1.1 Italian Monolithic Oxide Ceramics Market Overview by Sub-Type
2.5.3.2 Italian Monolithic Ceramics Market Overview by Application
2.5.4 Russia
2.5.4.1 Russian Monolithic Ceramics Market Overview by Ceramic Type
2.5.4.1.1 Russian Monolithic Oxide Ceramics Market Overview by Sub-Type
2.5.4.2 Russian Monolithic Ceramics Market Overview by Application
2.5.5 Spain
2.5.5.1 Spanish Monolithic Ceramics Market Overview by Ceramic Type
2.5.5.1.1 Spanish Monolithic Oxide Ceramics Market Overview by Sub-Type
2.5.5.2 Spanish Monolithic Ceramics Market Overview by Application
2.5.6 The United Kingdom
2.5.6.1 United Kingdom Monolithic Ceramics Market Overview by Ceramic Type
2.5.6.1.1 United Kingdom Monolithic Oxide Ceramics Market Overview by Sub-Type
2.5.6.2 United Kingdom Monolithic Ceramics Market Overview by Application
2.5.7 Rest of Europe
2.5.7.1 Rest of Europe Monolithic Ceramics Market Overview by Ceramic Type
2.5.7.1.1 Rest of Europe Monolithic Oxide Ceramics Market Overview by Sub-Type
2.5.7.2 Rest of Europe Monolithic Ceramics Market Overview by Application
3. ASIA-PACIFIC
3.1 Asia-Pacific Monolithic Ceramics Market Overview by Geographic Region
3.2 Asia-Pacific Monolithic Ceramics Market Overview by Ceramic Type
3.2.1 Asia-Pacific Monolithic Oxide Ceramics Market Overview by Sub-Type
3.2.2 Monolithic Ceramic Types Market Overview by Asia-Pacific Region
3.2.2.1 Non-Oxides
3.2.2.2 Oxides
3.2.2.2.1 Monolithic Oxide Ceramics Sub-Types Market Overview by Asia-Pacific Region
3.2.2.2.1.1 Aluminum Oxide
3.2.2.2.1.2 Zirconium Oxide
3.3 Asia-Pacific Monolithic Ceramics Market Overview by Application
3.3.1 Monolithic Ceramics Applications Market Overview by Asia-Pacific Region
3.3.1.1 Catalyst Supports
3.3.1.2 Electrical & Electronic Components
3.3.1.3 Filters
3.3.1.4 Wear Components
3.3.1.5 Other Applications
3.4 Major Market Players
AGC Ceramics Co., Ltd. (Japan)
Bhalla Chemical Works Pvt., Ltd. (India)
Coorstek KK (Japan)
Dalian Zhengxing Abrasive Co., Ltd. (China)
Guangzhou Kingsky Material Co., Ltd. (China)
Hitachi Chemical Co., Ltd. (Japan)
Jiangsu Sailamike Precision Ceramic Co., Ltd. (China)
Kyocera Corporation (Japan)
Murata Manufacturing Co., Ltd. (Japan)
NGK Insulators Limited (Japan)
Noritake Co., Ltd (Japan)
NTB Hitech Ceramics (India)
Shandong Goldensun Zirconium Industry Co., Ltd (China)
Shandong Guiyuan Advanced Ceramics Co., Ltd. (China)
TDK Corporation (Japan)
3.5 Country-wise Analysis of Asia-Pacific Monolithic Ceramics Market
3.5.1 China
3.5.1.1 Chinese Monolithic Ceramics Market Overview by Ceramic Type
3.5.1.1.1 Chinese Monolithic Oxide Ceramics Market Overview by Sub-Type
3.5.1.2 Chinese Monolithic Ceramics Market Overview by Application
3.5.2 India
3.5.2.1 Indian Monolithic Ceramics Market Overview by Ceramic Type
3.5.2.1.1 Indian Monolithic Oxide Ceramics Market Overview by Sub-Type
3.5.2.2 Indian Monolithic Ceramics Market Overview by Application
3.5.3 Japan
3.5.3.1 Japanese Monolithic Ceramics Market Overview by Ceramic Type
3.5.3.1.1 Japanese Monolithic Oxide Ceramics Market Overview by Sub-Type
3.5.3.2 Japanese Monolithic Ceramics Market Overview by Application
3.5.4 South Korea
3.5.4.1 Korean Monolithic Ceramics Market Overview by Ceramic Type
3.5.4.1.1 Korean Monolithic Oxide Ceramics Market Overview by Sub-Type
3.5.4.2 Korean Monolithic Ceramics Market Overview by Application
3.5.5 Taiwan
3.5.5.1 Taiwanese Monolithic Ceramics Market Overview by Ceramic Type
3.5.5.1.1 Taiwanese Monolithic Oxide Ceramics Market Overview by Sub-Type
3.5.5.2 Taiwanese Monolithic Ceramics Market Overview by Application
3.5.6 Rest of Asia-Pacific
3.5.6.1 Rest of Asia-Pacific Monolithic Ceramics Market Overview by Ceramic Type
3.5.6.1.1 Rest of Asia-Pacific Monolithic Oxide Ceramics Market Overview by Sub-Type
3.5.6.2 Rest of Asia-Pacific Monolithic Ceramics Market Overview by Application
4. LATIN AMERICA
4.1 Latin American Monolithic Ceramics Market Overview by Geographic Region
4.2 Latin American Monolithic Ceramics Market Overview by Ceramic Type
4.2.1 North American Monolithic Oxide Ceramics Market Overview by Sub-Type
4.2.2 Monolithic Ceramic Types Market Overview by Latin American Region
4.2.2.1 Non-Oxides
4.2.2.2 Oxides
4.2.2.2.1 Monolithic Oxide Ceramics Sub-Types Market Overview by Latin American Region
4.2.2.2.1.1 Aluminum Oxide
4.2.2.2.1.2 Zirconium Oxide
4.3 Latin American Monolithic Ceramics Market Overview by Application
4.3.1 Monolithic Ceramics Applications Market Overview by Latin American Region
4.3.1.1 Catalyst Supports
4.3.1.2 Electrical & Electronic Components
4.3.1.3 Filters
4.3.1.4 Wear Components
4.3.1.5 Other Applications
4.4 Country-wise Analysis of Latin American Monolithic Ceramics Market
4.4.1 Argentina
4.4.1.1 Argentine Monolithic Ceramics Market Overview by Ceramic Type
4.4.1.1.1 Argentine Monolithic Oxide Ceramics Market Overview by Sub-Type
4.4.1.2 Argentine Monolithic Ceramics Market Overview by Application
4.4.2 Brazil
4.4.2.1 Brazilian Monolithic Ceramics Market Overview by Ceramic Type
4.4.2.1.1 Brazilian Monolithic Oxide Ceramics Market Overview by Sub-Type
4.4.2.2 Brazilian Monolithic Ceramics Market Overview by Application
4.4.3 Mexico
4.4.3.1 Mexican Monolithic Ceramics Market Overview by Ceramic Type
4.4.3.1.1 Mexican Monolithic Oxide Ceramics Market Overview by Sub-Type
4.4.3.2 Mexican Monolithic Ceramics Market Overview by Application
4.4.4 Rest of Latin America
4.4.4.1 Rest of Latin America Monolithic Ceramics Market Overview by Ceramic Type
4.4.4.1.1 Rest of Latin America Monolithic Oxide Ceramics Market Overview by Sub-Type
4.4.4.2 Rest of Latin America Monolithic Ceramics Market Overview by Application
5. REST OF WORLD
5.1 Rest of World Monolithic Ceramics Market Overview by Ceramic Type
5.1.1 Rest of World Monolithic Oxide Ceramics Market Overview by Sub-Type
5.2 Rest of World Monolithic Ceramics Market Overview by Application
PART C: GUIDE TO THE INDUSTRY
1. NORTH AMERICA
2. EUROPE
3. ASIA-PACIFIC
4. REST OF WORLD
PART D: ANNEXURE
1. RESEARCH METHODOLOGY
2. FEEDBACK
Charts & Graphs
PART A: GLOBAL MARKET PERSPECTIVE
Chart 1: Global Monolithic Ceramics Market (2017 & 2022) by Application in USD Million
Chart 2: Global Monolithic Ceramics Market (2017 & 2022) by Geographic Region in USD Million
Chart 3: Trending of Monolithic Ceramics as Catalyst Supports (2017 & 2022)
Chart 4: Trending of Monolithic Ceramics as Electrical & Electronic Components (2017 & 2022)
Chart 5: Trending of Monolithic Ceramics as Filters (2017 & 2022)
Chart 6: Trending of Monolithic Ceramics as Wear Components (2017 & 2022)
Chart 7: Trending of Monolithic Ceramics in Other Applications (2017 & 2022)
Chart 8: Global Monolithic Ceramics Market Analysis (2014-2022) in USD Million
Chart 9: Global Monolithic Ceramics Market Analysis (2014-2022) by Ceramic Type – Non-Oxides and Oxides in USD Million
Chart 10: Glance at 2014, 2017 and 2022 Global Monolithic Ceramics Market Share (%) by Ceramic Type – Non-Oxides and Oxides
Chart 11: Global Monolithic Oxide Ceramics Market Analysis (2014-2022) by Ceramic Sub-Type – Aluminum Oxide and Zirconium Oxide in USD Million
Chart 12: Glance at 2014, 2017 and 2022 Global Monolithic Oxide Ceramics Market Share (%) by Ceramic Sub-Type – Aluminum Oxide and Zirconium Oxide
Chart 13: Global Monolithic Non-Oxide Ceramics Market Analysis (2014-2022) by Geographic Region – North America, Europe, Asia-Pacific, Latin America and Rest of World in USD Million
Chart 14: Glance at 2014, 2017 and 2022 Global Monolithic Non-Oxide Ceramics Market Share (%) by Geographic Region – North America, Europe, Asia-Pacific, Latin America and Rest of World
Chart 15: Global Monolithic Oxide Ceramics Market Analysis (2014-2022) by Geographic Region – North America, Europe, Asia-Pacific, Latin America and Rest of World in USD Million
Chart 16: Glance at 2014, 2017 and 2022 Global Monolithic Oxide Ceramics Market Share (%) by Geographic Region – North America, Europe, Asia-Pacific, Latin America and Rest of World
Chart 17: Global Monolithic Aluminum Oxide Ceramics Market Analysis (2014-2022) by Geographic Region – North America, Europe, Asia-Pacific, Latin America and Rest of World in USD Million
Chart 18: Glance at 2014, 2017 and 2022 Global Monolithic Aluminum Oxide Ceramics Market Share (%) by Geographic Region – North America, Europe, Asia-Pacific, Latin America and Rest of World
Chart 19: Global Monolithic Zirconium Oxide Ceramics Market Analysis (2014-2022) by Geographic Region – North America, Europe, Asia-Pacific, Latin America and Rest of World in USD Million
Chart 20: Glance at 2014, 2017 and 2022 Global Monolithic Zirconium Oxide Ceramics Market Share (%) by Geographic Region – North America, Europe, Asia-Pacific, Latin America and Rest of World
Chart 21: Global Monolithic Ceramics Market Analysis (2014-2022) by Application – Catalyst Supports, Electrical & Electronic Components, Filters, Wear Components and Other Applications in USD Million
Chart 22: Glance at 2014, 2017 and 2022 Global Monolithic Oxide Ceramics Market Share (%) by Application – Catalyst Supports, Electrical & Electronic Components, Filters, Wear Components and Other Applications
Chart 23: Global Monolithic Ceramics Market Analysis (2014-2022) in Catalyst Supports by Geographic Region – North America, Europe, Asia-Pacific, Latin America and Rest of World in USD Million
Chart 24: Glance at 2014, 2017 and 2022 Global Monolithic Ceramics Market Share (%) in Catalyst Supports by Geographic Region – North America, Europe, Asia-Pacific, Latin America and Rest of World
Chart 25: Global Monolithic Ceramics Market Analysis (2014-2022) in Electrical & Electronic Components by Geographic Region – North America, Europe, Asia-Pacific, Latin America and Rest of World in USD Million
Chart 26: Glance at 2014, 2017 and 2022 Global Monolithic Ceramics Market Share (%) in Electrical & Electronic Components by Geographic Region – North America, Europe, Asia-Pacific, Latin America and Rest of World
Chart 27: Global Monolithic Ceramics Market Analysis (2014-2022) in Filters by Geographic Region – North America, Europe, Asia-Pacific, Latin America and Rest of World in USD Million
Chart 28: Glance at 2014, 2017 and 2022 Global Monolithic Ceramics Market Share (%) in Filters by Geographic Region – North America, Europe, Asia-Pacific, Latin America and Rest of World
Chart 29: Global Monolithic Ceramics Market Analysis (2014-2022) in Wear Components by Geographic Region – North America, Europe, Asia-Pacific, Latin America and Rest of World in USD Million
Chart 30: Glance at 2014, 2017 and 2022 Global Monolithic Ceramics Market Share (%) in Wear Components by Geographic Region – North America, Europe, Asia-Pacific, Latin America and Rest of World
Chart 31: Global Monolithic Ceramics Market Analysis (2014-2022) in Other Applications by Geographic Region – North America, Europe, Asia-Pacific, Latin America and Rest of World in USD Million
Chart 32: Glance at 2014, 2017 and 2022 Global Monolithic Ceramics Market Share (%) in Other Applications by Geographic Region – North America, Europe, Asia-Pacific, Latin America and Rest of World
PART B: REGIONAL MARKET PERSPECTIVE
Chart 33: Global Monolithic Ceramics Market Analysis (2014-2022) by Geographic Region – North America, Europe, Asia-Pacific, Latin America and Rest of World in USD Million
Chart 34: Glance at 2014, 2017 and 2022 Global Monolithic Ceramics Market Share (%) by Geographic Region – North America, Europe, Asia-Pacific, Latin America and Rest of World
REGIONAL MARKET OVERVIEW
NORTH AMERICA
Chart 35: North American Monolithic Ceramics Market Analysis (2014-2022) in USD Million
Chart 36: North American Monolithic Ceramics Market Analysis (2014-2022) by Geographic Region – United States and Canada in USD Million
Chart 37: Glance at 2014, 2017 and 2022 North American Monolithic Ceramics Market Share (%) by Geographic Region – United States and Canada
Chart 38: North American Monolithic Ceramics Market Analysis (2014-2022) by Ceramic Type – Non-Oxides and Oxides in USD Million
Chart 39: Glance at 2014, 2017 and 2022 North American Monolithic Ceramics Market Share (%) by Ceramic Type – Non-Oxides and Oxides
Chart 40: North American Monolithic Oxide Ceramics Market Analysis (2014-2022) by Ceramic Sub-Type – Aluminum Oxide and Zirconium Oxide in USD Million
Chart 41: Glance at 2014, 2017 and 2022 North American Monolithic Oxide Ceramics Market Share (%) by Ceramic Sub-Type – Aluminum Oxide and Zirconium Oxide
Chart 42: North American Monolithic Non-Oxide Ceramics Market Analysis (2014-2022) by Geographic Region – United States and Canada in USD Million
Chart 43: Glance at 2014, 2017 and 2022 North American Monolithic Non-Oxide Ceramics Market Share (%) by Geographic Region – United States and Canada
Chart 44: North American Monolithic Oxide Ceramics Market Analysis (2014-2022) by Geographic Region – United States and Canada in USD Million
Chart 45: Glance at 2014, 2017 and 2022 North American Monolithic Oxide Ceramics Market Share (%) by Geographic Region – United States and Canada
Chart 46: North American Monolithic Aluminum Oxide Ceramics Market Analysis (2014-2022) by Geographic Region – United States and Canada in USD Million
Chart 47: Glance at 2014, 2017 and 2022 North American Monolithic Aluminum Oxide Ceramics Market Share (%) by Geographic Region – United States and Canada
Chart 48: North American Monolithic Zirconium Oxide Ceramics Market Analysis (2014-2022) by Geographic Region – United States and Canada in USD Million
Chart 49: Glance at 2014, 2017 and 2022 North American Monolithic Zirconium Oxide Ceramics Market Share (%) by Geographic Region – United States and Canada
Chart 50: North American Monolithic Ceramics Market Analysis (2014-2022) by Application – Catalyst Supports, Electrical & Electronic Components, Filters, Wear Components and Other Applications in USD Million
Chart 51: Glance at 2014, 2017 and 2022 North American Monolithic Oxide Ceramics Market Share (%) by Application – Catalyst Supports, Electrical & Electronic Components, Filters, Wear Components and Other Applications
Chart 52: North American Monolithic Ceramics Market Analysis (2014-2022) in Catalyst Supports by Geographic Region – United States and Canada in USD Million
Chart 53: Glance at 2014, 2017 and 2022 North American Monolithic Ceramics Market Share (%) in Catalyst Supports by Geographic Region – United States and Canada
Chart 54: North American Monolithic Ceramics Market Analysis (2014-2022) in Electrical & Electronic Components by Geographic Region – United States and Canada in USD Million
Chart 55: Glance at 2014, 2017 and 2022 North American Monolithic Ceramics Market Share (%) in Electrical & Electronic Components by Geographic Region – United States and Canada
Chart 56: North American Monolithic Ceramics Market Analysis (2014-2022) in Filters by Geographic Region – United States and Canada in USD Million
Chart 57: Glance at 2014, 2017 and 2022 North American Monolithic Ceramics Market Share (%) in Filters by Geographic Region – United States and Canada
Chart 58: North American Monolithic Ceramics Market Analysis (2014-2022) in Wear Components by Geographic Region – United States and Canada in USD Million
Chart 59: Glance at 2014, 2017 and 2022 North American Monolithic Ceramics Market Share (%) in Wear Components by Geographic Region – United States and Canada
Chart 60: North American Monolithic Ceramics Market Analysis (2014-2022) in Other Applications by Geographic Region – United States and Canada in USD Million
Chart 61: Glance at 2014, 2017 and 2022 North American Monolithic Ceramics Market Share (%) in Other Applications by Geographic Region – United States and Canada
The United States
Chart 62: United States Monolithic Ceramics Market Analysis (2014-2022) in USD Million
Chart 63: United States Monolithic Ceramics Market Analysis (2014-2022) by Ceramic Type – Non-Oxides and Oxides in USD Million
Chart 64: Glance at 2014, 2017 and 2022 United States Monolithic Ceramics Market Share (%) by Ceramic Type – Non-Oxides and Oxides
Chart 65: United States Monolithic Oxide Ceramics Market Analysis (2014-2022) by Ceramic Sub-Type – Aluminum Oxide and Zirconium Oxide in USD Million
Chart 66: Glance at 2014, 2017 and 2022 United States Monolithic Oxide Ceramics Market Share (%) by Ceramic Sub-Type – Aluminum Oxide and Zirconium Oxide
Chart 67: United States Monolithic Ceramics Market Analysis (2014-2022) by Application – Catalyst Supports, Electrical & Electronic Components, Filters, Wear Components and Other Applications in USD Million
Chart 68: Glance at 2014, 2017 and 2022 United States Monolithic Oxide Ceramics Market Share (%) by Application – Catalyst Supports, Electrical & Electronic Components, Filters, Wear Components and Other Applications
Canada
Chart 69: Canadian Monolithic Ceramics Market Analysis (2014-2022) in USD Million
Chart 70: Canadian Monolithic Ceramics Market Analysis (2014-2022) by Ceramic Type – Non-Oxides and Oxides in USD Million
Chart 71: Glance at 2014, 2017 and 2022 Canadian Monolithic Ceramics Market Share (%) by Ceramic Type – Non-Oxides and Oxides
Chart 72: Canadian Monolithic Oxide Ceramics Market Analysis (2014-2022) by Ceramic Sub-Type – Aluminum Oxide and Zirconium Oxide in USD Million
Chart 73: Glance at 2014, 2017 and 2022 Canadian Monolithic Oxide Ceramics Market Share (%) by Ceramic Sub-Type – Aluminum Oxide and Zirconium Oxide
Chart 74: Canadian Monolithic Ceramics Market Analysis (2014-2022) by Application – Catalyst Supports, Electrical & Electronic Components, Filters, Wear Components and Other Applications in USD Million
Chart 75: Glance at 2014, 2017 and 2022 Canadian Monolithic Oxide Ceramics Market Share (%) by Application – Catalyst Supports, Electrical & Electronic Components, Filters, Wear Components and Other Applications
EUROPE
Chart 76: European Monolithic Ceramics Market Analysis (2014-2022) in USD Million
Chart 77: European Monolithic Ceramics Market Analysis (2014-2022) by Geographic Region – France, Germany, Italy, Russia, Spain, United Kingdom and Rest of Europe in USD Million
Chart 78: Glance at 2014, 2017 and 2022 European Monolithic Ceramics Market Share (%) by Geographic Region – France, Germany, Italy, Russia, Spain, United Kingdom and Rest of Europe
Chart 79: European Monolithic Ceramics Market Analysis (2014-2022) by Ceramic Type – Non-Oxides and Oxides in USD Million
Chart 80: Glance at 2014, 2017 and 2022 European Monolithic Ceramics Market Share (%) by Ceramic Type – Non-Oxides and Oxides
Chart 81: European Monolithic Oxide Ceramics Market Analysis (2014-2022) by Ceramic Sub-Type – Aluminum Oxide and Zirconium Oxide in USD Million
Chart 82: Glance at 2014, 2017 and 2022 European Monolithic Oxide Ceramics Market Share (%) by Ceramic Sub-Type – Aluminum Oxide and Zirconium Oxide
Chart 83: European Monolithic Non-Oxide Ceramics Market Analysis (2014-2022) by Geographic Region – France, Germany, Italy, Russia, Spain, United Kingdom and Rest of Europe in USD Million
Chart 84: Glance at 2014, 2017 and 2022 European Monolithic Non-Oxide Ceramics Market Share (%) by Geographic Region – France, Germany, Italy, Russia, Spain, United Kingdom and Rest of Europe
Chart 85: European Monolithic Oxide Ceramics Market Analysis (2014-2022) by Geographic Region – France, Germany, Italy, Russia, Spain, United Kingdom and Rest of Europe in USD Million
Chart 86: Glance at 2014, 2017 and 2022 European Monolithic Oxide Ceramics Market Share (%) by Geographic Region – France, Germany, Italy, Russia, Spain, United Kingdom and Rest of Europe
Chart 87: European Monolithic Aluminum Oxide Ceramics Market Analysis (2014-2022) by Geographic Region – France, Germany, Italy, Russia, Spain, United Kingdom and Rest of Europe in USD Million
Chart 88: Glance at 2014, 2017 and 2022 European Monolithic Aluminum Oxide Ceramics Market Share (%) by Geographic Region – France, Germany, Italy, Russia, Spain, United Kingdom and Rest of Europe
Chart 89: European Monolithic Zirconium Oxide Ceramics Market Analysis (2014-2022) by Geographic Region – France, Germany, Italy, Russia, Spain, United Kingdom and Rest of Europe in USD Million
Chart 90: Glance at 2014, 2017 and 2022 European Monolithic Zirconium Oxide Ceramics Market Share (%) by Geographic Region – France, Germany, Italy, Russia, Spain, United Kingdom and Rest of Europe
Chart 91: European Monolithic Ceramics Market Analysis (2014-2022) by Application – Catalyst Supports, Electrical & Electronic Components, Filters, Wear Components and Other Applications in USD Million
Chart 92: Glance at 2014, 2017 and 2022 European Monolithic Oxide Ceramics Market Share (%) by Application – Catalyst Supports, Electrical & Electronic Components, Filters, Wear Components and Other Applications
Chart 93: European Monolithic Ceramics Market Analysis (2014-2022) in Catalyst Supports by Geographic Region – France, Germany, Italy, Russia, Spain, United Kingdom and Rest of Europe in USD Million
Chart 94: Glance at 2014, 2017 and 2022 European Monolithic Ceramics Market Share (%) in Catalyst Supports by Geographic Region – France, Germany, Italy, Russia, Spain, United Kingdom and Rest of Europe
Chart 95: European Monolithic Ceramics Market Analysis (2014-2022) in Electrical & Electronic Components by Geographic Region – France, Germany, Italy, Russia, Spain, United Kingdom and Rest of Europe in USD Million
Chart 96: Glance at 2014, 2017 and 2022 European Monolithic Ceramics Market Share (%) in Electrical & Electronic Components by Geographic Region – France, Germany, Italy, Russia, Spain, United Kingdom and Rest of Europe
Chart 97: European Monolithic Ceramics Market Analysis (2014-2022) in Filters by Geographic Region – France, Germany, Italy, Russia, Spain, United Kingdom and Rest of Europe in USD Million
Chart 98: Glance at 2014, 2017 and 2022 European Monolithic Ceramics Market Share (%) in Filters by Geographic Region – France, Germany, Italy, Russia, Spain, United Kingdom and Rest of Europe
Chart 99: European Monolithic Ceramics Market Analysis (2014-2022) in Wear Components by Geographic Region – France, Germany, Italy, Russia, Spain, United Kingdom and Rest of Europe in USD Million
Chart 100: Glance at 2014, 2017 and 2022 European Monolithic Ceramics Market Share (%) in Wear Components by Geographic Region – France, Germany, Italy, Russia, Spain, United Kingdom and Rest of Europe
Chart 101: European Monolithic Ceramics Market Analysis (2014-2022) in Other Applications by Geographic Region – France, Germany, Italy, Russia, Spain, United Kingdom and Rest of Europe in USD Million
Chart 102: Glance at 2014, 2017 and 2022 European Monolithic Ceramics Market Share (%) in Other Applications by Geographic Region – France, Germany, Italy, Russia, Spain, United Kingdom and Rest of Europe
France
Chart 103: French Monolithic Ceramics Market Analysis (2014-2022) in USD Million
Chart 104: French Monolithic Ceramics Market Analysis (2014-2022) by Ceramic Type – Non-Oxides and Oxides in USD Million
Chart 105: Glance at 2014, 2017 and 2022 French Monolithic Ceramics Market Share (%) by Ceramic Type – Non-Oxides and Oxides
Chart 106: French Monolithic Oxide Ceramics Market Analysis (2014-2022) by Ceramic Sub-Type – Aluminum Oxide and Zirconium Oxide in USD Million
Chart 107: Glance at 2014, 2017 and 2022 French Monolithic Oxide Ceramics Market Share (%) by Ceramic Sub-Type – Aluminum Oxide and Zirconium Oxide
Chart 108: French Monolithic Ceramics Market Analysis (2014-2022) by Application – Catalyst Supports, Electrical & Electronic Components, Filters, Wear Components and Other Applications in USD Million
Chart 109: Glance at 2014, 2017 and 2022 French Monolithic Oxide Ceramics Market Share (%) by Application – Catalyst Supports, Electrical & Electronic Components, Filters, Wear Components and Other Applications
Germany
Chart 110: German Monolithic Ceramics Market Analysis (2014-2022) in USD Million
Chart 111: German Monolithic Ceramics Market Analysis (2014-2022) by Ceramic Type – Non-Oxides and Oxides in USD Million
Chart 112: Glance at 2014, 2017 and 2022 German Monolithic Ceramics Market Share (%) by Ceramic Type – Non-Oxides and Oxides
Chart 113: German Monolithic Oxide Ceramics Market Analysis (2014-2022) by Ceramic Sub-Type – Aluminum Oxide and Zirconium Oxide in USD Million
Chart 114: Glance at 2014, 2017 and 2022 German Monolithic Oxide Ceramics Market Share (%) by Ceramic Sub-Type – Aluminum Oxide and Zirconium Oxide
Chart 115: German Monolithic Ceramics Market Analysis (2014-2022) by Application – Catalyst Supports, Electrical & Electronic Components, Filters, Wear Components and Other Applications in USD Million
Chart 116: Glance at 2014, 2017 and 2022 German Monolithic Oxide Ceramics Market Share (%) by Application – Catalyst Supports, Electrical & Electronic Components, Filters, Wear Components and Other Applications
Italy
Chart 117: Italian Monolithic Ceramics Market Analysis (2014-2022) in USD Million
Chart 118: Italian Monolithic Ceramics Market Analysis (2014-2022) by Ceramic Type – Non-Oxides and Oxides in USD Million
Chart 119: Glance at 2014, 2017 and 2022 Italian Monolithic Ceramics Market Share (%) by Ceramic Type – Non-Oxides and Oxides
Chart 120: Italian Monolithic Oxide Ceramics Market Analysis (2014-2022) by Ceramic Sub-Type – Aluminum Oxide and Zirconium Oxide in USD Million
Chart 121: Glance at 2014, 2017 and 2022 Italian Monolithic Oxide Ceramics Market Share (%) by Ceramic Sub-Type – Aluminum Oxide and Zirconium Oxide
Chart 122: Italian Monolithic Ceramics Market Analysis (2014-2022) by Application – Catalyst Supports, Electrical & Electronic Components, Filters, Wear Components and Other Applications in USD Million
Chart 123: Glance at 2014, 2017 and 2022 Italian Monolithic Oxide Ceramics Market Share (%) by Application – Catalyst Supports, Electrical & Electronic Components, Filters, Wear Components and Other Applications
Russia
Chart 124: Russian Monolithic Ceramics Market Analysis (2014-2022) in USD Million
Chart 125: Russian Monolithic Ceramics Market Analysis (2014-2022) by Ceramic Type – Non-Oxides and Oxides in USD Million
Chart 126: Glance at 2014, 2017 and 2022 Russian Monolithic Ceramics Market Share (%) by Ceramic Type – Non-Oxides and Oxides
Chart 127: Russian Monolithic Oxide Ceramics Market Analysis (2014-2022) by Ceramic Sub-Type – Aluminum Oxide and Zirconium Oxide in USD Million
Chart 128: Glance at 2014, 2017 and 2022 Russian Monolithic Oxide Ceramics Market Share (%) by Ceramic Sub-Type – Aluminum Oxide and Zirconium Oxide
Chart 129: Russian Monolithic Ceramics Market Analysis (2014-2022) by Application – Catalyst Supports, Electrical & Electronic Components, Filters, Wear Components and Other Applications in USD Million
Chart 130: Glance at 2014, 2017 and 2022 Russian Monolithic Oxide Ceramics Market Share (%) by Application – Catalyst Supports, Electrical & Electronic Components, Filters, Wear Components and Other Applications
Spain
Chart 131: Spanish Monolithic Ceramics Market Analysis (2014-2022) in USD Million
Chart 132: Spanish Monolithic Ceramics Market Analysis (2014-2022) by Ceramic Type – Non-Oxides and Oxides in USD Million
Chart 133: Glance at 2014, 2017 and 2022 Spanish Monolithic Ceramics Market Share (%) by Ceramic Type – Non-Oxides and Oxides
Chart 134: Spanish Monolithic Oxide Ceramics Market Analysis (2014-2022) by Ceramic Sub-Type – Aluminum Oxide and Zirconium Oxide in USD Million
Chart 135: Glance at 2014, 2017 and 2022 Spanish Monolithic Oxide Ceramics Market Share (%) by Ceramic Sub-Type – Aluminum Oxide and Zirconium Oxide
Chart 136: Spanish Monolithic Ceramics Market Analysis (2014-2022) by Application – Catalyst Supports, Electrical & Electronic Components, Filters, Wear Components and Other Applications in USD Million
Chart 137: Glance at 2014, 2017 and 2022 Spanish Monolithic Oxide Ceramics Market Share (%) by Application – Catalyst Supports, Electrical & Electronic Components, Filters, Wear Components and Other Applications
The United Kingdom
Chart 138: United Kingdom Monolithic Ceramics Market Analysis (2014-2022) in USD Million
Chart 139: United Kingdom Monolithic Ceramics Market Analysis (2014-2022) by Ceramic Type – Non-Oxides and Oxides in USD Million
Chart 140: Glance at 2014, 2017 and 2022 United Kingdom Monolithic Ceramics Market Share (%) by Ceramic Type – Non-Oxides and Oxides
Chart 141: United Kingdom Monolithic Oxide Ceramics Market Analysis (2014-2022) by Ceramic Sub-Type – Aluminum Oxide and Zirconium Oxide in USD Million
Chart 142: Glance at 2014, 2017 and 2022 United Kingdom Monolithic Oxide Ceramics Market Share (%) by Ceramic Sub-Type – Aluminum Oxide and Zirconium Oxide
Chart 143: United Kingdom Monolithic Ceramics Market Analysis (2014-2022) by Application – Catalyst Supports, Electrical & Electronic Components, Filters, Wear Components and Other Applications in USD Million
Chart 144: Glance at 2014, 2017 and 2022 United Kingdom Monolithic Oxide Ceramics Market Share (%) by Application – Catalyst Supports, Electrical & Electronic Components, Filters, Wear Components and Other Applications
Rest of Europe
Chart 145: Rest of Europe Monolithic Ceramics Market Analysis (2014-2022) in USD Million
Chart 146: Rest of Europe Monolithic Ceramics Market Analysis (2014-2022) by Ceramic Type – Non-Oxides and Oxides in USD Million
Chart 147: Glance at 2014, 2017 and 2022 Rest of Europe Monolithic Ceramics Market Share (%) by Ceramic Type – Non-Oxides and Oxides
Chart 148: Rest of Europe Monolithic Oxide Ceramics Market Analysis (2014-2022) by Ceramic Sub-Type – Aluminum Oxide and Zirconium Oxide in USD Million
Chart 149: Glance at 2014, 2017 and 2022 Rest of Europe Monolithic Oxide Ceramics Market Share (%) by Ceramic Sub-Type – Aluminum Oxide and Zirconium Oxide
Chart 150: Rest of Europe Monolithic Ceramics Market Analysis (2014-2022) by Application – Catalyst Supports, Electrical & Electronic Components, Filters, Wear Components and Other Applications in USD Million
Chart 151: Glance at 2014, 2017 and 2022 Rest of Europe Monolithic Oxide Ceramics Market Share (%) by Application – Catalyst Supports, Electrical & Electronic Components, Filters, Wear Components and Other Applications
ASIA-PACIFIC
Chart 152: Asia-Pacific Monolithic Ceramics Market Analysis (2014-2022) in USD Million
Chart 153: Asia-Pacific Monolithic Ceramics Market Analysis (2014-2022) by Geographic Region – China, India, Japan, South Korea, Taiwan and Rest of Asia-Pacific in USD Million
Chart 154: Glance at 2014, 2017 and 2022 Asia-Pacific Monolithic Ceramics Market Share (%) by Geographic Region – China, India, Japan, South Korea, Taiwan and Rest of Asia-Pacific
Chart 155: Asia-Pacific Monolithic Ceramics Market Analysis (2014-2022) by Ceramic Type – Non-Oxides and Oxides in USD Million
Chart 156: Glance at 2014, 2017 and 2022 Asia-Pacific Monolithic Ceramics Market Share (%) by Ceramic Type – Non-Oxides and Oxides
Chart 157: Asia-Pacific Monolithic Oxide Ceramics Market Analysis (2014-2022) by Ceramic Sub-Type – Aluminum Oxide and Zirconium Oxide in USD Million
Chart 158: Glance at 2014, 2017 and 2022 Asia-Pacific Monolithic Oxide Ceramics Market Share (%) by Ceramic Sub-Type – Aluminum Oxide and Zirconium Oxide
Chart 159: Asia-Pacific Monolithic Non-Oxide Ceramics Market Analysis (2014-2022) by Geographic Region – China, India, Japan, South Korea, Taiwan and Rest of Asia-Pacific in USD Million
Chart 160: Glance at 2014, 2017 and 2022 Asia-Pacific Monolithic Non-Oxide Ceramics Market Share (%) by Geographic Region – China, India, Japan, South Korea, Taiwan and Rest of Asia-Pacific
Chart 161: Asia-Pacific Monolithic Oxide Ceramics Market Analysis (2014-2022) by Geographic Region – China, India, Japan, South Korea, Taiwan and Rest of Asia-Pacific in USD Million
Chart 162: Glance at 2014, 2017 and 2022 Asia-Pacific Monolithic Oxide Ceramics Market Share (%) by Geographic Region – China, India, Japan, South Korea, Taiwan and Rest of Asia-Pacific
Chart 163: Asia-Pacific Monolithic Aluminum Oxide Ceramics Market Analysis (2014-2022) by Geographic Region – China, India, Japan, South Korea, Taiwan and Rest of Asia-Pacific in USD Million
Chart 164: Glance at 2014, 2017 and 2022 Asia-Pacific Monolithic Aluminum Oxide Ceramics Market Share (%) by Geographic Region – China, India, Japan, South Korea, Taiwan and Rest of Asia-Pacific
Chart 165: Asia-Pacific Monolithic Zirconium Oxide Ceramics Market Analysis (2014-2022) by Geographic Region – China, India, Japan, South Korea, Taiwan and Rest of Asia-Pacific in USD Million
Chart 166: Glance at 2014, 2017 and 2022 Asia-Pacific Monolithic Zirconium Oxide Ceramics Market Share (%) by Geographic Region – China, India, Japan, South Korea, Taiwan and Rest of Asia-Pacific
Chart 167: Asia-Pacific Monolithic Ceramics Market Analysis (2014-2022) by Application – Catalyst Supports, Electrical & Electronic Components, Filters, Wear Components and Other Applications in USD Million
Chart 168: Glance at 2014, 2017 and 2022 Asia-Pacific Monolithic Oxide Ceramics Market Share (%) by Application – Catalyst Supports, Electrical & Electronic Components, Filters, Wear Components and Other Applications
Chart 169: Asia-Pacific Monolithic Ceramics Market Analysis (2014-2022) in Catalyst Supports by Geographic Region – China, India, Japan, South Korea, Taiwan and Rest of Asia-Pacific in USD Million
Chart 170: Glance at 2014, 2017 and 2022 Asia-Pacific Monolithic Ceramics Market Share (%) in Catalyst Supports by Geographic Region – China, India, Japan, South Korea, Taiwan and Rest of Asia-Pacific
Chart 171: Asia-Pacific Monolithic Ceramics Market Analysis (2014-2022) in Electrical & Electronic Components by Geographic Region – China, India, Japan, South Korea, Taiwan and Rest of Asia-Pacific in USD Million
Chart 172: Glance at 2014, 2017 and 2022 Asia-Pacific Monolithic Ceramics Market Share (%) in Electrical & Electronic Components by Geographic Region – China, India, Japan, South Korea, Taiwan and Rest of Asia-Pacific
Chart 173: Asia-Pacific Monolithic Ceramics Market Analysis (2014-2022) in Filters by Geographic Region – China, India, Japan, South Korea, Taiwan and Rest of Asia-Pacific in USD Million
Chart 174: Glance at 2014, 2017 and 2022 Asia-Pacific Monolithic Ceramics Market Share (%) in Filters by Geographic Region – China, India, Japan, South Korea, Taiwan and Rest of Asia-Pacific
Chart 175: Asia-Pacific Monolithic Ceramics Market Analysis (2014-2022) in Wear Components by Geographic Region – China, India, Japan, South Korea, Taiwan and Rest of Asia-Pacific in USD Million
Chart 176: Glance at 2014, 2017 and 2022 Asia-Pacific Monolithic Ceramics Market Share (%) in Wear Components by Geographic Region – China, India, Japan, South Korea, Taiwan and Rest of Asia-Pacific
Chart 177: Asia-Pacific Monolithic Ceramics Market Analysis (2014-2022) in Other Applications by Geographic Region – China, India, Japan, South Korea, Taiwan and Rest of Asia-Pacific in USD Million
Chart 178: Glance at 2014, 2017 and 2022 Asia-Pacific Monolithic Ceramics Market Share (%) in Other Applications by Geographic Region – China, India, Japan, South Korea, Taiwan and Rest of Asia-Pacific
China
Chart 179: Chinese Monolithic Ceramics Market Analysis (2014-2022) in USD Million
Chart 180: Chinese Monolithic Ceramics Market Analysis (2014-2022) by Ceramic Type – Non-Oxides and Oxides in USD Million
Chart 181: Glance at 2014, 2017 and 2022 Chinese Monolithic Ceramics Market Share (%) by Ceramic Type – Non-Oxides and Oxides
Chart 182: Chinese Monolithic Oxide Ceramics Market Analysis (2014-2022) by Ceramic Sub-Type – Aluminum Oxide and Zirconium Oxide in USD Million
Chart 183: Glance at 2014, 2017 and 2022 Chinese Monolithic Oxide Ceramics Market Share (%) by Ceramic Sub-Type – Aluminum Oxide and Zirconium Oxide
Chart 184: Chinese Monolithic Ceramics Market Analysis (2014-2022) by Application – Catalyst Supports, Electrical & Electronic Components, Filters, Wear Components and Other Applications in USD Million
Chart 185: Glance at 2014, 2017 and 2022 Chinese Monolithic Oxide Ceramics Market Share (%) by Application – Catalyst Supports, Electrical & Electronic Components, Filters, Wear Components and Other Applications
India
Chart 186: Indian Monolithic Ceramics Market Analysis (2014-2022) in USD Million
Chart 187: Indian Monolithic Ceramics Market Analysis (2014-2022) by Ceramic Type – Non-Oxides and Oxides in USD Million
Chart 188: Glance at 2014, 2017 and 2022 Indian Monolithic Ceramics Market Share (%) by Ceramic Type – Non-Oxides and Oxides
Chart 189: Indian Monolithic Oxide Ceramics Market Analysis (2014-2022) by Ceramic Sub-Type – Aluminum Oxide and Zirconium Oxide in USD Million
Chart 190: Glance at 2014, 2017 and 2022 Indian Monolithic Oxide Ceramics Market Share (%) by Ceramic Sub-Type – Aluminum Oxide and Zirconium Oxide
Chart 191: Indian Monolithic Ceramics Market Analysis (2014-2022) by Application – Catalyst Supports, Electrical & Electronic Components, Filters, Wear Components and Other Applications in USD Million
Chart 192: Glance at 2014, 2017 and 2022 Indian Monolithic Oxide Ceramics Market Share (%) by Application – Catalyst Supports, Electrical & Electronic Components, Filters, Wear Components and Other Applications
Japan
Chart 193: Japanese Monolithic Ceramics Market Analysis (2014-2022) in USD Million
Chart 194: Japanese Monolithic Ceramics Market Analysis (2014-2022) by Ceramic Type – Non-Oxides and Oxides in USD Million
Chart 195: Glance at 2014, 2017 and 2022 Japanese Monolithic Ceramics Market Share (%) by Ceramic Type – Non-Oxides and Oxides
Chart 196: Japanese Monolithic Oxide Ceramics Market Analysis (2014-2022) by Ceramic Sub-Type – Aluminum Oxide and Zirconium Oxide in USD Million
Chart 197: Glance at 2014, 2017 and 2022 Japanese Monolithic Oxide Ceramics Market Share (%) by Ceramic Sub-Type – Aluminum Oxide and Zirconium Oxide
Chart 198: Japanese Monolithic Ceramics Market Analysis (2014-2022) by Application – Catalyst Supports, Electrical & Electronic Components, Filters, Wear Components and Other Applications in USD Million
Chart 199: Glance at 2014, 2017 and 2022 Japanese Monolithic Oxide Ceramics Market Share (%) by Application – Catalyst Supports, Electrical & Electronic Components, Filters, Wear Components and Other Applications
South Korea
Chart 200: South Korean Monolithic Ceramics Market Analysis (2014-2022) in USD Million
Chart 201: South Korean Monolithic Ceramics Market Analysis (2014-2022) by Ceramic Type – Non-Oxides and Oxides in USD Million
Chart 202: Glance at 2014, 2017 and 2022 South Korean Monolithic Ceramics Market Share (%) by Ceramic Type – Non-Oxides and Oxides
Chart 203: South Korean Monolithic Oxide Ceramics Market Analysis (2014-2022) by Ceramic Sub-Type – Aluminum Oxide and Zirconium Oxide in USD Million
Chart 204: Glance at 2014, 2017 and 2022 South Korean Monolithic Oxide Ceramics Market Share (%) by Ceramic Sub-Type – Aluminum Oxide and Zirconium Oxide
Chart 205: South Korean Monolithic Ceramics Market Analysis (2014-2022) by Application – Catalyst Supports, Electrical & Electronic Components, Filters, Wear Components and Other Applications in USD Million
Chart 206: Glance at 2014, 2017 and 2022 South Korean Monolithic Oxide Ceramics Market Share (%) by Application – Catalyst Supports, Electrical & Electronic Components, Filters, Wear Components and Other Applications
Taiwan
Chart 207: Taiwanese Monolithic Ceramics Market Analysis (2014-2022) in USD Million
Chart 208: Taiwanese Monolithic Ceramics Market Analysis (2014-2022) by Ceramic Type – Non-Oxides and Oxides in USD Million
Chart 209: Glance at 2014, 2017 and 2022 Taiwanese Monolithic Ceramics Market Share (%) by Ceramic Type – Non-Oxides and Oxides
Chart 210: Taiwanese Monolithic Oxide Ceramics Market Analysis (2014-2022) by Ceramic Sub-Type – Aluminum Oxide and Zirconium Oxide in USD Million
Chart 211: Glance at 2014, 2017 and 2022 Taiwanese Monolithic Oxide Ceramics Market Share (%) by Ceramic Sub-Type – Aluminum Oxide and Zirconium Oxide
Chart 212: Taiwanese Monolithic Ceramics Market Analysis (2014-2022) by Application – Catalyst Supports, Electrical & Electronic Components, Filters, Wear Components and Other Applications in USD Million
Chart 213: Glance at 2014, 2017 and 2022 Taiwanese Monolithic Oxide Ceramics Market Share (%) by Application – Catalyst Supports, Electrical & Electronic Components, Filters, Wear Components and Other Applications
Rest of Asia-Pacific
Chart 214: Rest of Asia-Pacific Monolithic Ceramics Market Analysis (2014-2022) in USD Million
Chart 215: Rest of Asia-Pacific Monolithic Ceramics Market Analysis (2014-2022) by Ceramic Type – Non-Oxides and Oxides in USD Million
Chart 216: Glance at 2014, 2017 and 2022 Rest of Asia-Pacific Monolithic Ceramics Market Share (%) by Ceramic Type – Non-Oxides and Oxides
Chart 217: Rest of Asia-Pacific Monolithic Oxide Ceramics Market Analysis (2014-2022) by Ceramic Sub-Type – Aluminum Oxide and Zirconium Oxide in USD Million
Chart 218: Glance at 2014, 2017 and 2022 Rest of Asia-Pacific Monolithic Oxide Ceramics Market Share (%) by Ceramic Sub-Type – Aluminum Oxide and Zirconium Oxide
Chart 219: Rest of Asia-Pacific Monolithic Ceramics Market Analysis (2014-2022) by Application – Catalyst Supports, Electrical & Electronic Components, Filters, Wear Components and Other Applications in USD Million
Chart 220: Glance at 2014, 2017 and 2022 Rest of Asia-Pacific Monolithic Oxide Ceramics Market Share (%) by Application – Catalyst Supports, Electrical & Electronic Components, Filters, Wear Components and Other Applications
LATIN AMERICA
Chart 221: Latin American Monolithic Ceramics Market Analysis (2014-2022) in USD Million
Chart 222: Latin American Monolithic Ceramics Market Analysis (2014-2022) by Region – Argentina, Brazil, Mexico and Rest of Latin America in USD Million
Chart 223: Glance at 2014, 2017 and 2022 Latin American Monolithic Ceramics Market Share (%) by Region – Argentina, Brazil, Mexico and Rest of Latin America
Chart 224: Latin American Monolithic Ceramics Market Analysis (2014-2022) by Ceramic Type – Non-Oxides and Oxides in USD Million
Chart 225: Glance at 2014, 2017 and 2022 Latin American Monolithic Ceramics Market Share (%) by Ceramic Type – Non-Oxides and Oxides
Chart 226: Latin American Monolithic Oxide Ceramics Market Analysis (2014-2022) by Ceramic Sub-Type – Aluminum Oxide and Zirconium Oxide in USD Million
Chart 227: Glance at 2014, 2017 and 2022 Latin American Monolithic Oxide Ceramics Market Share (%) by Ceramic Sub-Type – Aluminum Oxide and Zirconium Oxide
Chart 228: Latin American Monolithic Non-Oxide Ceramics Market Analysis (2014-2022) by Region – Argentina, Brazil, Mexico and Rest of Latin America in USD Million
Chart 229: Glance at 2014, 2017 and 2022 Latin American Monolithic Non-Oxide Ceramics Market Share (%) by Region – Argentina, Brazil, Mexico and Rest of Latin America
Chart 230: Latin American Monolithic Oxide Ceramics Market Analysis (2014-2022) by Region – Argentina, Brazil, Mexico and Rest of Latin America in USD Million
Chart 231: Glance at 2014, 2017 and 2022 Latin American Monolithic Oxide Ceramics Market Share (%) by Region – Argentina, Brazil, Mexico and Rest of Latin America
Chart 232: Latin American Monolithic Aluminum Oxide Ceramics Market Analysis (2014-2022) by Region – Argentina, Brazil, Mexico and Rest of Latin America in USD Million
Chart 233: Glance at 2014, 2017 and 2022 Latin American Monolithic Aluminum Oxide Ceramics Market Share (%) by Region – Argentina, Brazil, Mexico and Rest of Latin America
Chart 234: Latin American Monolithic Zirconium Oxide Ceramics Market Analysis (2014-2022) by Region – Argentina, Brazil, Mexico and Rest of Latin America in USD Million
Chart 235: Glance at 2014, 2017 and 2022 Latin American Monolithic Zirconium Oxide Ceramics Market Share (%) by Region – Argentina, Brazil, Mexico and Rest of Latin America
Chart 236: Latin American Monolithic Ceramics Market Analysis (2014-2022) by Application – Catalyst Supports, Electrical & Electronic Components, Filters, Wear Components and Other Applications in USD Million
Chart 237: Glance at 2014, 2017 and 2022 Latin American Monolithic Oxide Ceramics Market Share (%) by Application – Catalyst Supports, Electrical & Electronic Components, Filters, Wear Components and Other Applications
Chart 238: Latin American Monolithic Ceramics Market Analysis (2014-2022) in Catalyst Supports by Region – Argentina, Brazil, Mexico and Rest of Latin America in USD Million
Chart 239: Glance at 2014, 2017 and 2022 Latin American Monolithic Ceramics Market Share (%) in Catalyst Supports by Region – Argentina, Brazil, Mexico and Rest of Latin America
Chart 240: Latin American Monolithic Ceramics Market Analysis (2014-2022) in Electrical & Electronic Components by Region – Argentina, Brazil, Mexico and Rest of Latin America in USD Million
Chart 241: Glance at 2014, 2017 and 2022 Latin American Monolithic Ceramics Market Share (%) in Electrical & Electronic Components by Region – Argentina, Brazil, Mexico and Rest of Latin America
Chart 242: Latin American Monolithic Ceramics Market Analysis (2014-2022) in Filters by Region – Argentina, Brazil, Mexico and Rest of Latin America in USD Million
Chart 243: Glance at 2014, 2017 and 2022 Latin American Monolithic Ceramics Market Share (%) in Filters by Region – Argentina, Brazil, Mexico and Rest of Latin America
Chart 244: Latin American Monolithic Ceramics Market Analysis (2014-2022) in Wear Components by Region – Argentina, Brazil, Mexico and Rest of Latin America in USD Million
Chart 245: Glance at 2014, 2017 and 2022 Latin American Monolithic Ceramics Market Share (%) in Wear Components by Region – Argentina, Brazil, Mexico and Rest of Latin America
Chart 246: Latin American Monolithic Ceramics Market Analysis (2014-2022) in Other Applications by Region – Argentina, Brazil, Mexico and Rest of Latin America in USD Million
Chart 247: Glance at 2014, 2017 and 2022 Latin American Monolithic Ceramics Market Share (%) in Other Applications by Region – Argentina, Brazil, Mexico and Rest of Latin America
Argentina
Chart 248: Argentine Monolithic Ceramics Market Analysis (2014-2022) in USD Million
Chart 249: Argentine Monolithic Ceramics Market Analysis (2014-2022) by Ceramic Type – Non-Oxides and Oxides in USD Million
Chart 250: Glance at 2014, 2017 and 2022 Argentine Monolithic Ceramics Market Share (%) by Ceramic Type – Non-Oxides and Oxides
Chart 251: Argentine Monolithic Oxide Ceramics Market Analysis (2014-2022) by Ceramic Sub-Type – Aluminum Oxide and Zirconium Oxide in USD Million
Chart 252: Glance at 2014, 2017 and 2022 Argentine Monolithic Oxide Ceramics Market Share (%) by Ceramic Sub-Type – Aluminum Oxide and Zirconium Oxide
Chart 253: Argentine Monolithic Ceramics Market Analysis (2014-2022) by Application – Catalyst Supports, Electrical & Electronic Components, Filters, Wear Components and Other Applications in USD Million
Chart 254: Glance at 2014, 2017 and 2022 Argentine Monolithic Oxide Ceramics Market Share (%) by Application – Catalyst Supports, Electrical & Electronic Components, Filters, Wear Components and Other Applications
Brazil
Chart 255: Brazilian Monolithic Ceramics Market Analysis (2014-2022) in USD Million
Chart 256: Brazilian Monolithic Ceramics Market Analysis (2014-2022) by Ceramic Type – Non-Oxides and Oxides in USD Million
Chart 257: Glance at 2014, 2017 and 2022 Brazilian Monolithic Ceramics Market Share (%) by Ceramic Type – Non-Oxides and Oxides
Chart 258: Brazilian Monolithic Oxide Ceramics Market Analysis (2014-2022) by Ceramic Sub-Type – Aluminum Oxide and Zirconium Oxide in USD Million
Chart 259: Glance at 2014, 2017 and 2022 Brazilian Monolithic Oxide Ceramics Market Share (%) by Ceramic Sub-Type – Aluminum Oxide and Zirconium Oxide
Chart 260: Brazilian Monolithic Ceramics Market Analysis (2014-2022) by Application – Catalyst Supports, Electrical & Electronic Components, Filters, Wear Components and Other Applications in USD Million
Chart 261: Glance at 2014, 2017 and 2022 Brazilian Monolithic Oxide Ceramics Market Share (%) by Application – Catalyst Supports, Electrical & Electronic Components, Filters, Wear Components and Other Applications
Mexico
Chart 262: Mexican Monolithic Ceramics Market Analysis (2014-2022) in USD Million
Chart 263: Mexican Monolithic Ceramics Market Analysis (2014-2022) by Ceramic Type – Non-Oxides and Oxides in USD Million
Chart 264: Glance at 2014, 2017 and 2022 Mexican Monolithic Ceramics Market Share (%) by Ceramic Type – Non-Oxides and Oxides
Chart 265: Mexican Monolithic Oxide Ceramics Market Analysis (2014-2022) by Ceramic Sub-Type – Aluminum Oxide and Zirconium Oxide in USD Million
Chart 266: Glance at 2014, 2017 and 2022 Mexican Monolithic Oxide Ceramics Market Share (%) by Ceramic Sub-Type – Aluminum Oxide and Zirconium Oxide
Chart 267: Mexican Monolithic Ceramics Market Analysis (2014-2022) by Application – Catalyst Supports, Electrical & Electronic Components, Filters, Wear Components and Other Applications in USD Million
Chart 268: Glance at 2014, 2017 and 2022 Mexican Monolithic Oxide Ceramics Market Share (%) by Application – Catalyst Supports, Electrical & Electronic Components, Filters, Wear Components and Other Applications
Rest of Latin America
Chart 269: Rest of Latin America Monolithic Ceramics Market Analysis (2014-2022) in USD Million
Chart 270: Rest of Latin America Monolithic Ceramics Market Analysis (2014-2022) by Ceramic Type – Non-Oxides and Oxides in USD Million
Chart 271: Glance at 2014, 2017 and 2022 Rest of Latin America Monolithic Ceramics Market Share (%) by Ceramic Type – Non-Oxides and Oxides
Chart 272: Rest of Latin America Monolithic Oxide Ceramics Market Analysis (2014-2022) by Ceramic Sub-Type – Aluminum Oxide and Zirconium Oxide in USD Million
Chart 273: Glance at 2014, 2017 and 2022 Rest of Latin America Monolithic Oxide Ceramics Market Share (%) by Ceramic Sub-Type – Aluminum Oxide and Zirconium Oxide
Chart 274: Rest of Latin America Monolithic Ceramics Market Analysis (2014-2022) by Application – Catalyst Supports, Electrical & Electronic Components, Filters, Wear Components and Other Applications in USD Million
Chart 275: Glance at 2014, 2017 and 2022 Rest of Latin America Monolithic Oxide Ceramics Market Share (%) by Application – Catalyst Supports, Electrical & Electronic Components, Filters, Wear Components and Other Applications
REST OF WORLD
Chart 276: Rest of World Monolithic Ceramics Market Analysis (2014-2022) in USD Million
Chart 277: Rest of World Monolithic Ceramics Market Analysis (2014-2022) by Ceramic Type – Non-Oxides and Oxides in USD Million
Chart 278: Glance at 2014, 2017 and 2022 Rest of World Monolithic Ceramics Market Share (%) by Ceramic Type – Non-Oxides and Oxides
Chart 279: Rest of World Monolithic Oxide Ceramics Market Analysis (2014-2022) by Ceramic Sub-Type – Aluminum Oxide and Zirconium Oxide in USD Million
Chart 280: Glance at 2014, 2017 and 2022 Rest of World Monolithic Oxide Ceramics Market Share (%) by Ceramic Sub-Type – Aluminum Oxide and Zirconium Oxide
Chart 281: Rest of World Monolithic Ceramics Market Analysis (2014-2022) by Application – Catalyst Supports, Electrical & Electronic Components, Filters, Wear Components and Other Applications in USD Million
Chart 282: Glance at 2014, 2017 and 2022 Rest of World Monolithic Oxide Ceramics Market Share (%) by Application – Catalyst Supports, Electrical & Electronic Components, Filters, Wear Components and Other Applications
Tables:
Table 1: Various Properties of Aluminum Nitride (AlN)
Table 2: Various Properties of Boron Nitride (BN)
Table 3: Variety of Mechanical Properties of Si3N4 Ceramics
Table 4: Brief Explanation of the Various Terms Typically Associated with Silicon Nitride Processing
Table 5: Various Properties of Silicon Nitride (Si3N4)
Table 6: Various Properties of Tungsten Carbide (WC)
Table 7: Various Properties of Boron Carbide (B4C)
Table 8: Various Properties of Silicon Carbide (SiC)
Table 9: Terminology Commonly Associated with Silicon Carbide Processing
Table 10: Typical Physical and Mechanical Properties of Titanium Diboride (TiB2)
Table 11: Properties of Various Grades of Alumina (Al2O3)
Table 12: Applications of Various Grades of Alumina
Table 13: Properties of Zirconium Oxide or Zirconia (Zro2)
Table 14: Application Areas of Microfiltration, Ultrafiltration and Reverse Osmosis Membranes in Various Industries
Table 15: List of Various Industries where FGCs are Either Being Used Currently or offer Future Potential Applications
Advanced Ceramics Manufacturing, LLC
Ceradyne, Inc.
Ceramtec GmbH
Coorstek, Inc.
Elan Technology, Inc.
Ferro Corporation
HC Starck GmbH
Kyocera Corporation
Materion Corporation
Mcdanel Advanced Ceramic Technologies, LLC
Momentive Performance Materials, Inc
Morgan Advanced Materials PLC
Murata Manufacturing Co., Ltd.
NGK Insulators Limited
Rauschert Group
Saint-Gobain Ceramic Materials
Zircoa, Inc.
PLEASE SELECT LICENSE TYPE
RELATED REPORTS
Sulfone Polymers (PSU, PPSU & PESU) – A Global Market Overview
Report Code: CP041 | Pages: 398 | Price: $4500
Published
Apr 2024
Engineering Plastics – A Global Market Overview
Report Code: CP002 | Pages: 535 | Price: $5400
Published
Feb 2024
Modified Polyphenylene Ether (mPPE) – A Global Market Overview
Report Code: CP116 | Pages: 188 | Price: $4050
Published
Jan 2024
Titanium Dioxide (TiO2) – A Global Market Overview
Report Code: CP040 | Pages: 252 | Price: $4050
Published
Jan 2024
Global Bioadhesives Market – Types and Applications
Report Code: CP102 | Pages: 212 | Price: $4500
Published
Jun 2023