Published Date: Mar 2018
Report Code: CP060
Pages: 448
Charts: 237
Report Synopsis
Inorganic pigments are comparatively easier to disperse and the dispersion process typically requires three principal components, i.e., pigment, surfactant and grinding vehicle. These three ingredients are precisely calculated and blended during the formulation process. The processing of pigment dispersions faces the challenge of stabilizing the primary particle size and if this is not performed appropriately, the pigment aggregates into groups interconnected through intermolecular forces. Since inorganic pigments are easier to disperse compared to organic pigments, they are extensively utilized in several plastic, printing ink and paint & coating applications. These favorable characteristics of inorganic pigments are likely to drive future market growth.
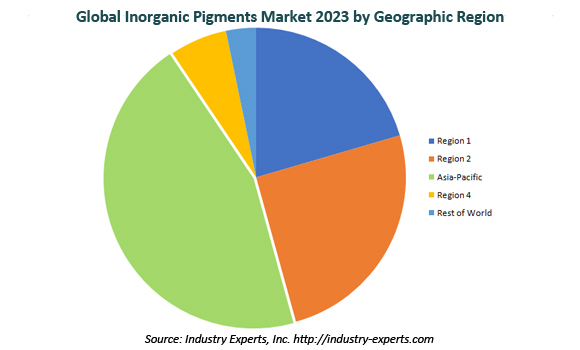
Asia-Pacific is the largest global market for Inorganic Pigments and also the fastest growing, with the region’s dominance very likely to continue. Rapid industrialization, infrastructure building and a burgeoning automotive industry in regions, such as China and India, will increase demand for paints & coatings, the largest and fastest growing application area for inorganic pigments. The worldwide market is estimated at US$16 billion in 2017 and is forecast to reach US$16.8 billion in 2018.
Research Findings & Coverage
- The global market for Inorganic Pigments market is explored in this study with respect to pigment types and major application areas
- The study extensively analyzes each major application of inorganic pigments with market snapshot for the analysis period
- Titanium Dioxide Features in Color Trends of 2018
- Advancements in High-Performance Carbon Black Cover Emerging Trends
- Carbon Black Goes �Green�
- Key business trends focusing on product innovations/developments, M&As, JVs and other recent industry developments
- Major companies profiled – 57
- The industry guide includes the contact details for 204 companies
Product Outline
The report analyzes the market for the key types of Inorganic Pigments including:
- Cadmium
- Carbon Black
- Chromium Oxide
- Iron Oxide
- Titanium Dioxide
- Others
Application Areas of Inorganic Pigments analyzed comprise the following:
- Paints & Coatings
- Plastics
- Printing Inks
- Other Applications
Analysis Period, Units and Growth Rates
- The report reviews, analyzes and projects the global Inorganic Pigments market for the period 2014-2023 in terms of market value in US$ and the compound annual growth rates (CAGRs) projected from 2017 through 2023
Geographic Coverage
- North America (The United States, Canada and Mexico)
- Europe (France, Germany, Italy, Russia, Spain, The United Kingdom and Rest of Europe)
- Asia-Pacific (China, India, Japan, South Korea and Rest of Asia-Pacific)
- South America (Argentina, Brazil and Rest of South America)
- Rest of World
PART A: GLOBAL MARKET PERSPECTIVE
1. INTRODUCTION
1.1 Product Outline
1.1.1 Pigments Defined
1.1.2 The Colour Index System
1.1.3 Inorganic Pigments
1.1.3.1 Chemical Composition of Inorganic Pigments
1.1.3.2 Light, Weather, Heat and Chemical Stability of Inorganic Pigments
1.1.4 Types of Inorganic Pigments
1.1.4.1 Cadmium Pigments
1.1.4.1.1 Cadmium Orange
1.1.4.1.2 Cadmium Mercury Orange
1.1.4.1.3 Cadmium Red
1.1.4.1.4 Mercury Cadmium Red
1.1.4.1.5 Cadmium Zinc Yellow
1.1.4.1.6 Cadmium Sulfide Yellow
1.1.4.2 Carbon Black
1.1.4.2.1 Production of Carbon Black
1.1.4.2.2 General Properties of Carbon Black
1.1.4.2.3 Essential Properties of Carbon Black
1.1.4.2.4 Color Properties of Carbon Black
1.1.4.3 Chromium Oxide Pigments
1.1.4.3.1 Cobalt Chromate
1.1.4.3.2 Chrome Green
1.1.4.3.3 Chromium Oxide Green
1.1.4.3.4 Hydrated Chromium Oxide Green
1.1.4.3.5 Chrome Orange
1.1.4.3.6 Primrose Chrome Yellow
1.1.4.4 Iron Oxide Pigments
1.1.4.4.1 Inorganic Browns
1.1.4.4.2 Iron Oxide Reds
1.1.4.4.3 Iron Oxide Yellows
1.1.4.5 Titanium Dioxide
1.1.4.5.1 Titanium Resources
1.1.4.5.2 Principal Mineral Deposits of Titanium
1.1.4.5.3 Titanium Ores
1.1.4.5.4 Production of Titanium Dioxide Pigments
1.1.4.5.5 Properties of Titanium Dioxide
1.1.4.6 Other Inorganic Pigments
1.1.4.6.1 Iron Blue
1.1.4.6.2 Cobalt Blue
1.1.4.6.3 Ultramarine Blue
1.1.4.6.4 Mixed Metal Oxide Browns
1.1.4.6.5 Mixed Metal Oxide Greens
1.1.4.6.6 Molybdate Orange
1.1.4.6.7 Ultramarine Violet
1.1.4.6.8 Manganese Violet
1.1.4.6.9 Mixed Metal Oxide Violets
1.1.4.6.10 Strontium Yellow
1.1.4.6.11 Zinc Chromate
1.1.4.6.12 Mixed Metal Oxide Yellows
1.1.4.6.13 Bismuth Vanadate/Molybdate Yellow
2. INORGANIC PIGMENTS’ APPLICATIONS – A GLOBAL MARKET SNAPSHOT
2.1 Paints & Coatings
2.1.1 Titanium Dioxide
2.1.2 Carbon Black
2.1.3 Iron Oxide Pigments
2.1.4 Chromium Oxide Pigments
2.1.5 Cadmium Pigments
2.1.6 Ultramarine Pigments
2.1.7 Blue Iron Pigments
2.2 Plastics
2.2.1 White Pigments
2.2.2 Black Pigments
2.2.3 Colored Inorganic Pigments
2.3 Printing Inks
2.3.1 Iron Oxide Yellows
2.3.2 Chrome Yellows
2.3.3 Cadmium Yellow
2.3.4 Milori Blue, Iron Blue, Bronze Blue, Prussian Blue and Chinese Blue
2.3.5 Ultramarine Blue
2.3.6 Ultramarine Violet
2.3.7 Brown Iron Oxides
2.3.8 Chromium Antimony Titanium Buff Rutile
2.3.9 Carbon Black
2.3.10 Titanium Dioxide
2.4 Other Applications
2.4.1 Cosmetics
2.4.2 Food
2.4.3 Textiles
3. KEY MARKET TRENDS
3.1 Titanium Dioxide Features in Color Trends of 2018
3.2 Advancements in High-Performance Carbon Black Cover Emerging Trends
3.3 Despite Negatives, Cadmium Pigments Market to Maintain Growth
3.4 Titanium Dioxide-Based Billboards Purify Air
3.5 Carbon Black Goes �Green�
3.6 Titanium Dioxide-Kaolin Mixed Pigments Enhance Performance of Anticorrosive Paints
4. KEY GLOBAL PLAYERS
BASF SE (Germany)
Carl Schlenk AG (Germany)
Albo Schlenk s.r.o. (Czech Republic)
Kamnik-Schlenk d.o.o. (Slovenia)
Pigmenti Metallici srl. (Italy)
Schlenk Metallic Pigments (United States)
Schlenk Metallic Pigments (Shanghai) Co. Ltd. (China)
Cathay Industries (Hong Kong)
Hoover Color Corporation (United States)
Cathay Industries USA, Inc. (United States)
Cathay Industries Europe N.V. (Belgium)
Cathay Industries Australasia Pty Ltd (Australia)
Cristal Group - National Titanium Dioxide Company (Saudi Arabia)
Dainichiseika Color & Chemicals Mfg. Co., Ltd. (Japan)
Sambo Fine Chemicals Mfg. Co., Ltd. (South Korea)
Ferro Corporation (United States)
Cappelle Pigments NV (Belgium)
Ferro Performance Pigments Spain S.L. (Spain)
Heubach GmbH (Germany)
Heubach Colour Pvt., Ltd. (India)
Heucotech Ltd. (United States)
Lanxess Deutschland GmbH (Germany)
Merck KGaA (Germany)
Orion Engineered Carbons GmbH (Germany)
The Chemours Company (United States)
Toda Kogyo Corp. (Japan)
Toda Pigment Corp. (Japan)
Zhejiang Huayuan Pigment Co., Ltd. (China)
Toda United Industrial (Zhejiang) Co., Ltd. (China)
Tronox Limited (United States)
Venator Materials Plc (United States)
5. KEY BUSINESS/PRODUCT TRENDS
Lomon Billions Group Establishes Two New Chloride TiO2 Manufacturing Plants in Jiaozuo, Henan Province, China
Venator Unveils New GRANUDIN® Pigments
Tronox Limited to Acquire Cristal
LANXESS Launches New series of Iron Oxide Red Pigments
Cathay Industries Launches Cathaytherm™ Thermostable Inorganic Color Pigments
Clariant Introduces Telasperse PVC pigment preparation
Cathay Industries Introduces CATHAYRED™ Red Iron Oxide Pigments
The Shepherd Color Company Launches New YInMn Blue Pigment
Sun Chemical Acquires Joules Angstrom U.V. Printing Inks Corp
Cathay Industries Unveils CATHAYGRANTM Pigment
ECKART Showcase Metallic and Pearlescent Pigments at Labelexpo Europe 2017 in Brussels
Orion Engineered Carbons S.A Unveils New Carbon Black Pigment ‘XPB 430’
Ferro Corporation Expands Ultramarine Pigments Production Capacity
Merck KGaA Presents New Iriotec® 8826 Pigment at Laser World of Photonics 2017 Exhibition, Munich
Cabot Corporation Widens its NORIT® E 153 Activated Carbon Colorants Portfolio
Merck KGaA and Schmid Rhyner AG Join Forces on 3D Technology with Pigment Effect for Printing Applications
Venator Develops New HOMBITAN® AFDC 101 Pigment
Venator Launches ALTIRIS® W400 pigment
Clariant Launches Super-Transparent Preparation ‘Hostatint™ A 100-ST’
Cabot Corporation Expands its Silica and other Pigment Products
LANSCO Colors Employs Northspec Chemicals as Exclusive Distributor in Canada
BASF and Landa Group Enter into Strategic Partnership on Revolutionary Pigments
Lomon Billions Group Showcases LOMON®R-996 Titanium Dioxide Pigment
BILLIONS®TR52 Pigment from Lomon Billions Group Delivers High Performance
LANXESS Expands its Production Capacities for Iron Oxide Pigments
BASF Introduces Sicopal® Red EH 2370 Pigment
Heubach Establishes New Manufacturing Plant in Philadelphia, US
Ferro Corporation Acquires Cappelle Pigments
Merck KGaA Launches Xirallic® NXT Cougar Red Pigment
Merck KGaA Unveils Ronastar® Red Allure Pigment
American Securities to Acquire Chromaflo Technologies Corp
Heubach Increases its bismuth vanadate pigments capacity in Germany
Heubach Expands its Complex Inorganic Color Pigments (CICPs) in Germany
Clariant, Konica Minolta and Matchmycolor Join Forces
Henan Billions Chemicals Company Ltd and Sichuan Lomon Titanium Industry Company Ltd Merge to Form Lomon Billions
ECKART GmbH Showcases Innovative Pigments in D�sseldorf, Germany
Chemours Opens New Titanium Dioxide (TiO2) Production Center in Mexico
Toyo Ink SC Holdings Co., Ltd Raises its stake in Joint Venture Company Jiangsu Toyo Renxin Pigment Co., Ltd
BASF Expands its Pigment Production
Merck KGaA Introduces Thermaval™ Pigments for Ceramics Industry
Clariant Unveils Agrocer™ Seed Colorants
Cathay Industries Completes Hoover Color Corporation Acquisition
Cathay Industries Expands in China
Clariant Establishes New Pigment Production Plant in Mexico
Merck KGaA Launches Candurin® NXT Ruby Red Pigment
LANXESS Showcases Organic Macrolex Granule Colorants
BASF Unveils New Global Pigment Brand ‘Colors & Effects’
Cristal and PURETi Group Enter into Strategic Partnership for Promoting CristalACTiV™ Photocatalytic Materials Applications
Cristal Introduces New Titanium Dioxide Chloride Pigment TiONA® 288
Cathay Industries Launches CATHAYCOATTM LV Grades
BASF Launches Two New Pigments, Firemist® Velvet Gold and Firemist Velvet Russet
Cappelle Pigments Launches Lysopac Yellow 9410C Pigment
Ferro Corporation Buys Nubiola
BASF to Establish Global Business Unit
BASF Unveils New Pigments for Automotive Coatings Usage
BASF Rolls out New Lumina® Royal Effect Pigments
Clariant Buys Black Pigment Preparations business from Lanxess
BASF Increases Paliocrom® Effect Pigments Production
6. GLOBAL MARKET OVERVIEW
6.1 Global Inorganic Pigments Market Overview by Type
6.1.1 Inorganic Pigment Type Market Overview by Global Region
6.1.1.1 Cadmium Pigments
6.1.1.2 Carbon Black
6.1.1.3 Chromium Oxide
6.1.1.4 Iron Oxide
6.1.1.5 Titanium Dioxide
6.1.1.6 Other Inorganic Pigments
6.2 Global Inorganic Pigments Market Overview by Application
6.2.1 Inorganic Pigments Application Market Overview by Global Region
6.2.1.1 Paints & Coatings
6.2.1.2 Plastics
6.2.1.3 Printing Inks
6.2.1.4 Other Applications
PART B: REGIONAL MARKET PERSPECTIVE
REGIONAL MARKET OVERVIEW
1. NORTH AMERICA
1.1 North American Inorganic Pigments Market Overview by Geographic Region
1.2 North American Inorganic Pigments Market Overview by Type
1.2.1 Inorganic Pigment Type Market Overview by NA Region
1.2.1.1 Cadmium Pigments
1.2.1.2 Carbon Black
1.2.1.3 Chromium Oxide
1.2.1.4 Iron Oxide
1.2.1.5 Titanium Dioxide
1.2.1.6 Other Inorganic Pigments
1.3 North American Inorganic Pigments Market Overview by Application
1.3.1 Inorganic Pigments Application Market Overview by NA Region
1.3.1.1 Paints & Coatings
1.3.1.2 Plastics
1.3.1.3 Printing Inks
1.3.1.4 Other Applications
1.4 Major Market Players
Cabot Corporation (United States)
Cathay Industries USA, Inc. (United States)
Chromaflo Technologies Corporation (United States)
Dominion Colour Corporation (Canada)
Ferro Corporation (United States)
Heucotech Ltd. (United States)
Hoover Color Corporation (United States) (Inorganic Pigments Only)
Kronos Worldwide, Inc. (United States)
Lansco Colors (United States)
Schlenk Metallic Pigments (United States)
Silberline Manufacturing Co., Inc. (United States)
The Chemours Company (United States)
The Shepherd Color Company (United States)
Tronox Limited (United States)
Venator Materials Plc (United States)
1.5 Country-wise Analysis of North American Inorganic Pigments Market
1.5.1 The United States
1.5.1.1 United States Inorganic Pigments Market Overview by Type
1.5.1.2 United States Inorganic Pigments Market Overview by Application
1.5.2 Canada
1.5.2.1 Canadian Inorganic Pigments Market Overview by Type
1.5.2.2 Canadian Inorganic Pigments Market Overview by Application
1.5.3 Mexico
1.5.3.1 Mexican Inorganic Pigments Market Overview by Type
1.5.3.2 Mexican Inorganic Pigments Market Overview by Application
2. EUROPE
2.1 European Inorganic Pigments Market Overview by Geographic Region
2.2 European Inorganic Pigments Market Overview by Type
2.2.1 Inorganic Pigment Type Market Overview by European Region
2.2.1.1 Cadmium Pigments
2.2.1.2 Carbon Black
2.2.1.3 Chromium Oxide
2.2.1.4 Iron Oxide
2.2.1.5 Titanium Dioxide
2.2.1.6 Other Inorganic Pigments
2.3 European Inorganic Pigments Market Overview by Application
2.3.1 Inorganic Pigments Application Market Overview by European Region
2.3.1.1 Paints & Coatings
2.3.1.2 Plastics
2.3.1.3 Printing Inks
2.3.1.4 Other Applications
2.4 Major Market Players
Altana AG (Germany)
ECKART GmbH (Germany)
BASF SE (Germany)
Cappelle Pigments NV (Belgium)
Carl Schlenk AG (Germany)
Albo Schlenk s.r.o. (Czech Republic)
Kamnik-Schlenk d.o.o. (Slovenia)
Pigmenti Metallici srl. (Italy)
Carlfors Bruk AB (Sweden)
Cathay Industries Europe N.V. (Belgium)
Ferro Performance Pigments Spain S.L. (Spain)
Flint Group S.A. (Luxembourg)
Heubach GmbH (Germany)
Lanxess Deutschland GmbH (Germany)
Merck KGaA (Germany)
Orion Engineered Carbons GmbH (Germany)
2.5 Country-wise Analysis of European Inorganic Pigments Market
2.5.1 France
2.5.1.1 French Inorganic Pigments Market Overview by Type
2.5.1.2 French Inorganic Pigments Market Overview by Application
2.5.2 Germany
2.5.2.1 German Inorganic Pigments Market Overview by Type
2.5.2.2 German Inorganic Pigments Market Overview by Application
2.5.3 Italy
2.5.3.1 Italian Inorganic Pigments Market Overview by Type
2.5.3.2 Italian Inorganic Pigments Market Overview by Application
2.5.4 Russia
2.5.4.1 Russian Inorganic Pigments Market Overview by Type
2.5.4.2 Russian Inorganic Pigments Market Overview by Application
2.5.5 Spain
2.5.5.1 Spanish Inorganic Pigments Market Overview by Type
2.5.5.2 Spanish Inorganic Pigments Market Overview by Application
2.5.6 The United Kingdom
2.5.6.1 United Kingdom Inorganic Pigments Market Overview by Type
2.5.6.2 United Kingdom Inorganic Pigments Market Overview by Application
2.5.7 Rest of Europe
2.5.7.1 Rest of Europe Inorganic Pigments Market Overview by Type
2.5.7.2 Rest of Europe Inorganic Pigments Market Overview by Application
3. ASIA-PACIFIC
3.1 Asia-Pacific Inorganic Pigments Market Overview by Geographic Region
3.2 Asia-Pacific Inorganic Pigments Market Overview by Type
3.2.1 Inorganic Pigment Type Market Overview by Asia-Pacific Region
3.2.1.1 Cadmium Pigments
3.2.1.2 Carbon Black
3.2.1.3 Chromium Oxide
3.2.1.4 Iron Oxide
3.2.1.5 Titanium Dioxide
3.2.1.6 Other Inorganic Pigments
3.3 Asia-Pacific Inorganic Pigments Market Overview by Application
3.3.1 Inorganic Pigments Application Market Overview by Asia-Pacific Region
3.3.1.1 Paints & Coatings
3.3.1.2 Plastics
3.3.1.3 Printing Inks
3.3.1.4 Other Applications
3.4 Major Market Players
Asahi Kasei Kogyo Co., Ltd. (Japan)
Cathay Industries (Hong Kong)
Cathay Industries Australasia Pty Ltd (Australia)
Dainichiseika Color & Chemicals Mfg. Co., Ltd. (Japan)
Dystar Singapore Pte Ltd. (Singapore)
Hefei Sunrise Aluminum Pigments Co., Ltd. (China)
Heubach Colour Pvt., Ltd. (India)
Ishihara Sangyo Kaisha, Ltd. (Japan)
Fuji Titanium Industry Co., Ltd. (Japan)
Kikuchi Color & Chemicals Corporation (Kikuchi Color Corporation) (Japan)
Lomon Billions Group (China)
Meghmani Pigments (India)
Sambo Fine Chemicals Mfg. Co., Ltd. (South Korea)
Schlenk Metallic Pigments (Shanghai) Co. Ltd. (China)
Sudarshan Chemical Industries Ltd. (India)
Tata Pigments Ltd. (India)
Toda Kogyo Corp. (Japan)
Toda Pigment Corp. (Japan)
Toda United Industrial (Zhejiang) Co., Ltd. (China)
Tokan Material Technology Co., Ltd. (Japan)
Trust Chem Co., Ltd. (China)
VIBFAST Pigments Pvt., Ltd. (India)
Voxco Pigments and Chemicals Pvt., Ltd. (India)
Zhangqiu Metallic Pigment Co., Ltd. (China)
Zhejiang Huayuan Pigment Co., Ltd. (China)
3.5 Country-wise Analysis of Asia-Pacific Inorganic Pigments Market
3.5.1 China
3.5.1.1 Chinese Inorganic Pigments Market Overview by Type
3.5.1.2 Chinese Inorganic Pigments Market Overview by Application
3.5.2 India
3.5.2.1 Indian Inorganic Pigments Market Overview by Type
3.5.2.2 Indian Inorganic Pigments Market Overview by Application
3.5.3 Japan
3.5.3.1 Japanese Inorganic Pigments Market Overview by Type
3.5.3.2 Japanese Inorganic Pigments Market Overview by Application
3.5.4 South Korea
3.5.4.1 Korean Inorganic Pigments Market Overview by Type
3.5.4.2 Korean Inorganic Pigments Market Overview by Application
3.5.5 Rest of Asia-Pacific
3.5.5.1 Rest of Asia-Pacific Inorganic Pigments Market Overview by Type
3.5.5.2 Rest of Asia-Pacific Inorganic Pigments Market Overview by Application
4. SOUTH AMERICA
4.1 South American Inorganic Pigments Market Overview by Geographic Region
4.2 South American Inorganic Pigments Market Overview by Type
4.2.1 Inorganic Pigment Type Market Overview by South American Region
4.2.1.1 Cadmium Pigments
4.2.1.2 Carbon Black
4.2.1.3 Chromium Oxide
4.2.1.4 Iron Oxide
4.2.1.5 Titanium Dioxide
4.2.1.6 Other Inorganic Pigments
4.3 South American Inorganic Pigments Market Overview by Application
4.3.1 Inorganic Pigments Application Market Overview by South American Region
4.3.1.1 Paints & Coatings
4.3.1.2 Plastics
4.3.1.3 Printing Inks
4.3.1.4 Other Applications
4.4 Country-wise Analysis of South American Inorganic Pigments Market
4.4.1 Argentina
4.4.1.1 Argentine Inorganic Pigments Market Overview by Type
4.4.1.2 Argentine Inorganic Pigments Market Overview by Application
4.4.2 Brazil
4.4.2.1 Brazilian Inorganic Pigments Market Overview by Type
4.4.2.2 Brazilian Inorganic Pigments Market Overview by Application
4.4.3 Rest of South America
4.4.3.1 Rest of South America Inorganic Pigments Market Overview by Type
4.4.3.2 Rest of South America Inorganic Pigments Market Overview by Application
5. REST OF WORLD
5.1 Rest of World Inorganic Pigments Market Overview by Type
5.2 Rest of World Inorganic Pigments Market Overview by Application
5.3 Major Market Player
Cristal Group - National Titanium Dioxide Company (Saudi Arabia)
PART C: GUIDE TO THE INDUSTRY
1. NORTH AMERICA
2. EUROPE
3. ASIA-PACIFIC
4. SOUTH AMERICA
5. REST OF WORLD
PART D: ANNEXURE
1. RESEARCH METHODOLOGY
2. FEEDBACK
Charts & Graphs
PART A: GLOBAL MARKET PERSPECTIVE
Chart 1: Global Inorganic Pigments Market (2017 & 2023) by Geographic Region
Chart 2: Global Inorganic Pigments Market (2017 & 2023) by Type
Chart 3: Global Inorganic Pigments Market (2017 & 2023) by Application
Chart 4: Trending of Inorganic Pigments in Paints & Coatings Applications Market (2017 & 2023)
Chart 5: Trending of Inorganic Pigments in Plastics Applications Market (2017 & 2023)
Chart 6: Trending of Inorganic Pigments in Printing Inks Applications Market (2017 & 2023)
Chart 7: Trending of Inorganic Pigments in Plastics Applications Market (2017 & 2023)
Chart 8: Global Inorganic Pigments Market Analysis (2014-2023) in USD Million
Chart 9: Global Inorganic Pigments Market Analysis (2014-2023) by Type – Cadmium, Carbon Black, Chromium Oxide, Iron Oxide, Titanium Dioxide and Other Inorganic Pigments in USD Million
Chart 10: Glance at 2014, 2018 and 2023 Global Inorganic Pigments Market Share (%) by Type – Cadmium, Carbon Black, Chromium Oxide, Iron Oxide, Titanium Dioxide and Other Inorganic Pigments
Chart 11: Global Cadmium Pigments Market Analysis (2014-2023) by Geographic Region – North America, Europe, Asia-Pacific, South America and Rest of World in USD Million
Chart 12: Glance at 2014, 2018 and 2023 Global Cadmium Pigments Market Share (%) by Geographic Region – North America, Europe, Asia-Pacific, South America and Rest of World
Chart 13: Global Carbon Black Market Analysis (2014-2023) by Geographic Region – North America, Europe, Asia-Pacific, South America and Rest of World in USD Million
Chart 14: Glance at 2014, 2018 and 2023 Global Carbon Black Market Share (%) by Geographic Region – North America, Europe, Asia-Pacific, South America and Rest of World
Chart 15: Global Chromium Oxide Market Analysis (2014-2023) by Geographic Region – North America, Europe, Asia-Pacific, South America and Rest of World in USD Million
Chart 16: Glance at 2014, 2018 and 2023 Global Chromium Oxide Market Share (%) by Geographic Region – North America, Europe, Asia-Pacific, South America and Rest of World
Chart 17: Global Iron Oxide Market Analysis (2014-2023) by Geographic Region – North America, Europe, Asia-Pacific, South America and Rest of World in USD Million
Chart 18: Glance at 2014, 2018 and 2023 Global Iron Oxide Market Share (%) by Geographic Region – North America, Europe, Asia-Pacific, South America and Rest of World
Chart 19: Global Titanium Dioxide Market Analysis (2014-2023) by Geographic Region – North America, Europe, Asia-Pacific, South America and Rest of World in USD Million
Chart 20: Glance at 2014, 2018 and 2023 Global Titanium Dioxide Market Share (%) by Geographic Region – North America, Europe, Asia-Pacific, South America and Rest of World
Chart 21: Global Other Inorganic Pigments Market Analysis (2014-2023) by Geographic Region – North America, Europe, Asia-Pacific, South America and Rest of World in USD Million
Chart 22: Glance at 2014, 2018 and 2023 Global Other Inorganic Pigments Market Share (%) by Geographic Region – North America, Europe, Asia-Pacific, South America and Rest of World
Chart 23: Global Inorganic Pigments Market Analysis (2014-2023) by Application – Paints & Coatings, Plastics, Printing Inks and Other Applications in USD Million
Chart 24: Glance at 2014, 2018 and 2023 Global Inorganic Pigments Market Share (%) by Application – Paints & Coatings, Plastics, Printing Inks and Other Applications
Chart 25: Global Inorganic Pigments Market Analysis (2014-2023) in Paints & Coatings by Geographic Region – North America, Europe, Asia-Pacific, South America and Rest of World in USD Million
Chart 26: Glance at 2014, 2018 and 2023 Global Inorganic Pigments Market Share (%) in Paints & Coatings by Geographic Region – North America, Europe, Asia-Pacific, South America and Rest of World
Chart 27: Global Inorganic Pigments Market Analysis (2014-2023) in Plastics by Geographic Region – North America, Europe, Asia-Pacific, South America and Rest of World in USD Million
Chart 28: Glance at 2014, 2018 and 2023 Global Inorganic Pigments Market Share (%) in Plastics by Geographic Region – North America, Europe, Asia-Pacific, South America and Rest of World
Chart 29: Global Inorganic Pigments Market Analysis (2014-2023) in Printing Inks by Geographic Region – North America, Europe, Asia-Pacific, South America and Rest of World in USD Million
Chart 30: Glance at 2014, 2018 and 2023 Global Inorganic Pigments Market Share (%) in Printing Inks by Geographic Region – North America, Europe, Asia-Pacific, South America and Rest of World
Chart 31: Global Inorganic Pigments Market Analysis (2014-2023) in Other Applications by Geographic Region – North America, Europe, Asia-Pacific, South America and Rest of World in USD Million
Chart 32: Glance at 2014, 2018 and 2023 Global Inorganic Pigments Market Share (%) in Other Applications by Geographic Region – North America, Europe, Asia-Pacific, South America and Rest of World
PART B: REGIONAL MARKET PERSPECTIVE
Chart 33: Global Inorganic Pigments Market Analysis (2014-2023) by Geographic Region – North America, Europe, Asia-Pacific, South America and Rest of World in USD Million
Chart 34: Glance at 2014, 2018 and 2023 Global Inorganic Pigments Market Share (%) by Geographic Region – North America, Europe, Asia-Pacific, South America and Rest of World
REGIONAL MARKET OVERVIEW
NORTH AMERICA
Chart 35: North American Inorganic Pigments Market Analysis (2014-2023) in USD Million
Chart 36: North American Inorganic Pigments Market Analysis (2014-2023) by Geographic Region – United States, Canada and Mexico in USD Million
Chart 37: Glance at 2014, 2018 and 2023 North American Inorganic Pigments Market Share (%) by Geographic Region – United States, Canada and Mexico
Chart 38: North American Inorganic Pigments Market Analysis (2014-2023) by Type – Cadmium, Carbon Black, Chromium Oxide, Iron Oxide, Titanium Dioxide and Other Inorganic Pigments in USD Million
Chart 39: Glance at 2014, 2018 and 2023 North American Inorganic Pigments Market Share (%) by Type – Cadmium, Carbon Black, Chromium Oxide, Iron Oxide, Titanium Dioxide and Other Inorganic Pigments
Chart 40: North American Cadmium Pigments Market Analysis (2014-2023) by Geographic Region – United States, Canada and Mexico in USD Million
Chart 41: Glance at 2014, 2018 and 2023 North American Cadmium Pigments Market Share (%) by Geographic Region – United States, Canada and Mexico
Chart 42: North American Carbon Black Market Analysis (2014-2023) by Geographic Region – United States, Canada and Mexico in USD Million
Chart 43: Glance at 2014, 2018 and 2023 North American Carbon Black Market Share (%) by Geographic Region – United States, Canada and Mexico
Chart 44: North American Chromium Oxide Market Analysis (2014-2023) by Geographic Region – United States, Canada and Mexico in USD Million
Chart 45: Glance at 2014, 2018 and 2023 North American Chromium Oxide Market Share (%) by Geographic Region – United States, Canada and Mexico
Chart 46: North American Iron Oxide Market Analysis (2014-2023) by Geographic Region – United States, Canada and Mexico in USD Million
Chart 47: Glance at 2014, 2018 and 2023 North American Iron Oxide Market Share (%) by Geographic Region – United States, Canada and Mexico
Chart 48: North American Titanium Dioxide Market Analysis (2014-2023) by Geographic Region – United States, Canada and Mexico in USD Million
Chart 49: Glance at 2014, 2018 and 2023 North American Titanium Dioxide Market Share (%) by Geographic Region – United States, Canada and Mexico
Chart 50: North American Other Inorganic Pigments Market Analysis (2014-2023) by Geographic Region – United States, Canada and Mexico in USD Million
Chart 51: Glance at 2014, 2018 and 2023 North American Other Inorganic Pigments Market Share (%) by Geographic Region – United States, Canada and Mexico
Chart 52: North American Inorganic Pigments Market Analysis (2014-2023) by Application – Paints & Coatings, Plastics, Printing Inks and Other Applications in USD Million
Chart 53: Glance at 2014, 2018 and 2023 North American Inorganic Pigments Market Share (%) by Application – Paints & Coatings, Plastics, Printing Inks and Other Applications
Chart 54: North American Inorganic Pigments Market Analysis (2014-2023) in Paints & Coatings by Geographic Region – United States, Canada and Mexico in USD Million
Chart 55: Glance at 2014, 2018 and 2023 North American Inorganic Pigments Market Share (%) in Paints & Coatings by Geographic Region – United States, Canada and Mexico
Chart 56: North American Inorganic Pigments Market Analysis (2014-2023) in Plastics by Geographic Region – United States, Canada and Mexico in USD Million
Chart 57: Glance at 2014, 2018 and 2023 North American Inorganic Pigments Market Share (%) in Plastics by Geographic Region – United States, Canada and Mexico
Chart 58: North American Inorganic Pigments Market Analysis (2014-2023) in Printing Inks by Geographic Region – United States, Canada and Mexico in USD Million
Chart 59: Glance at 2014, 2018 and 2023 North American Inorganic Pigments Market Share (%) in Printing Inks by Geographic Region – United States, Canada and Mexico
Chart 60: North American Inorganic Pigments Market Analysis (2014-2023) in Other Applications by Geographic Region – United States, Canada and Mexico in USD Million
Chart 61: Glance at 2014, 2018 and 2023 North American Inorganic Pigments Market Share (%) in Other Applications by Geographic Region – United States, Canada and Mexico
The United States
Chart 62: United States Inorganic Pigments Market Analysis (2014-2023) in USD Million
Chart 63: United States Inorganic Pigments Market Analysis (2014-2023) by Type – Cadmium, Carbon Black, Chromium Oxide, Iron Oxide, Titanium Dioxide and Other Inorganic Pigments in USD Million
Chart 64: Glance at 2014, 2018 and 2023 United States Inorganic Pigments Market Share (%) by Type – Cadmium, Carbon Black, Chromium Oxide, Iron Oxide, Titanium Dioxide and Other Inorganic Pigments
Chart 65: United States Inorganic Pigments Market Analysis (2014-2023) by Application – Paints & Coatings, Plastics, Printing Inks and Other Applications in USD Million
Chart 66: Glance at 2014, 2018 and 2023 United States Inorganic Pigments Market Share (%) by Application – Paints & Coatings, Plastics, Printing Inks and Other Applications
Canada
Chart 67: Canadian Inorganic Pigments Market Analysis (2014-2023) in USD Million
Chart 68: Canadian Inorganic Pigments Market Analysis (2014-2023) by Type – Cadmium, Carbon Black, Chromium Oxide, Iron Oxide, Titanium Dioxide and Other Inorganic Pigments in USD Million
Chart 69: Glance at 2014, 2018 and 2023 Canadian Inorganic Pigments Market Share (%) by Type – Cadmium, Carbon Black, Chromium Oxide, Iron Oxide, Titanium Dioxide and Other Inorganic Pigments
Chart 70: Canadian Inorganic Pigments Market Analysis (2014-2023) by Application – Paints & Coatings, Plastics, Printing Inks and Other Applications in USD Million
Chart 71: Glance at 2014, 2018 and 2023 Canadian Inorganic Pigments Market Share (%) by Application – Paints & Coatings, Plastics, Printing Inks and Other Applications
Mexico
Chart 72: Mexican Inorganic Pigments Market Analysis (2014-2023) in USD Million
Chart 73: Mexican Inorganic Pigments Market Analysis (2014-2023) by Type – Cadmium, Carbon Black, Chromium Oxide, Iron Oxide, Titanium Dioxide and Other Inorganic Pigments in USD Million
Chart 74: Glance at 2014, 2018 and 2023 Mexican Inorganic Pigments Market Share (%) by Type – Cadmium, Carbon Black, Chromium Oxide, Iron Oxide, Titanium Dioxide and Other Inorganic Pigments
Chart 75: Mexican Inorganic Pigments Market Analysis (2014-2023) by Application – Paints & Coatings, Plastics, Printing Inks and Other Applications in USD Million
Chart 76: Glance at 2014, 2018 and 2023 Mexican Inorganic Pigments Market Share (%) by Application – Paints & Coatings, Plastics, Printing Inks and Other Applications
EUROPE
Chart 77: European Inorganic Pigments Market Analysis (2014-2023) in USD Million
Chart 78: European Inorganic Pigments Market Analysis (2014-2023) by Geographic Region – France, Germany, Italy, Russia, Spain, United Kingdom and Rest of Europe in USD Million
Chart 79: Glance at 2014, 2018 and 2023 European Inorganic Pigments Market Share (%) by Geographic Region – France, Germany, Italy, Russia, Spain, United Kingdom and Rest of Europe
Chart 80: European Inorganic Pigments Market Analysis (2014-2023) by Type – Cadmium, Carbon Black, Chromium Oxide, Iron Oxide, Titanium Dioxide and Other Inorganic Pigments in USD Million
Chart 81: Glance at 2014, 2018 and 2023 European Inorganic Pigments Market Share (%) by Type – Cadmium, Carbon Black, Chromium Oxide, Iron Oxide, Titanium Dioxide and Other Inorganic Pigments
Chart 82: European Cadmium Pigments Market Analysis (2014-2023) by Geographic Region – France, Germany, Italy, Russia, Spain, United Kingdom and Rest of Europe in USD Million
Chart 83: Glance at 2014, 2018 and 2023 European Cadmium Pigments Market Share (%) by Geographic Region – France, Germany, Italy, Russia, Spain, United Kingdom and Rest of Europe
Chart 84: European Carbon Black Market Analysis (2014-2023) by Geographic Region – France, Germany, Italy, Russia, Spain, United Kingdom and Rest of Europe in USD Million
Chart 85: Glance at 2014, 2018 and 2023 European Carbon Black Market Share (%) by Geographic Region – France, Germany, Italy, Russia, Spain, United Kingdom and Rest of Europe
Chart 86: European Chromium Oxide Market Analysis (2014-2023) by Geographic Region – France, Germany, Italy, Russia, Spain, United Kingdom and Rest of Europe in USD Million
Chart 87: Glance at 2014, 2018 and 2023 European Chromium Oxide Market Share (%) by Geographic Region – France, Germany, Italy, Russia, Spain, United Kingdom and Rest of Europe
Chart 88: European Iron Oxide Market Analysis (2014-2023) by Geographic Region – France, Germany, Italy, Russia, Spain, United Kingdom and Rest of Europe in USD Million
Chart 89: Glance at 2014, 2018 and 2023 European Iron Oxide Market Share (%) by Geographic Region – France, Germany, Italy, Russia, Spain, United Kingdom and Rest of Europe
Chart 90: European Titanium Dioxide Market Analysis (2014-2023) by Geographic Region – France, Germany, Italy, Russia, Spain, United Kingdom and Rest of Europe in USD Million
Chart 91: Glance at 2014, 2018 and 2023 European Titanium Dioxide Market Share (%) by Geographic Region – France, Germany, Italy, Russia, Spain, United Kingdom and Rest of Europe
Chart 92: European Other Inorganic Pigments Market Analysis (2014-2023) by Geographic Region – France, Germany, Italy, Russia, Spain, United Kingdom and Rest of Europe in USD Million
Chart 93: Glance at 2014, 2018 and 2023 European Other Inorganic Pigments Market Share (%) by Geographic Region – France, Germany, Italy, Russia, Spain, United Kingdom and Rest of Europe
Chart 94: European Inorganic Pigments Market Analysis (2014-2023) by Application – Paints & Coatings, Plastics, Printing Inks and Other Applications in USD Million
Chart 95: Glance at 2014, 2018 and 2023 European Inorganic Pigments Market Share (%) by Application – Paints & Coatings, Plastics, Printing Inks and Other Applications
Chart 96: European Inorganic Pigments Market Analysis (2014-2023) in Paints & Coatings by Geographic Region – France, Germany, Italy, Russia, Spain, United Kingdom and Rest of Europe in USD Million
Chart 97: Glance at 2014, 2018 and 2023 European Inorganic Pigments Market Share (%) in Paints & Coatings by Geographic Region – France, Germany, Italy, Russia, Spain, United Kingdom and Rest of Europe
Chart 98: European Inorganic Pigments Market Analysis (2014-2023) in Plastics by Geographic Region – France, Germany, Italy, Russia, Spain, United Kingdom and Rest of Europe in USD Million
Chart 99: Glance at 2014, 2018 and 2023 European Inorganic Pigments Market Share (%) in Plastics by Geographic Region – France, Germany, Italy, Russia, Spain, United Kingdom and Rest of Europe
Chart 100: European Inorganic Pigments Market Analysis (2014-2023) in Printing Inks by Geographic Region – France, Germany, Italy, Russia, Spain, United Kingdom and Rest of Europe in USD Million
Chart 101: Glance at 2014, 2018 and 2023 European Inorganic Pigments Market Share (%) in Printing Inks by Geographic Region – France, Germany, Italy, Russia, Spain, United Kingdom and Rest of Europe
Chart 102: European Inorganic Pigments Market Analysis (2014-2023) in Other Applications by Geographic Region – France, Germany, Italy, Russia, Spain, United Kingdom and Rest of Europe in USD Million
Chart 103: Glance at 2014, 2018 and 2023 European Inorganic Pigments Market Share (%) in Other Applications by Geographic Region – France, Germany, Italy, Russia, Spain, United Kingdom and Rest of Europe
France
Chart 104: French Inorganic Pigments Market Analysis (2014-2023) in USD Million
Chart 105: French Inorganic Pigments Market Analysis (2014-2023) by Type – Cadmium, Carbon Black, Chromium Oxide, Iron Oxide, Titanium Dioxide and Other Inorganic Pigments in USD Million
Chart 106: Glance at 2014, 2018 and 2023 French Inorganic Pigments Market Share (%) by Type – Cadmium, Carbon Black, Chromium Oxide, Iron Oxide, Titanium Dioxide and Other Inorganic Pigments
Chart 107: French Inorganic Pigments Market Analysis (2014-2023) by Application – Paints & Coatings, Plastics, Printing Inks and Other Applications in USD Million
Chart 108: Glance at 2014, 2018 and 2023 French Inorganic Pigments Market Share (%) by Application – Paints & Coatings, Plastics, Printing Inks and Other Applications
Germany
Chart 109: German Inorganic Pigments Market Analysis (2014-2023) in USD Million
Chart 110: German Inorganic Pigments Market Analysis (2014-2023) by Type – Cadmium, Carbon Black, Chromium Oxide, Iron Oxide, Titanium Dioxide and Other Inorganic Pigments in USD Million
Chart 111: Glance at 2014, 2018 and 2023 German Inorganic Pigments Market Share (%) by Type – Cadmium, Carbon Black, Chromium Oxide, Iron Oxide, Titanium Dioxide and Other Inorganic Pigments
Chart 112: German Inorganic Pigments Market Analysis (2014-2023) by Application – Paints & Coatings, Plastics, Printing Inks and Other Applications in USD Million
Chart 113: Glance at 2014, 2018 and 2023 German Inorganic Pigments Market Share (%) by Application – Paints & Coatings, Plastics, Printing Inks and Other Applications
Italy
Chart 114: Italian Inorganic Pigments Market Analysis (2014-2023) in USD Million
Chart 115: Italian Inorganic Pigments Market Analysis (2014-2023) by Type – Cadmium, Carbon Black, Chromium Oxide, Iron Oxide, Titanium Dioxide and Other Inorganic Pigments in USD Million
Chart 116: Glance at 2014, 2018 and 2023 Italian Inorganic Pigments Market Share (%) by Type – Cadmium, Carbon Black, Chromium Oxide, Iron Oxide, Titanium Dioxide and Other Inorganic Pigments
Chart 117: Italian Inorganic Pigments Market Analysis (2014-2023) by Application – Paints & Coatings, Plastics, Printing Inks and Other Applications in USD Million
Chart 118: Glance at 2014, 2018 and 2023 Italian Inorganic Pigments Market Share (%) by Application – Paints & Coatings, Plastics, Printing Inks and Other Applications
Russia
Chart 119: Russian Inorganic Pigments Market Analysis (2014-2023) in USD Million
Chart 120: Russian Inorganic Pigments Market Analysis (2014-2023) by Type – Cadmium, Carbon Black, Chromium Oxide, Iron Oxide, Titanium Dioxide and Other Inorganic Pigments in USD Million
Chart 121: Glance at 2014, 2018 and 2023 Russian Inorganic Pigments Market Share (%) by Type – Cadmium, Carbon Black, Chromium Oxide, Iron Oxide, Titanium Dioxide and Other Inorganic Pigments
Chart 122: Russian Inorganic Pigments Market Analysis (2014-2023) by Application – Paints & Coatings, Plastics, Printing Inks and Other Applications in USD Million
Chart 123: Glance at 2014, 2018 and 2023 Russian Inorganic Pigments Market Share (%) by Application – Paints & Coatings, Plastics, Printing Inks and Other Applications
Spain
Chart 124: Spanish Inorganic Pigments Market Analysis (2014-2023) in USD Million
Chart 125: Spanish Inorganic Pigments Market Analysis (2014-2023) by Type – Cadmium, Carbon Black, Chromium Oxide, Iron Oxide, Titanium Dioxide and Other Inorganic Pigments in USD Million
Chart 126: Glance at 2014, 2018 and 2023 Spanish Inorganic Pigments Market Share (%) by Type – Cadmium, Carbon Black, Chromium Oxide, Iron Oxide, Titanium Dioxide and Other Inorganic Pigments
Chart 127: Spanish Inorganic Pigments Market Analysis (2014-2023) by Application – Paints & Coatings, Plastics, Printing Inks and Other Applications in USD Million
Chart 128: Glance at 2014, 2018 and 2023 Spanish Inorganic Pigments Market Share (%) by Application – Paints & Coatings, Plastics, Printing Inks and Other Applications
The United Kingdom
Chart 129: United Kingdom Inorganic Pigments Market Analysis (2014-2023) in USD Million
Chart 130: United Kingdom Inorganic Pigments Market Analysis (2014-2023) by Type – Cadmium, Carbon Black, Chromium Oxide, Iron Oxide, Titanium Dioxide and Other Inorganic Pigments in USD Million
Chart 131: Glance at 2014, 2018 and 2023 United Kingdom Inorganic Pigments Market Share (%) by Type – Cadmium, Carbon Black, Chromium Oxide, Iron Oxide, Titanium Dioxide and Other Inorganic Pigments
Chart 132: United Kingdom Inorganic Pigments Market Analysis (2014-2023) by Application – Paints & Coatings, Plastics, Printing Inks and Other Applications in USD Million
Chart 133: Glance at 2014, 2018 and 2023 United Kingdom Inorganic Pigments Market Share (%) by Application – Paints & Coatings, Plastics, Printing Inks and Other Applications
Rest of Europe
Chart 134: Rest of Europe Inorganic Pigments Market Analysis (2014-2023) in USD Million
Chart 135: Rest of Europe Inorganic Pigments Market Analysis (2014-2023) by Type – Cadmium, Carbon Black, Chromium Oxide, Iron Oxide, Titanium Dioxide and Other Inorganic Pigments in USD Million
Chart 136: Glance at 2014, 2018 and 2023 Rest of Europe Inorganic Pigments Market Share (%) by Type – Cadmium, Carbon Black, Chromium Oxide, Iron Oxide, Titanium Dioxide and Other Inorganic Pigments
Chart 137: Rest of Europe Inorganic Pigments Market Analysis (2014-2023) by Application – Paints & Coatings, Plastics, Printing Inks and Other Applications in USD Million
Chart 138: Glance at 2014, 2018 and 2023 Rest of Europe Inorganic Pigments Market Share (%) by Application – Paints & Coatings, Plastics, Printing Inks and Other Applications
ASIA-PACIFIC
Chart 139: Asia-Pacific Inorganic Pigments Market Analysis (2014-2023) in USD Million
Chart 140: Asia-Pacific Inorganic Pigments Market Analysis (2014-2023) by Geographic Region – China, India, Japan, South Korea and Rest of Asia-Pacific in USD Million
Chart 141: Glance at 2014, 2018 and 2023 Asia-Pacific Inorganic Pigments Market Share (%) by Geographic Region – China, India, Japan, South Korea and Rest of Asia-Pacific
Chart 142: Asia-Pacific Inorganic Pigments Market Analysis (2014-2023) by Type – Cadmium, Carbon Black, Chromium Oxide, Iron Oxide, Titanium Dioxide and Other Inorganic Pigments in USD Million
Chart 143: Glance at 2014, 2018 and 2023 Asia-Pacific Inorganic Pigments Market Share (%) by Type – Cadmium, Carbon Black, Chromium Oxide, Iron Oxide, Titanium Dioxide and Other Inorganic Pigments
Chart 144: Asia-Pacific Cadmium Pigments Market Analysis (2014-2023) by Geographic Region – China, India, Japan, South Korea and Rest of Asia-Pacific in USD Million
Chart 145: Glance at 2014, 2018 and 2023 Asia-Pacific Cadmium Pigments Market Share (%) by Geographic Region – China, India, Japan, South Korea and Rest of Asia-Pacific
Chart 146: Asia-Pacific Carbon Black Market Analysis (2014-2023) by Geographic Region – China, India, Japan, South Korea and Rest of Asia-Pacific in USD Million
Chart 147: Glance at 2014, 2018 and 2023 Asia-Pacific Carbon Black Market Share (%) by Geographic Region – China, India, Japan, South Korea and Rest of Asia-Pacific
Chart 148: Asia-Pacific Chromium Oxide Market Analysis (2014-2023) by Geographic Region – China, India, Japan, South Korea and Rest of Asia-Pacific in USD Million
Chart 149: Glance at 2014, 2018 and 2023 Asia-Pacific Chromium Oxide Market Share (%) by Geographic Region – China, India, Japan, South Korea and Rest of Asia-Pacific
Chart 150: Asia-Pacific Iron Oxide Market Analysis (2014-2023) by Geographic Region – China, India, Japan, South Korea and Rest of Asia-Pacific in USD Million
Chart 151: Glance at 2014, 2018 and 2023 Asia-Pacific Iron Oxide Market Share (%) by Geographic Region – China, India, Japan, South Korea and Rest of Asia-Pacific
Chart 152: Asia-Pacific Titanium Dioxide Market Analysis (2014-2023) by Geographic Region – China, India, Japan, South Korea and Rest of Asia-Pacific in USD Million
Chart 153: Glance at 2014, 2018 and 2023 Asia-Pacific Titanium Dioxide Market Share (%) by Geographic Region – China, India, Japan, South Korea and Rest of Asia-Pacific
Chart 154: Asia-Pacific Other Inorganic Pigments Market Analysis (2014-2023) by Geographic Region – China, India, Japan, South Korea and Rest of Asia-Pacific in USD Million
Chart 155: Glance at 2014, 2018 and 2023 Asia-Pacific Other Inorganic Pigments Market Share (%) by Geographic Region – China, India, Japan, South Korea and Rest of Asia-Pacific
Chart 156: Asia-Pacific Inorganic Pigments Market Analysis (2014-2023) by Application – Paints & Coatings, Plastics, Printing Inks and Other Applications in USD Million
Chart 157: Glance at 2014, 2018 and 2023 Asia-Pacific Inorganic Pigments Market Share (%) by Application – Paints & Coatings, Plastics, Printing Inks and Other Applications
Chart 158: Asia-Pacific Inorganic Pigments Market Analysis (2014-2023) in Paints & Coatings by Geographic Region – China, India, Japan, South Korea and Rest of Asia-Pacific in USD Million
Chart 159: Glance at 2014, 2018 and 2023 Asia-Pacific Inorganic Pigments Market Share (%) in Paints & Coatings by Geographic Region – China, India, Japan, South Korea and Rest of Asia-Pacific
Chart 160: Asia-Pacific Inorganic Pigments Market Analysis (2014-2023) in Plastics by Geographic Region – China, India, Japan, South Korea and Rest of Asia-Pacific in USD Million
Chart 161: Glance at 2014, 2018 and 2023 Asia-Pacific Inorganic Pigments Market Share (%) in Plastics by Geographic Region – China, India, Japan, South Korea and Rest of Asia-Pacific
Chart 162: Asia-Pacific Inorganic Pigments Market Analysis (2014-2023) in Printing Inks by Geographic Region – China, India, Japan, South Korea and Rest of Asia-Pacific in USD Million
Chart 163: Glance at 2014, 2018 and 2023 Asia-Pacific Inorganic Pigments Market Share (%) in Printing Inks by Geographic Region – China, India, Japan, South Korea and Rest of Asia-Pacific
Chart 164: Asia-Pacific Inorganic Pigments Market Analysis (2014-2023) in Other Applications by Geographic Region – China, India, Japan, South Korea and Rest of Asia-Pacific in USD Million
Chart 165: Glance at 2014, 2018 and 2023 Asia-Pacific Inorganic Pigments Market Share (%) in Other Applications by Geographic Region – China, India, Japan, South Korea and Rest of Asia-Pacific
China
Chart 166: Chinese Inorganic Pigments Market Analysis (2014-2023) in USD Million
Chart 167: Chinese Inorganic Pigments Market Analysis (2014-2023) by Type – Cadmium, Carbon Black, Chromium Oxide, Iron Oxide, Titanium Dioxide and Other Inorganic Pigments in USD Million
Chart 168: Glance at 2014, 2018 and 2023 Chinese Inorganic Pigments Market Share (%) by Type – Cadmium, Carbon Black, Chromium Oxide, Iron Oxide, Titanium Dioxide and Other Inorganic Pigments
Chart 169: Chinese Inorganic Pigments Market Analysis (2014-2023) by Application – Paints & Coatings, Plastics, Printing Inks and Other Applications in USD Million
Chart 170: Glance at 2014, 2018 and 2023 Chinese Inorganic Pigments Market Share (%) by Application – Paints & Coatings, Plastics, Printing Inks and Other Applications
India
Chart 171: Indian Inorganic Pigments Market Analysis (2014-2023) in USD Million
Chart 172: Indian Inorganic Pigments Market Analysis (2014-2023) by Type – Cadmium, Carbon Black, Chromium Oxide, Iron Oxide, Titanium Dioxide and Other Inorganic Pigments in USD Million
Chart 173: Glance at 2014, 2018 and 2023 Indian Inorganic Pigments Market Share (%) by Type – Cadmium, Carbon Black, Chromium Oxide, Iron Oxide, Titanium Dioxide and Other Inorganic Pigments
Chart 174: Indian Inorganic Pigments Market Analysis (2014-2023) by Application – Paints & Coatings, Plastics, Printing Inks and Other Applications in USD Million
Chart 175: Glance at 2014, 2018 and 2023 Indian Inorganic Pigments Market Share (%) by Application – Paints & Coatings, Plastics, Printing Inks and Other Applications
Japan
Chart 176: Japanese Inorganic Pigments Market Analysis (2014-2023) in USD Million
Chart 177: Japanese Inorganic Pigments Market Analysis (2014-2023) by Type – Cadmium, Carbon Black, Chromium Oxide, Iron Oxide, Titanium Dioxide and Other Inorganic Pigments in USD Million
Chart 178: Glance at 2014, 2018 and 2023 Japanese Inorganic Pigments Market Share (%) by Type – Cadmium, Carbon Black, Chromium Oxide, Iron Oxide, Titanium Dioxide and Other Inorganic Pigments
Chart 179: Japanese Inorganic Pigments Market Analysis (2014-2023) by Application – Paints & Coatings, Plastics, Printing Inks and Other Applications in USD Million
Chart 180: Glance at 2014, 2018 and 2023 Japanese Inorganic Pigments Market Share (%) by Application – Paints & Coatings, Plastics, Printing Inks and Other Applications
South Korea
Chart 181: South Korean Inorganic Pigments Market Analysis (2014-2023) in USD Million
Chart 182: South Korean Inorganic Pigments Market Analysis (2014-2023) by Type – Cadmium, Carbon Black, Chromium Oxide, Iron Oxide, Titanium Dioxide and Other Inorganic Pigments in USD Million
Chart 183: Glance at 2014, 2018 and 2023 South Korean Inorganic Pigments Market Share (%) by Type – Cadmium, Carbon Black, Chromium Oxide, Iron Oxide, Titanium Dioxide and Other Inorganic Pigments
Chart 184: South Korean Inorganic Pigments Market Analysis (2014-2023) by Application – Paints & Coatings, Plastics, Printing Inks and Other Applications in USD Million
Chart 185: Glance at 2014, 2018 and 2023 South Korean Inorganic Pigments Market Share (%) by Application – Paints & Coatings, Plastics, Printing Inks and Other Applications
Rest of Asia-Pacific
Chart 186: Rest of Asia-Pacific Inorganic Pigments Market Analysis (2014-2023) in USD Million
Chart 187: Rest of Asia-Pacific Inorganic Pigments Market Analysis (2014-2023) by Type – Cadmium, Carbon Black, Chromium Oxide, Iron Oxide, Titanium Dioxide and Other Inorganic Pigments in USD Million
Chart 188: Glance at 2014, 2018 and 2023 Rest of Asia-Pacific Inorganic Pigments Market Share (%) by Type – Cadmium, Carbon Black, Chromium Oxide, Iron Oxide, Titanium Dioxide and Other Inorganic Pigments
Chart 189: Rest of Asia-Pacific Inorganic Pigments Market Analysis (2014-2023) by Application – Paints & Coatings, Plastics, Printing Inks and Other Applications in USD Million
Chart 190: Glance at 2014, 2018 and 2023 Rest of Asia-Pacific Inorganic Pigments Market Share (%) by Application – Paints & Coatings, Plastics, Printing Inks and Other Applications
SOUTH AMERICA
Chart 191: South American Inorganic Pigments Market Analysis (2014-2023) in USD Million
Chart 192: South American Inorganic Pigments Market Analysis (2014-2023) by Geographic Region – Argentina, Brazil and Rest of South America in USD Million
Chart 193: Glance at 2014, 2018 and 2023 South American Inorganic Pigments Market Share (%) by Geographic Region – Argentina, Brazil and Rest of South America
Chart 194: South American Inorganic Pigments Market Analysis (2014-2023) by Type – Cadmium, Carbon Black, Chromium Oxide, Iron Oxide, Titanium Dioxide and Other Inorganic Pigments in USD Million
Chart 195: Glance at 2014, 2018 and 2023 South American Inorganic Pigments Market Share (%) by Type – Cadmium, Carbon Black, Chromium Oxide, Iron Oxide, Titanium Dioxide and Other Inorganic Pigments
Chart 196: South American Cadmium Pigments Market Analysis (2014-2023) by Geographic Region – Argentina, Brazil and Rest of South America in USD Million
Chart 197: Glance at 2014, 2018 and 2023 South American Cadmium Pigments Market Share (%) by Geographic Region – Argentina, Brazil and Rest of South America
Chart 198: South American Carbon Black Market Analysis (2014-2023) by Geographic Region – Argentina, Brazil and Rest of South America in USD Million
Chart 199: Glance at 2014, 2018 and 2023 South American Carbon Black Market Share (%) by Geographic Region – Argentina, Brazil and Rest of South America
Chart 200: South American Chromium Oxide Market Analysis (2014-2023) by Geographic Region – Argentina, Brazil and Rest of South America in USD Million
Chart 201: Glance at 2014, 2018 and 2023 South American Chromium Oxide Market Share (%) by Geographic Region – Argentina, Brazil and Rest of South America
Chart 202: South American Iron Oxide Market Analysis (2014-2023) by Geographic Region – Argentina, Brazil and Rest of South America in USD Million
Chart 203: Glance at 2014, 2018 and 2023 South American Iron Oxide Market Share (%) by Geographic Region – Argentina, Brazil and Rest of South America
Chart 204: South American Titanium Dioxide Market Analysis (2014-2023) by Geographic Region – Argentina, Brazil and Rest of South America in USD Million
Chart 205: Glance at 2014, 2018 and 2023 South American Titanium Dioxide Market Share (%) by Geographic Region – Argentina, Brazil and Rest of South America
Chart 206: South American Other Inorganic Pigments Market Analysis (2014-2023) by Geographic Region – Argentina, Brazil and Rest of South America in USD Million
Chart 207: Glance at 2014, 2018 and 2023 South American Other Inorganic Pigments Market Share (%) by Geographic Region – Argentina, Brazil and Rest of South America
Chart 208: South American Inorganic Pigments Market Analysis (2014-2023) by Application – Paints & Coatings, Plastics, Printing Inks and Other Applications in USD Million
Chart 209: Glance at 2014, 2018 and 2023 South American Inorganic Pigments Market Share (%) by Application – Paints & Coatings, Plastics, Printing Inks and Other Applications
Chart 210: South American Inorganic Pigments Market Analysis (2014-2023) in Paints & Coatings by Geographic Region – Argentina, Brazil and Rest of South America in USD Million
Chart 211: Glance at 2014, 2018 and 2023 South American Inorganic Pigments Market Share (%) in Paints & Coatings by Geographic Region – Argentina, Brazil and Rest of South America
Chart 212: South American Inorganic Pigments Market Analysis (2014-2023) in Plastics by Geographic Region – Argentina, Brazil and Rest of South America in USD Million
Chart 213: Glance at 2014, 2018 and 2023 South American Inorganic Pigments Market Share (%) in Plastics by Geographic Region – Argentina, Brazil and Rest of South America
Chart 214: South American Inorganic Pigments Market Analysis (2014-2023) in Printing Inks by Geographic Region – Argentina, Brazil and Rest of South America in USD Million
Chart 215: Glance at 2014, 2018 and 2023 South American Inorganic Pigments Market Share (%) in Printing Inks by Geographic Region – Argentina, Brazil and Rest of South America
Chart 216: South American Inorganic Pigments Market Analysis (2014-2023) in Other Applications by Geographic Region – Argentina, Brazil and Rest of South America in USD Million
Chart 217: Glance at 2014, 2018 and 2023 South American Inorganic Pigments Market Share (%) in Other Applications by Geographic Region – Argentina, Brazil and Rest of South America
Argentina
Chart 218: Argentine Inorganic Pigments Market Analysis (2014-2023) in USD Million
Chart 219: Argentine Inorganic Pigments Market Analysis (2014-2023) by Type – Cadmium, Carbon Black, Chromium Oxide, Iron Oxide, Titanium Dioxide and Other Inorganic Pigments in USD Million
Chart 220: Glance at 2014, 2018 and 2023 Argentine Inorganic Pigments Market Share (%) by Type – Cadmium, Carbon Black, Chromium Oxide, Iron Oxide, Titanium Dioxide and Other Inorganic Pigments
Chart 221: Argentine Inorganic Pigments Market Analysis (2014-2023) by Application – Paints & Coatings, Plastics, Printing Inks and Other Applications in USD Million
Chart 222: Glance at 2014, 2018 and 2023 Argentine Inorganic Pigments Market Share (%) by Application – Paints & Coatings, Plastics, Printing Inks and Other Applications
Brazil
Chart 223: Brazilian Inorganic Pigments Market Analysis (2014-2023) in USD Million
Chart 224: Brazilian Inorganic Pigments Market Analysis (2014-2023) by Type – Cadmium, Carbon Black, Chromium Oxide, Iron Oxide, Titanium Dioxide and Other Inorganic Pigments in USD Million
Chart 225: Glance at 2014, 2018 and 2023 Brazilian Inorganic Pigments Market Share (%) by Type – Cadmium, Carbon Black, Chromium Oxide, Iron Oxide, Titanium Dioxide and Other Inorganic Pigments
Chart 226: Brazilian Inorganic Pigments Market Analysis (2014-2023) by Application – Paints & Coatings, Plastics, Printing Inks and Other Applications in USD Million
Chart 227: Glance at 2014, 2018 and 2023 Brazilian Inorganic Pigments Market Share (%) by Application – Paints & Coatings, Plastics, Printing Inks and Other Applications
Rest of South America
Chart 228: Rest of South American Inorganic Pigments Market Analysis (2014-2023) in USD Million
Chart 229: Rest of South American Inorganic Pigments Market Analysis (2014-2023) by Type – Cadmium, Carbon Black, Chromium Oxide, Iron Oxide, Titanium Dioxide and Other Inorganic Pigments in USD Million
Chart 230: Glance at 2014, 2018 and 2023 Rest of South American Inorganic Pigments Market Share (%) by Type – Cadmium, Carbon Black, Chromium Oxide, Iron Oxide, Titanium Dioxide and Other Inorganic Pigments
Chart 231: Rest of South American Inorganic Pigments Market Analysis (2014-2023) by Application – Paints & Coatings, Plastics, Printing Inks and Other Applications in USD Million
Chart 232: Glance at 2014, 2018 and 2023 Rest of South American Inorganic Pigments Market Share (%) by Application – Paints & Coatings, Plastics, Printing Inks and Other Applications
REST OF WORLD
Chart 233: Rest of World Inorganic Pigments Market Analysis (2014-2023) in USD Million
Chart 234: Rest of World Inorganic Pigments Market Analysis (2014-2023) by Type – Cadmium, Carbon Black, Chromium Oxide, Iron Oxide, Titanium Dioxide and Other Inorganic Pigments in USD Million
Chart 235: Glance at 2014, 2018 and 2023 Rest of World Inorganic Pigments Market Share (%) by Type – Cadmium, Carbon Black, Chromium Oxide, Iron Oxide, Titanium Dioxide and Other Inorganic Pigments
Chart 236: Rest of World Inorganic Pigments Market Analysis (2014-2023) by Application – Paints & Coatings, Plastics, Printing Inks and Other Applications in USD Million
Chart 237: Glance at 2014, 2018 and 2023 Rest of World Inorganic Pigments Market Share (%) by Application – Paints & Coatings, Plastics, Printing Inks and Other Applications
Tables:
Table 1: Pigments and their Abbreviations as per the Colour Index System
Table 2: Classification of Inorganic Pigments Based on Optical Effect
Table 3: Chemical Names and Chemical Identification of Carbon Black
Table 4: Properties and Characteristic of Carbon Black as Obtained from the Furnace Process
Table 5: Properties of Specific Titanium Minerals
Table 6: Comparison Between Sulfate, Chloride and AT Processes
Table 7: Refractive Index, Refractive Tinting Strength and Specific Gravity of Common White Pigments
Table 8: Refractive Indices of Pigments and Vehicles Used in Manufacturing Paints and Coatings
Table 9: Some of the Details of Various Paints & Coatings and Type of Titanium Dioxide Used
Table 10: Some of Commonly Used Oil Furnace Carbon Black Grades Used in Paints & Coatings
Table 11: Description of Performance as a Function of Particle Size and Structure
Table 12: Inorganic Pigments in Cosmetic Applications
Figures:
Figure 1: Schematic of Furnace Black Process
Figure 2: Schematic diagram of the Sulfate Process of Manufacturing Titanium Dioxide
Figure 3: Schematic of the Chloride Process of Manufacturing Titanium Dioxide
Figure 4: Schematic of the Argex Technology (AT) Process of Manufacturing Titanium Dioxide
BASF SE
Carl Schlenk AG
Cathay Industries
Cristal Group - National Titanium Dioxide Company
Dainichiseika Color & Chemicals Mfg. Co., Ltd.
Ferro Corporation
Heubach GmbH
Lanxess Deutschland GmbH
Merck KGaA
Orion Engineered Carbons GmbH
The Chemours Company
Toda Kogyo Corp.
Tronox Limited
Venator Materials Plc
RELATED REPORTS
Global Pigments & Dyes Market - Types, Formulations and Applications
Report Code: CHM216 | Pages: 342 | Price: $4500
Published
Jan 2026

Aramid Fibers (Para and Meta) – A Global Market Overview
Report Code: CHM026 | Pages: 488 | Price: $4500
Published
Jan 2026
Ultra-High Molecular Weight Polyethylene (UHMWPE) Fiber - A Global Market Overview
Report Code: CHM408 | Pages: 187 | Price: $3960
Published
Jan 2026
Polyphenylene Sulfide (PPS) Fiber - A Global Market Overview
Report Code: CHM409 | Pages: 149 | Price: $3960
Published
Jan 2026
Global High-Performance Fibers Market - Products and Applications
Report Code: CHM410 | Pages: 525 | Price: $4950
Published
Jan 2026