Published Date: Sep 2018
Report Code: CP071
Pages: 274
Charts: 223
Report Synopsis
Furfuryl alcohol is the most important application of Furfural. At present, approximately 88 percent of all furfural produced is converted to furfuryl alcohol attributed to demand for this product in the production of foundry resins. Furfural as a solvent is the second largest application for furfural globally. Furfural is used as a solvent in the refining of lubricating oils; extraction of mineral oils; and as a solvent or wetting agent in the manufacture of abrasive wheels, brake linings and refractory products. Furfural is also used in a range of applications which include pharmaceutical intermediates, as a nemacide in agriculture or horticulture, as a flavor/fragrance ingredient in food & beverages, and as a chemical intermediate in the production of furfural derivatives such as furan and tetrahydrofuran.
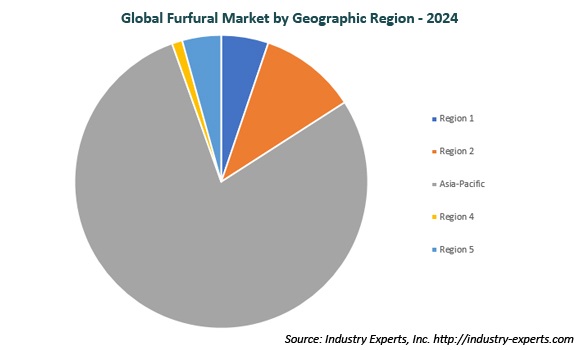
Asia-Pacific is the largest furfural consuming region in the world with an estimated 2018 share of 77%. The region is projected to witness the fastest CAGR during the analysis period 2018-2024 with 4.8% and 6.2% for volume and value respectively.
Research Findings & Coverage
- The report analyzes both Furfural and Furfuryl Alcohol with respect to all geographic regions
- Global Furfural market is analyzed in this report with respect to major application sectors
- The study exclusively analyzes the market of each major application sector of Furfural by a major geographic region
- Scarcity of Furfural Feedstock Makes Prices Upwards
- Modern Biorefineries Offer Huge Potential for Integrated Production of Furfural and its Derivatives
- Furfuryl alcohol dominates the consumption of Furfural globally accounting for over three-fourth of total market in 2018 and expected to continue the dominance in the future
- Key business trends focusing on product innovations/developments, M&As, JVs and other recent industry developments
- Major companies profiled – 24
- The industry guide includes the contact details for 96 companies
Product Outline
Major applications of Furfural analyzed comprise the following:
- Furfuryl Alcohol
- Solvent Applications
- Pharmaceuticals
- Other Applications (includes flavor agent, chemical intermediate, and agriculture)
Analysis Period, Units and Growth Rates
- The report reviews, analyzes and projects the global Furfural and Furfuryl Alcohol market for the period 2015-2024 in terms of volumes in Metric Tons and market value in US$ and the compound annual growth rates (CAGRs) projected from 2018 through 2024
Geographic Coverage
Furfural market is analyzed for the following geographical regions/countries:
- North America (The United States and Canada)
- Europe (Belgium, France, Germany, Italy, Russia, Spain, the United Kingdom and Rest of Europe)
- Asia-Pacific (China, India, Japan, South Korea, Thailand and Rest of Asia-Pacific)
- South America (Argentina, Brazil and Rest of South America)
- Rest of World (Iran, Saudi Arabia, South Africa and others)
Furfuryl Alcohol market is analyzed for the following geographical regions/countries:
- North America (The United States and Canada)
- Europe (Germany, Italy, Russia, Spain, the United Kingdom and Rest of Europe)
- Asia-Pacific (China, India, Japan, South Korea, Thailand and Rest of Asia-Pacific)
- South America (Argentina, Brazil, Chile and Rest of South America)
- Rest of World (Turkey and others)
PART A: GLOBAL MARKET PERSPECTIVE
1. INTRODUCTION
1.1 Market Trends and Outlook
1.1.1 Scarcity of Furfural Feedstock Makes Prices Upwards
1.1.2 Modern Biorefineries Offer Huge Potential for Integrated Production of Furfural and its Derivatives
1.2 Product Outline
1.2.1 Furfural
1.2.2 Structure of Furfural
1.2.3 Production Process
1.2.3.1 By-products Obtained during Furfural Production Process
1.2.3.1.1 Carboxylic Acids
1.2.3.1.2 Diacetyl, and 2,3-Pentandione
1.2.4 Furfural Derivates
1.2.4.1 Furfuryl Alcohol
1.2.4.2 Furan
1.2.4.3 Tetrahydrofuran
1.2.4.4 Furoic Acid
1.2.4.5 Furan Resins
1.2.4.6 Tetrahydrofurfuryl Alcohol
1.2.4.7 Methylfuran
1.2.5 Furfural Applications
1.2.5.1 Furfuryl Alcohol
1.2.5.2 Solvent/Wetting Agent
1.2.5.3 Pharmaceuticals
1.2.5.4 Other Applications
1.2.6 Applications of Furfural Derivatives
1.2.6.1 Pharmaceutical, Agricultural and Industrial Chemicals
1.2.6.2 Resins
1.2.6.3 Polymer and Plastic Industries
1.2.6.4 Wood Modification and Book Preservation
1.2.6.5 Furfuryl Alcohol in Aerospace Applications
2. INDUSTRY LANDSCAPE
2.1 Key Global Players
Aurus Speciality Company Limited (Thailand)
Central Romana Corporation, Ltd. (Dominican Republic)
Transfurans Chemicals bvba (Belgium)
Henan Huilong Chemical Co., Ltd. (China)
Hongye Holding Group Corporation Limited (China)
Illovo Sugar Africa (Pty) Ltd (South Africa)
Penn A Kem LLC (United States)
Shanxi Province Gaoping Chemical Co., Ltd. (China)
Silvateam S.p.a. (Italy)
Indunor S.A. (Argentina)
Hebei Xingtai Chunlei Furfuryl Alcohol Co., Ltd. (China)
2.2 Key Business Trends
Sappi Group to Build Furfural Demo Plant in South Africa
Numaligarh Refinery Limited Collaborated with Chempolis and Fortum to Build Biorefinery in India
Eastman Chemical Company and Origin Materials in FDCA Technology Pact
Bio-Corn Products to Set UP Furfural Production Plant in Kenya
University of Wisconsin Researchers Develop New Technology that Triples High-value Chemicals Extraction from Biomass
Biochemicals including Furfural from Lenzing Group Gets Biocertification from USDA
Oji Holdings to Commercialize Continuous Production Process for Furfural from Wood Pulp
3. GLOBAL MARKET OVERVIEW
3.1 Global Furfural Market Overview by Application
3.1.1 Furfural Application Market Overview by Global Region
3.1.1.1 Furfuryl Alcohol
3.1.1.2 Solvent
3.1.1.3 Pharmaceuticals
3.1.1.4 Other Applications
PART B: REGIONAL MARKET PERSPECTIVE
Global Furfural Market Overview by Geographic Region
Global Furfuryl Alcohol Market Overview by Geographic Region
REGIONAL MARKET OVERVIEW
4. NORTH AMERICA
4.1 North American Furfural Market Overview by Application
4.2 North American Furfural Market Overview by Geographic Region
4.3 North American Furfuryl Alcohol Market Overview by Geographic Region
4.4 Major Market Players
Harborchem (United States)
Penn A Kem LLC (United States)
4.5 Country-wise Analysis of North American Furfural Market
4.5.1 The United States
4.5.1.1 United States Furfural Market Overview by Application
4.5.2 Canada
4.5.2.1 Canadian Furfural Market Overview by Application
4.5.3 Mexico
4.5.3.1 Mexican Furfural Market Overview by Application
5. EUROPE
5.1 European Furfural Market Overview by Application
5.2 European Furfural Market Overview by Geographic Region
5.3 European Furfuryl Alcohol Market Overview by Geographic Region
5.4 Major Market Players
International Furan Chemicals B.V. (The Netherlands)
Lenzing AG (Austria)
NC-Nature Chemicals Dr. Kruppa GmbH (Germany)
Silvateam S.p.a. (Italy)
Tanin Sevnica d.d. (Slovenia)
Transfurans Chemicals bvba (Belgium)
5.5 Country-wise Analysis of European Furfural Market
5.5.1 Belgium
5.5.1.1 Belgian Furfural Market Overview by Application
5.5.2 France
5.5.2.1 French Furfural Market Overview by Application
5.5.3 Germany
5.5.3.1 German Furfural Market Overview by Application
5.5.4 Italy
5.5.4.1 Italian Furfural Market Overview by Application
5.5.5 Russia
5.5.5.1 Russian Furfural Market Overview by Application
5.5.6 Spain
5.5.6.1 Spanish Furfural Market Overview by Application
5.5.7 The United Kingdom
5.5.7.1 United Kingdom Furfural Market Overview by Application
5.5.8 Rest of Europe
5.5.8.1 Rest of Europe Furfural Market Overview by Application
6. ASIA-PACIFIC
6.1 Asia-Pacific Furfural Market Overview by Application
6.2 Asia-Pacific Furfural Market Overview by Geographic Region
6.3 Asia-Pacific Furfuryl Alcohol Market Overview by Geographic Region
6.4 Major Market Players
Aurus Speciality Company Limited (Thailand)
Hebei Furan International Co., Ltd. (China)
Hebei Xingtai Chunlei Furfuryl Alcohol Co., Ltd. (China)
Henan Huilong Chemical Co., Ltd. (China)
Hongye Holding Group Corporation Limited (China)
Shandong Crownchem Industries Co., Ltd. (China)
Zibo Minda Chemical Co., Ltd. (China)
Zibo Xinye Chemical Co., Ltd. (China)
Shandong Yino Biologic Materials Co., Ltd. (China)
Shanxi Province Gaoping Chemical Co., Ltd. (China)
Tieling North Furfural (Group) Co., Ltd.
Zhucheng Taisheng Chemical Co., Ltd. (China)
Zibo Huaao Chemical Co., Ltd. (China)
6.5 Country-wise Analysis of Asia-Pacific Furfural Market
6.5.1 China
6.5.1.1 Chinese Furfural Market Overview by Application
6.5.2 India
6.5.2.1 Indian Furfural Market Overview by Application
6.5.3 Japan
6.5.3.1 Japanese Furfural Market Overview by Application
6.5.4 South Korea
6.5.4.1 South Korean Furfural Market Overview by Application
6.5.5 Thailand
6.5.5.1 Thailand Furfural Market Overview by Application
6.5.6 Rest of Asia-Pacific
6.5.6.1 Rest of Asia-Pacific Furfural Market Overview by Application
7. SOUTH AMERICA
7.1 South American Furfural Market Overview by Application
7.2 South American Furfural Market Overview by Geographic Region
7.3 South American Furfuryl Alcohol Market Overview by Geographic Region
7.4 Major Market Players
Central Romana Corporation, Ltd. (Dominican Republic)
Indunor S.A. (Argentina)
7.5 Country-wise analysis of South American Furfural Market
7.5.1 Argentina
7.5.1.1 Argentinean Furfural Market Overview by Application
7.5.2 Brazil
7.5.2.1 Brazilian Furfural Market Overview by Application
7.5.3 Rest of South America
7.5.3.1 Rest of South America Furfural Market Overview by Application
8. REST OF WORLD
8.1 Rest of World Furfural Market Overview by Application
8.2 Rest of World Furfural Market Overview by Geographic Region
8.3 Rest of World Furfuryl Alcohol Market Overview by Geographic Region
8.4 Major Market Players
Behran Oil Company (Iran)
Bio-Corn Products EPZ Ltd. (Kenya)
Illovo Sugar Africa (Pty) Ltd (South Africa)
8.5 Country-wise Analysis of Rest of World Furfural Market
8.5.1 Iran
8.5.1.1 Iranian Furfural Market Overview by Application
8.5.2 Saudi Arabia
8.5.2.1 Saudi Arabian Furfural Market Overview by Application
8.5.3 South Africa
8.5.3.1 South African Furfural Market Overview by Application
8.5.4 Other Rest of World
8.5.4.1 Other Rest of World Furfural Market Overview by Application
PART C: GUIDE TO THE INDUSTRY
1. NORTH AMERICA
2. EUROPE
3. ASIA-PACIFIC
4. REST OF WORLD
PART D: ANNEXURE
1. RESEARCH METHODOLOGY
2. FEEDBACK
Charts & Graphs
PART A: GLOBAL MARKET PERSPECTIVE
Chart 1: Global Furfural Market (2017 & 2024) by Application
Chart 2: Global Furfural Market (2017 & 2024) by Geographic Region
Chart 3: Global Furfuryl Alcohol Market (2017 & 2024) by Geographic Region
Chart 4: Global Furfural Market Analysis (2015-2024) – Volume in Metric Tons and Value in USD Million
Chart 5: Global Furfuryl Alcohol Market Analysis (2015-2024) – Volume in Metric Tons and Value in USD Million
Chart 6: Global Furfural Market Analysis (2015-2024) by Application – Furfuryl Alcohol, Solvent, Pharmaceuticals and Others in Metric Tons
Chart 7: Glance at 2015, 2018 and 2024 Global Furfural Volume Market Share (%) by Application – Furfuryl Alcohol, Solvent, Pharmaceuticals and Others
Chart 8: Global Furfural Market Analysis (2015-2024) by Application – Furfuryl Alcohol, Solvent, Pharmaceuticals and Others in USD Million
Chart 9: Glance at 2015, 2018 and 2024 Global Furfural Value Market Share (%) by Application – Furfuryl Alcohol, Solvent, Pharmaceuticals and Others
Chart 10: Global Furfural Market Analysis (2015-2024) in Furfuryl Alcohol Application by Geographic Region – North America, Europe, Asia-Pacific, South America and Rest of World in Metric Tons
Chart 11: Glance at 2015, 2018 and 2024 Global Furfural Volume Market Share (%) in Furfuryl Alcohol Application by Geographic Region – North America, Europe, Asia-Pacific, South America and Rest of World
Chart 12: Global Furfural Market Analysis (2015-2024) in Furfuryl Alcohol Application by Geographic Region – North America, Europe, Asia-Pacific, South America and Rest of World in USD Million
Chart 13: Glance at 2015, 2018 and 2024 Global Furfural Value Market Share (%) in Furfuryl Alcohol Application by Geographic Region – North America, Europe, Asia-Pacific, South America and Rest of World
Chart 14: Global Furfural Market Analysis (2015-2024) in Solvent Applications by Geographic Region – North America, Europe, Asia-Pacific, South America and Rest of World in Metric Tons
Chart 15: Glance at 2015, 2018 and 2024 Global Furfural Volume Market Share (%) in Solvent Applications by Geographic Region – North America, Europe, Asia-Pacific, South America and Rest of World
Chart 16: Global Furfural Market Analysis (2015-2024) in Solvent Applications by Geographic Region – North America, Europe, Asia-Pacific, South America and Rest of World in USD Million
Chart 17: Glance at 2015, 2018 and 2024 Global Furfural Value Market Share (%) in Solvent Applications by Geographic Region – North America, Europe, Asia-Pacific, South America and Rest of World
Chart 18: Global Furfural Market Analysis (2015-2024) in Pharmaceutical Applications by Geographic Region – North America, Europe, Asia-Pacific, South America and Rest of World in Metric Tons
Chart 19: Glance at 2015, 2018 and 2024 Global Furfural Volume Market Share (%) in Pharmaceutical Applications by Geographic Region – North America, Europe, Asia-Pacific, South America and Rest of World
Chart 20: Global Furfural Market Analysis (2015-2024) in Pharmaceutical Applications by Geographic Region – North America, Europe, Asia-Pacific, South America and Rest of World in USD Million
Chart 21: Glance at 2015, 2018 and 2024 Global Furfural Value Market Share (%) in Pharmaceutical Applications by Geographic Region – North America, Europe, Asia-Pacific, South America and Rest of World
Chart 22: Global Furfural Market Analysis (2015-2024) in Other Applications by Geographic Region – North America, Europe, Asia-Pacific, South America and Rest of World in Metric Tons
Chart 23: Glance at 2015, 2018 and 2024 Global Furfural Volume Market Share (%) in Other Applications by Geographic Region – North America, Europe, Asia-Pacific, South America and Rest of World
Chart 24: Global Furfural Market Analysis (2015-2024) in Other Applications by Geographic Region – North America, Europe, Asia-Pacific, South America and Rest of World in USD Million
Chart 25: Glance at 2015, 2018 and 2024 Global Furfural Value Market Share (%) in Other Applications by Geographic Region – North America, Europe, Asia-Pacific, South America and Rest of World
PART B: REGIONAL MARKET PERSPECTIVE
Chart 26: Global Furfural Market Analysis (2015-2024) by Geographic Region – North America, Europe, Asia-Pacific, South America and Rest of World in Metric Tons
Chart 27: Glance at 2015, 2018 and 2024 Global Furfural Volume Market Share (%) by Geographic Region – North America, Europe, Asia-Pacific, South America and Rest of World
Chart 28: Global Furfural Market Analysis (2015-2024) by Geographic Region – North America, Europe, Asia-Pacific, South America and Rest of World in USD Million
Chart 29: Glance at 2015, 2018 and 2024 Global Furfural Value Market Share (%) by Geographic Region – North America, Europe, Asia-Pacific, South America and Rest of World
Chart 30: Global Furfuryl Alcohol Market Analysis (2015-2024) by Geographic Region – North America, Europe, Asia-Pacific, South America and Rest of World in Metric Tons
Chart 31: Glance at 2015, 2018 and 2024 Global Furfuryl Alcohol Volume Market Share (%) by Geographic Region – North America, Europe, Asia-Pacific, South America and Rest of World
Chart 32: Global Furfuryl Alcohol Market Analysis (2015-2024) by Geographic Region – North America, Europe, Asia-Pacific, South America and Rest of World in USD Million
Chart 33: Glance at 2015, 2018 and 2024 Global Furfuryl Alcohol Value Market Share (%) by Geographic Region – North America, Europe, Asia-Pacific, South America and Rest of World
REGIONAL MARKET OVERVIEW
NORTH AMERICA
Chart 34: North American Furfural Market Analysis (2015-2024) – Volume in Metric Tons and Value in USD Million
Chart 35: North American Furfuryl Alcohol Market Analysis (2015-2024) – Volume in Metric Tons and Value in USD Million
Chart 36: North American Furfural Market Analysis (2015-2024) by Application – Furfuryl Alcohol, Solvent, Pharmaceuticals and Others in Metric Tons
Chart 37: Glance at 2015, 2018 and 2024 North American Furfural Volume Market Share (%) by Application – Furfuryl Alcohol, Solvent, Pharmaceuticals and Others
Chart 38: North American Furfural Market Analysis (2015-2024) by Application – Furfuryl Alcohol, Solvent, Pharmaceuticals and Others in USD Million
Chart 39: Glance at 2015, 2018 and 2024 North American Furfural Value Market Share (%) by Application – Furfuryl Alcohol, Solvent, Pharmaceuticals and Others
Chart 40: North American Furfural Market Analysis (2015-2024) by Geographic Region – United States, Canada and Mexico in Metric Tons
Chart 41: Glance at 2015, 2018 and 2024 North American Furfural Volume Market Share (%) by Geographic Region – United States, Canada and Mexico
Chart 42: North American Furfural Market Analysis (2015-2024) by Geographic Region – United States, Canada and Mexico in USD Million
Chart 43: Glance at 2015, 2018 and 2024 North American Furfural Value Market Share (%) by Geographic Region – United States, Canada and Mexico
Chart 44: North American Furfuryl Alcohol Market Analysis (2015-2024) by Geographic Region – United States, Canada and Mexico in Metric Tons
Chart 45: Glance at 2015, 2018 and 2024 North American Furfuryl Alcohol Volume Market Share (%) by Geographic Region – United States, Canada and Mexico
Chart 46: North American Furfuryl Alcohol Market Analysis (2015-2024) by Geographic Region – United States, Canada and Mexico in USD Million
Chart 47: Glance at 2015, 2018 and 2024 North American Furfuryl Alcohol Value Market Share (%) by Geographic Region – United States, Canada and Mexico
The United States
Chart 48: United States Furfural Market Analysis (2015-2024) – Volume in Metric Tons and Value in USD Million
Chart 49: United States Furfural Market Analysis (2015-2024) by Application – Furfuryl Alcohol, Solvent, Pharmaceuticals and Others in Metric Tons
Chart 50: Glance at 2015, 2018 and 2024 United States Furfural Volume Market Share (%) by Application – Furfuryl Alcohol, Solvent, Pharmaceuticals and Others
Chart 51: United States Furfural Market Analysis (2015-2024) by Application – Furfuryl Alcohol, Solvent, Pharmaceuticals and Others in USD Million
Chart 52: Glance at 2015, 2018 and 2024 United States Furfural Value Market Share (%) by Application – Furfuryl Alcohol, Solvent, Pharmaceuticals and Others
Canada
Chart 53: Canadian Furfural Market Analysis (2015-2024) – Volume in Metric Tons and Value in USD Million
Chart 54: Canadian Furfural Market Analysis (2015-2024) by Application – Solvent, Pharmaceuticals and Others in Metric Tons
Chart 55: Glance at 2015, 2018 and 2024 Canadian Furfural Volume Market Share (%) by Application �Solvent, Pharmaceuticals and Others
Chart 56: Canadian Furfural Market Analysis (2015-2024) by Application – Solvent, Pharmaceuticals and Others in USD Million
Chart 57: Glance at 2015, 2018 and 2024 Canadian Furfural Value Market Share (%) by Application – Solvent, Pharmaceuticals and Others
Mexico
Chart 58: Mexican Furfural Market Analysis (2015-2024) – Volume in Metric Tons and Value in USD Million
Chart 59: Mexican Furfural Market Analysis (2015-2024) by Application – Solvent, Pharmaceuticals and Others in Metric Tons
Chart 60: Glance at 2015, 2018 and 2024 Mexican Furfural Volume Market Share (%) by Application – Solvent, Pharmaceuticals and Others
Chart 61: Mexican Furfural Market Analysis (2015-2024) by Application – Solvent, Pharmaceuticals and Others in USD Million
Chart 62: Glance at 2015, 2018 and 2024 Mexican Furfural Value Market Share (%) by Application – Furfuryl Alcohol, Solvent, Pharmaceuticals and Others
EUROPE
Chart 63: European Furfural Market Analysis (2015-2024) – Volume in Metric Tons and Value in USD Million
Chart 64: European Furfuryl Alcohol Market Analysis (2015-2024) – Volume in Metric Tons and Value in USD Million
Chart 65: European Furfural Market Analysis (2015-2024) by Application – Furfuryl Alcohol, Solvent, Pharmaceuticals and Others in Metric Tons
Chart 66: Glance at 2015, 2018 and 2024 European Furfural Volume Market Share (%) by Application – Furfuryl Alcohol, Solvent, Pharmaceuticals and Others
Chart 67: European Furfural Market Analysis (2015-2024) by Application – Furfuryl Alcohol, Solvent, Pharmaceuticals and Others in USD Million
Chart 68: Glance at 2015, 2018 and 2024 European Furfural Value Market Share (%) by Application – Furfuryl Alcohol, Solvent, Pharmaceuticals and Others
Chart 69: European Furfural Market Analysis (2015-2024) by Geographic Region – Belgium, France, Germany, Italy, Russia, Spain, the United Kingdom and Rest of Europe in Metric Tons
Chart 70: Glance at 2015, 2018 and 2024 European Furfural Volume Market Share (%) by Geographic Region – Belgium, France, Germany, Italy, Russia, Spain, the United Kingdom and Rest of Europe
Chart 71: European Furfural Market Analysis (2015-2024) by Geographic Region – Belgium, France, Germany, Italy, Russia, Spain, the United Kingdom and Rest of Europe in USD Million
Chart 72: Glance at 2015, 2018 and 2024 European Furfural Value Market Share (%) by Geographic Region – Belgium, France, Germany, Italy, Russia, Spain, the United Kingdom and Rest of Europe
Chart 73: European Furfuryl Alcohol Market Analysis (2015-2024) by Geographic Region – Germany, Italy, Russia, Spain, the United Kingdom and Rest of Europe in Metric Tons
Chart 74: Glance at 2015, 2018 and 2024 European Furfuryl Alcohol Volume Market Share (%) by Geographic Region – Germany, Italy, Russia, Spain, the United Kingdom and Rest of Europe
Chart 75: European Furfuryl Alcohol Market Analysis (2015-2024) by Geographic Region – Germany, Italy, Russia, Spain, the United Kingdom and Rest of Europe in USD Million
Chart 76: Glance at 2015, 2018 and 2024 European Furfuryl Alcohol Value Market Share (%) by Geographic Region – Germany, Italy, Russia, Spain, the United Kingdom and Rest of Europe
Belgium
Chart 77: Belgian Furfural Market Analysis (2015-2024) – Volume in Metric Tons and Value in USD Million
Chart 78: Belgian Furfural Market Analysis (2015-2024) by Application – Furfuryl Alcohol, Solvent, Pharmaceuticals and Others in Metric Tons
Chart 79: Glance at 2015, 2018 and 2024 Belgian Furfural Volume Market Share (%) by Application – Furfuryl Alcohol, Solvent, Pharmaceuticals and Others
Chart 80: Belgian Furfural Market Analysis (2015-2024) by Application – Furfuryl Alcohol, Solvent, Pharmaceuticals and Others in USD Million
Chart 81: Glance at 2015, 2018 and 2024 Belgian Furfural Value Market Share (%) by Application – Furfuryl Alcohol, Solvent, Pharmaceuticals and Others
France
Chart 82: French Furfural Market Analysis (2015-2024) – Volume in Metric Tons and Value in USD Million
Chart 83: French Furfural Market Analysis (2015-2024) by Application – Solvent, Pharmaceuticals and Others in Metric Tons
Chart 84: Glance at 2015, 2018 and 2024 French Furfural Volume Market Share (%) by Application – Solvent, Pharmaceuticals and Others
Chart 85: French Furfural Market Analysis (2015-2024) by Application – Solvent, Pharmaceuticals and Others in USD Million
Chart 86: Glance at 2015, 2018 and 2024 French Furfural Value Market Share (%) by Application – Solvent, Pharmaceuticals and Others
Germany
Chart 87: German Furfural Market Analysis (2015-2024) – Volume in Metric Tons and Value in USD Million
Chart 88: German Furfural Market Analysis (2015-2024) by Application – Solvent, Pharmaceuticals and Others in Metric Tons
Chart 89: Glance at 2015, 2018 and 2024 German Furfural Volume Market Share (%) by Application – Solvent, Pharmaceuticals and Others
Chart 90: German Furfural Market Analysis (2015-2024) by Application – Solvent, Pharmaceuticals and Others in USD Million
Chart 91: Glance at 2015, 2018 and 2024 German Furfural Value Market Share (%) by Application – Solvent, Pharmaceuticals and Others
Italy
Chart 92: Italian Furfural Market Analysis (2015-2024) – Volume in Metric Tons and Value in USD Million
Chart 93: Italian Furfural Market Analysis (2015-2024) by Application – Solvent, Pharmaceuticals and Others in Metric Tons
Chart 94: Glance at 2015, 2018 and 2024 Italian Furfural Volume Market Share (%) by Application – Solvent, Pharmaceuticals and Others
Chart 95: Italian Furfural Market Analysis (2015-2024) by Application – Solvent, Pharmaceuticals and Others in USD Million
Chart 96: Glance at 2015, 2018 and 2024 Italian Furfural Value Market Share (%) by Application – Solvent, Pharmaceuticals and Others
Russia
Chart 97: Russian Furfural Market Analysis (2015-2024) – Volume in Metric Tons and Value in USD Million
Chart 98: Russian Furfural Market Analysis (2015-2024) by Application – Solvent, Pharmaceuticals and Others in Metric Tons
Chart 99: Glance at 2015, 2018 and 2024 Russian Furfural Volume Market Share (%) by Application – Solvent, Pharmaceuticals and Others
Chart 100: Russian Furfural Market Analysis (2015-2024) by Application – Solvent, Pharmaceuticals and Others in USD Million
Chart 101: Glance at 2015, 2018 and 2024 Russian Furfural Value Market Share (%) by Application – Solvent, Pharmaceuticals and Others
Spain
Chart 102: Spanish Furfural Market Analysis (2015-2024) – Volume in Metric Tons and Value in USD Million
Chart 103: Spanish Furfural Market Analysis (2015-2024) by Application – Solvent, Pharmaceuticals and Others in Metric Tons
Chart 104: Glance at 2015, 2018 and 2024 Spanish Furfural Volume Market Share (%) by Application – Solvent, Pharmaceuticals and Others
Chart 105: Spanish Furfural Market Analysis (2015-2024) by Application – Solvent, Pharmaceuticals and Others in USD Million
Chart 106: Glance at 2015, 2018 and 2024 Spanish Furfural Value Market Share (%) by Application – Solvent, Pharmaceuticals and Others
The United Kingdom
Chart 107: United Kingdom Furfural Market Analysis (2015-2024) – Volume in Metric Tons and Value in USD Million
Chart 108: United Kingdom Furfural Market Analysis (2015-2024) by Application – Solvent, Pharmaceuticals and Others in Metric Tons
Chart 109: Glance at 2015, 2018 and 2024 United Kingdom Furfural Volume Market Share (%) by Application – Solvent, Pharmaceuticals and Others
Chart 110: United Kingdom Furfural Market Analysis (2015-2024) by Application – Solvent, Pharmaceuticals and Others in USD Million
Chart 111: Glance at 2015, 2018 and 2024 United Kingdom Furfural Value Market Share (%) by Application – Solvent, Pharmaceuticals and Others
Rest of Europe
Chart 112: Rest of Europe Furfural Market Analysis (2015-2024) – Volume in Metric Tons and Value in USD Million
Chart 113: Rest of Europe Furfural Market Analysis (2015-2024) by Application – Solvent, Pharmaceuticals and Others in Metric Tons
Chart 114: Glance at 2015, 2018 and 2024 Rest of Europe Furfural Volume Market Share (%) by Application – Solvent, Pharmaceuticals and Others
Chart 115: Rest of Europe Furfural Market Analysis (2015-2024) by Application – Solvent, Pharmaceuticals and Others in USD Million
Chart 116: Glance at 2015, 2018 and 2024 Rest of Europe Furfural Value Market Share (%) by Application – Solvent, Pharmaceuticals and Others
ASIA-PACIFIC
Chart 117: Asia-Pacific Furfural Market Analysis (2015-2024) – Volume in Metric Tons and Value in USD Million
Chart 118: Asia-Pacific Furfuryl Alcohol Market Analysis (2015-2024) – Volume in Metric Tons and Value in USD Million
Chart 119: Asia-Pacific Furfural Market Analysis (2015-2024) by Application – Furfuryl Alcohol, Solvent, Pharmaceuticals and Others in Metric Tons
Chart 120: Glance at 2015, 2018 and 2024 Asia-Pacific Furfural Volume Market Share (%) by Application – Furfuryl Alcohol, Solvent, Pharmaceuticals and Others
Chart 121: Asia-Pacific Furfural Market Analysis (2015-2024) by Application – Furfuryl Alcohol, Solvent, Pharmaceuticals and Others in USD Million
Chart 122: Glance at 2015, 2018 and 2024 Asia-Pacific Furfural Value Market Share (%) by Application – Furfuryl Alcohol, Solvent, Pharmaceuticals and Others
Chart 123: Asia-Pacific Furfural Market Analysis (2015-2024) by Geographic Region – China, India, Japan, South Korea, Thailand and Rest of Asia-Pacific in Metric Tons
Chart 124: Glance at 2015, 2018 and 2024 Asia-Pacific Furfural Volume Market Share (%) by Geographic Region – China, India, Japan, South Korea, Thailand and Rest of Asia-Pacific
Chart 125: Asia-Pacific Furfural Market Analysis (2015-2024) by Geographic Region – China, India, Japan, South Korea, Thailand and Rest of Asia-Pacific in USD Million
Chart 126: Glance at 2015, 2018 and 2024 Asia-Pacific Furfural Value Market Share (%) by Geographic Region – China, India, Japan, South Korea, Thailand and Rest of Asia-Pacific
Chart 127: Asia-Pacific Furfuryl Alcohol Market Analysis (2015-2024) by Geographic Region – China, India, Japan, South Korea, Thailand and Rest of Asia-Pacific in Metric Tons
Chart 128: Glance at 2015, 2018 and 2024 Asia-Pacific Furfuryl Alcohol Volume Market Share (%) by Geographic Region – China, India, Japan, South Korea, Thailand and Rest of Asia-Pacific
Chart 129: Asia-Pacific Furfuryl Alcohol Market Analysis (2015-2024) by Geographic Region – China, India, Japan, South Korea, Thailand and Rest of Asia-Pacific in USD Million
Chart 130: Glance at 2015, 2018 and 2024 Asia-Pacific Furfuryl Alcohol Value Market Share (%) by Geographic Region – China, India, Japan, South Korea, Thailand and Rest of Asia-Pacific
China
Chart 131: Chinese Furfural Market Analysis (2015-2024) – Volume in Metric Tons and Value in USD Million
Chart 132: Chinese Furfural Market Analysis (2015-2024) by Application – Furfuryl Alcohol, Solvent, Pharmaceuticals and Others in Metric Tons
Chart 133: Glance at 2015, 2018 and 2024 Chinese Furfural Volume Market Share (%) by Application – Furfuryl Alcohol, Solvent, Pharmaceuticals and Others
Chart 134: Chinese Furfural Market Analysis (2015-2024) by Application – Furfuryl Alcohol, Solvent, Pharmaceuticals and Others in USD Million
Chart 135: Glance at 2015, 2018 and 2024 Chinese Furfural Value Market Share (%) by Application – Furfuryl Alcohol, Solvent, Pharmaceuticals and Others
India
Chart 136: Indian Furfural Market Analysis (2015-2024) – Volume in Metric Tons and Value in USD Million
Chart 137: Indian Furfural Market Analysis (2015-2024) by Application – Solvent, Pharmaceuticals and Others in Metric Tons
Chart 138: Glance at 2015, 2018 and 2024 Indian Furfural Volume Market Share (%) by Application – Solvent, Pharmaceuticals and Others
Chart 139: Indian Furfural Market Analysis (2015-2024) by Application – Solvent, Pharmaceuticals and Others in USD Million
Chart 140: Glance at 2015, 2018 and 2024 Indian Furfural Value Market Share (%) by Application – Solvent, Pharmaceuticals and Others
Japan
Chart 141: Japanese Furfural Market Analysis (2015-2024) – Volume in Metric Tons and Value in USD Million
Chart 142: Japanese Furfural Market Analysis (2015-2024) by Application – Solvent, Pharmaceuticals and Others in Metric Tons
Chart 143: Glance at 2015, 2018 and 2024 Japanese Furfural Volume Market Share (%) by Application – Solvent, Pharmaceuticals and Others
Chart 144: Japanese Furfural Market Analysis (2015-2024) by Application – Solvent, Pharmaceuticals and Others in USD Million
Chart 145: Glance at 2015, 2018 and 2024 Japanese Furfural Value Market Share (%) by Application – Solvent, Pharmaceuticals and Others
South Korea
Chart 146: South Korean Furfural Market Analysis (2015-2024) – Volume in Metric Tons and Value in USD Million
Chart 147: South Korean Furfural Market Analysis (2015-2024) by Application – Solvent, Pharmaceuticals and Others in Metric Tons
Chart 148: Glance at 2015, 2018 and 2024 South Korean Furfural Volume Market Share (%) by Application – Solvent, Pharmaceuticals and Others
Chart 149: South Korean Furfural Market Analysis (2015-2024) by Application – Solvent, Pharmaceuticals and Others in USD Million
Chart 150: Glance at 2015, 2018 and 2024 South Korean Furfural Value Market Share (%) by Application – Solvent, Pharmaceuticals and Others
Thailand
Chart 151: Thailand Furfural Market Analysis (2015-2024) – Volume in Metric Tons and Value in USD Million
Chart 152: Thailand Furfural Market Analysis (2015-2024) by Application – Furfuryl Alcohol, Solvent, Pharmaceuticals and Others in Metric Tons
Chart 153: Glance at 2015, 2018 and 2024 Thailand Furfural Volume Market Share (%) by Application – Furfuryl Alcohol, Solvent, Pharmaceuticals and Others
Chart 154: Thailand Furfural Market Analysis (2015-2024) by Application – Furfuryl Alcohol, Solvent, Pharmaceuticals and Others in USD Million
Chart 155: Glance at 2015, 2018 and 2024 Thailand Furfural Value Market Share (%) by Application – Furfuryl Alcohol, Solvent, Pharmaceuticals and Others
Rest of Asia-Pacific
Chart 156: Rest of Asia-Pacific Furfural Market Analysis (2015-2024) – Volume in Metric Tons and Value in USD Million
Chart 157: Rest of Asia-Pacific Furfural Market Analysis (2015-2024) by Application – Solvent, Pharmaceuticals and Others in Metric Tons
Chart 158: Glance at 2015, 2018 and 2024 Rest of Asia-Pacific Furfural Volume Market Share (%) by Application – Solvent, Pharmaceuticals and Others
Chart 159: Rest of Asia-Pacific Furfural Market Analysis (2015-2024) by Application – Solvent, Pharmaceuticals and Others in USD Million
Chart 160: Glance at 2015, 2018 and 2024 Rest of Asia-Pacific Furfural Value Market Share (%) by Application – Solvent, Pharmaceuticals and Others
SOUTH AMERICA
Chart 161: South American Furfural Market Analysis (2015-2024) – Volume in Metric Tons and Value in USD Million
Chart 162: South American Furfuryl Alcohol Market Analysis (2015-2024) – Volume in Metric Tons and Value in USD Million
Chart 163: South American Furfural Market Analysis (2015-2024) by Application – Furfuryl Alcohol, Solvent, Pharmaceuticals and Others in Metric Tons
Chart 164: Glance at 2015, 2018 and 2024 South American Furfural Volume Market Share (%) by Application – Furfuryl Alcohol, Solvent, Pharmaceuticals and Others
Chart 165: South American Furfural Market Analysis (2015-2024) by Application – Furfuryl Alcohol, Solvent, Pharmaceuticals and Others in USD Million
Chart 166: Glance at 2015, 2018 and 2024 South American Furfural Value Market Share (%) by Application – Furfuryl Alcohol, Solvent, Pharmaceuticals and Others
Chart 167: South American Furfural Market Analysis (2015-2024) by Geographic Region – Argentina, Brazil and Rest of South America in Metric Tons
Chart 168: Glance at 2015, 2018 and 2024 South American Furfural Volume Market Share (%) by Geographic Region – Argentina, Brazil and Rest of South America
Chart 169: South American Furfural Market Analysis (2015-2024) by Geographic Region – Argentina, Brazil and Rest of South America in USD Million
Chart 170: Glance at 2015, 2018 and 2024 South American Furfural Value Market Share (%) by Geographic Region – Argentina, Brazil and Rest of South America
Chart 171: South American Furfuryl Alcohol Market Analysis (2015-2024) by Geographic Region – Argentina, Brazil, Chile and Rest of South America in Metric Tons
Chart 172: Glance at 2015, 2018 and 2024 South American Furfuryl Alcohol Volume Market Share (%) by Geographic Region – Argentina, Brazil, Chile and Rest of South America
Chart 173: South American Furfuryl Alcohol Market Analysis (2015-2024) by Geographic Region – Argentina, Brazil, Chile and Rest of South America in USD Million
Chart 174: Glance at 2015, 2018 and 2024 South American Furfuryl Alcohol Value Market Share (%) by Geographic Region – Argentina, Brazil, Chile and Rest of South America
Argentina
Chart 175: Argentinean Furfural Market Analysis (2015-2024) – Volume in Metric Tons and Value in USD Million
Chart 176: Argentinean Furfural Market Analysis (2015-2024) by Application – Furfuryl Alcohol, Solvent, Pharmaceuticals and Others in Metric Tons
Chart 177: Glance at 2015, 2018 and 2024 Argentinean Furfural Volume Market Share (%) by Application – Furfuryl Alcohol, Solvent, Pharmaceuticals and Others
Chart 178: Argentinean Furfural Market Analysis (2015-2024) by Application – Furfuryl Alcohol, Solvent, Pharmaceuticals and Others in USD Million
Chart 179: Glance at 2015, 2018 and 2024 Argentinean Furfural Value Market Share (%) by Application – Furfuryl Alcohol, Solvent, Pharmaceuticals and Others
Brazil
Chart 180: Brazilian Furfural Market Analysis (2015-2024) – Volume in Metric Tons and Value in USD Million
Chart 181: Brazilian Furfural Market Analysis (2015-2024) by Application – Solvent, Pharmaceuticals and Others in Metric Tons
Chart 182: Glance at 2015, 2018 and 2024 Brazilian Furfural Volume Market Share (%) by Application – Solvent, Pharmaceuticals and Others
Chart 183: Brazilian Furfural Market Analysis (2015-2024) by Application – Solvent, Pharmaceuticals and Others in USD Million
Chart 184: Glance at 2015, 2018 and 2024 Brazilian Furfural Value Market Share (%) by Application – Solvent, Pharmaceuticals and Others
Rest of South America
Chart 185: Rest of South America Furfural Market Analysis (2015-2024) – Volume in Metric Tons and Value in USD Million
Chart 186: Rest of South America Furfural Market Analysis (2015-2024) by Application – Solvent, Pharmaceuticals and Others in Metric Tons
Chart 187: Glance at 2015, 2018 and 2024 Rest of South America Furfural Volume Market Share (%) by Application – Solvent, Pharmaceuticals and Others
Chart 188: Rest of South America Furfural Market Analysis (2015-2024) by Application – Solvent, Pharmaceuticals and Others in USD Million
Chart 189: Glance at 2015, 2018 and 2024 Rest of South America Furfural Value Market Share (%) by Application – Solvent, Pharmaceuticals and Others
REST OF WORLD
Chart 190: Rest of World Furfural Market Analysis (2015-2024) – Volume in Metric Tons and Value in USD Million
Chart 191: Rest of World Furfuryl Alcohol Market Analysis (2015-2024) – Volume in Metric Tons and Value in USD Million
Chart 192: Rest of World Furfural Market Analysis (2015-2024) by Application – Furfuryl Alcohol, Solvent, Pharmaceuticals and Others in Metric Tons
Chart 193: Glance at 2015, 2018 and 2024 Rest of World Furfural Volume Market Share (%) by Application – Furfuryl Alcohol, Solvent, Pharmaceuticals and Others
Chart 194: Rest of World Furfural Market Analysis (2015-2024) by Application – Furfuryl Alcohol, Solvent, Pharmaceuticals and Others in USD Million
Chart 195: Glance at 2015, 2018 and 2024 Rest of World Furfural Value Market Share (%) by Application – Furfuryl Alcohol, Solvent, Pharmaceuticals and Others
Chart 196: Rest of World Furfural Market Analysis (2015-2024) by Geographic Region – Iran, Saudi Arabia, South Africa and Other Rest of World in Metric Tons
Chart 197: Glance at 2015, 2018 and 2024 Rest of World Furfural Volume Market Share (%) by Geographic Region – Iran, Saudi Arabia, South Africa and Other Rest of World
Chart 198: Rest of World Furfural Market Analysis (2015-2024) by Geographic Region – Iran, Saudi Arabia, South Africa and Other Rest of World in USD Million
Chart 199: Glance at 2015, 2018 and 2024 Rest of World Furfural Value Market Share (%) by Geographic Region – Iran, Saudi Arabia, South Africa and Other Rest of World
Chart 200: Rest of World Furfuryl Alcohol Market Analysis (2015-2024) by Geographic Region – Turkey and Other Rest of World in Metric Tons
Chart 201: Glance at 2015, 2018 and 2024 Rest of World Furfuryl Alcohol Volume Market Share (%) by Geographic Region – Turkey and Other Rest of World
Chart 202: Rest of World Furfuryl Alcohol Market Analysis (2015-2024) by Geographic Region – Turkey and Other Rest of World in USD Million
Chart 203: Glance at 2015, 2018 and 2024 Rest of World Furfuryl Alcohol Value Market Share (%) by Geographic Region – Turkey and Other Rest of World
Iran
Chart 204: Iranian Furfural Market Analysis (2015-2024) – Volume in Metric Tons and Value in USD Million
Chart 205: Iranian Furfural Market Analysis (2015-2024) by Application – Solvent, Pharmaceuticals and Others in Metric Tons
Chart 206: Glance at 2015, 2018 and 2024 Iranian Furfural Volume Market Share (%) by Application – Solvent, Pharmaceuticals and Others
Chart 207: Iranian Furfural Market Analysis (2015-2024) by Application – Solvent, Pharmaceuticals and Others in USD Million
Chart 208: Glance at 2015, 2018 and 2024 Iranian Furfural Value Market Share (%) by Application – Solvent, Pharmaceuticals and Others
Saudi Arabia
Chart 209: Saudi Arabian Furfural Market Analysis (2015-2024) – Volume in Metric Tons and Value in USD Million
Chart 210: Saudi Arabian Furfural Market Analysis (2015-2024) by Application – Solvent, Pharmaceuticals and Others in Metric Tons
Chart 211: Glance at 2015, 2018 and 2024 Saudi Arabian Furfural Volume Market Share (%) by Application – Solvent, Pharmaceuticals and Others
Chart 212: Saudi Arabian Furfural Market Analysis (2015-2024) by Application – Solvent, Pharmaceuticals and Others in USD Million
Chart 213: Glance at 2015, 2018 and 2024 Saudi Arabian Furfural Value Market Share (%) by Application – Solvent, Pharmaceuticals and Others
South Africa
Chart 214: South African Furfural Market Analysis (2015-2024) – Volume in Metric Tons and Value in USD Million
Chart 215: South African Furfural Market Analysis (2015-2024) by Application – Furfuryl Alcohol, Solvent, Pharmaceuticals and Others in Metric Tons
Chart 216: Glance at 2015, 2018 and 2024 South African Furfural Volume Market Share (%) by Application – Furfuryl Alcohol, Solvent, Pharmaceuticals and Others
Chart 217: South African Furfural Market Analysis (2015-2024) by Application – Furfuryl Alcohol, Solvent, Pharmaceuticals and Others in USD Million
Chart 218: Glance at 2015, 2018 and 2024 South African Furfural Value Market Share (%) by Application – Furfuryl Alcohol, Solvent, Pharmaceuticals and Others
Other Rest of World
Chart 219: Other Rest of World Furfural Market Analysis (2015-2024) – Volume in Metric Tons and Value in USD Million
Chart 220: Other Rest of World Furfural Market Analysis (2015-2024) by Application – Solvent, Pharmaceuticals and Others in Metric Tons
Chart 221: Glance at 2015, 2018 and 2024 Other Rest of World Furfural Volume Market Share (%) by Application – Solvent, Pharmaceuticals and Others
Chart 222: Other Rest of World Furfural Market Analysis (2015-2024) by Application – Solvent, Pharmaceuticals and Others in USD Million
Chart 223: Glance at 2015, 2018 and 2024 Other Rest of World Furfural Value Market Share (%) by Application – Solvent, Pharmaceuticals and Others
Tables & Figures:
Tables:
Table 1: Pentosan Content (% of dry mass) of Various Raw Materials
Table 2: Production Capacities of Global Leading Manufacturers of Furfural and Furfuryl Alcohol
Table 3: Production Capacities of Leading Manufacturers of Furfural and Furfuryl Alcohol in China
Figures:
Figure 1: Select Derivatives of Furfural
Figure 2: Schematic of Furfuryl Alcohol Production from Furfural
Figure 3: Schematic of Furan Production from Furfural
Figure 4: Schematic of Tetrahydrofuran Production from Furan
Figure 5: Schematic of Tetrahydrofurfuryl Alcohol from Furfural
Figure 6 Schematic of 2-Methylfuran Production from Furfural
Aurus Speciality Company Limited
Central Romana Corporation, Ltd.
Hebei Xingtai Chunlei Furfuryl Alcohol Co., Ltd.
Henan Huilong Chemical Co., Ltd.
Hongye Holding Group Corporation Limited
Illovo Sugar Africa (Pty) Ltd
Penn A Kem LLC
Shanxi Province Gaoping Chemical Co., Ltd.
Silvateam S.p.a.
Take Advantage of Year-end Discounts!
Click "Avail Offer", and email us to get the discount!
20% off
Offer ends Jan 31, 2026
RELATED REPORTS
Global Pigments & Dyes Market - Types, Formulations and Applications
Report Code: CHM216 | Pages: 342 | Price: $4500
Published
Jan 2026

Aramid Fibers (Para and Meta) – A Global Market Overview
Report Code: CHM026 | Pages: 488 | Price: $4500
Published
Jan 2026
Ultra-High Molecular Weight Polyethylene (UHMWPE) Fiber - A Global Market Overview
Report Code: CHM408 | Pages: 187 | Price: $3960
Published
Jan 2026
Polyphenylene Sulfide (PPS) Fiber - A Global Market Overview
Report Code: CHM409 | Pages: 149 | Price: $3960
Published
Jan 2026
Global High-Performance Fibers Market - Products and Applications
Report Code: CHM410 | Pages: 525 | Price: $4950
Published
Jan 2026