
Global Biolubricants Market Trends and Outlook
Biolubricants constitute any class of lubricants that is biodegradable and non-toxic to humans and the environment. While the usage of these lubricants forms just a fraction of the overall lubricants market, which is led by mineral oil-based lubricants, the need for eco-friendly and sustainable options has prompted a shift towards bio-based alternatives. The chemical composition of Biolubricants can comprise natural or synthetic oils, of which natural oils are of animal or vegetable origin. Synthetic oils are obtained from chemical reactions and are ideal for challenging applications. The production of these oils can follow several routes, such as obtaining straight or branched-chain monoesters, diesters, triesters and polyol esters from vegetable oils. The conversion of triglyceride to esters can be followed or preceded by one or more reactions to improve reactions such as epoxidation and hydrogenation.
The application areas of Biolubricants encompass a range of industries, including automotive, marine, agriculture and industrial machinery, where they are used for minimizing friction & wear, enhancing efficiency and extending the life of equipment. Biodegradability and non-toxicity are the key properties of these lubricants, owing to which their environmental impact is negligible and the danger of water and soil contamination gets decreased significantly. Moreover, Biolubricants offer the similar level of lubricity and other features as their fossil fuel-based counterparts, making them suitable replacements.
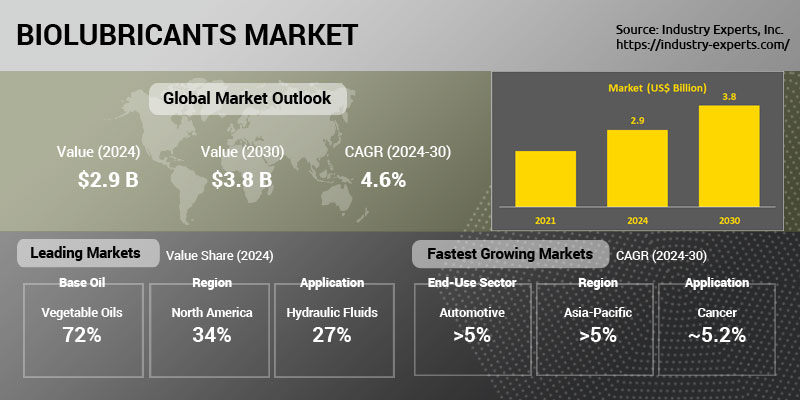
The global demand for Biolubricants is estimated at US$2.9 billion in 2024 and is projected to reach US$3.8 billion by 2030 at a CAGR of 4.6% over 2024-2030. Some of the key factors instrumental in driving the market for biolubricants include advances in technology, regulatory guidelines and a rise in consumer awareness. In the automotive and transportation sectors, a shift towards biolubricants from traditional products due to their eco-friendliness and equivalent performance has been promoting wider utilization, a trend that is very likely to sustain. Production processes and additive technologies have been modified to improve the performance and cost-effectiveness of biolubricants to make them on par with the mineral lubricants being used thus far.
In the United States and Europe, regulatory frameworks have been responsible for supporting the wide adoption of biolubricants, which some other regions, too, are following. A number of large manufacturing companies have also taken to using biolubricants for their machinery in order to comply with respective government policies aimed at curbing environmental damage. This trend has been more evident in the emerging economies of Asia-Pacific and South America, which is further anticipated to fuel the demand for biolubricants in these regions.
Biolubricants Regional Market Analysis
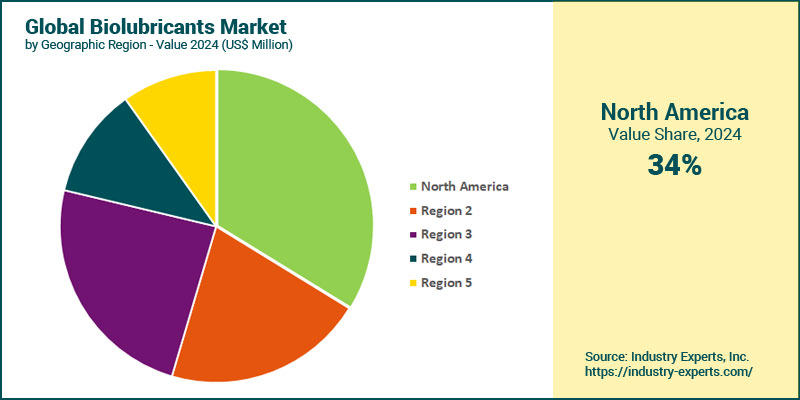
With an estimated share of about 34% in 2024, North America is the leading global market for Biolubricants. The United States has for long been among the largest auto manufacturing regions and the use of biolubricants in this sector is much more prevalent than in other regions, primarily owing to strict government regulations that need to be complied with. In addition, the region's aerospace and defense industry also makes use of heavy machinery in manufacturing, for which biolubricants are feasible options. As regards growth, however, the demand for biolubricants in Asia-Pacific will likely outpace other markets. The emergence of China as the current leader in automobile production has altered the global scenario in terms of biolubricants demand in their largest end-use sector. The shifting of manufacturing bases to more economical Asian countries offering cheaper resources and labor has resulted in a paradigm change in demand for allied materials, such as biolubricants. Also, general industrial development in the region has been instrumental in stimulating the market for biolubricants that are now being widely used to service and maintain proper functioning of machines.
Biolubricants Market Analysis by Base Oil
The global market for Biolubricants by base oil is dominated by Vegetable Oils, which mainly include Canola, Castor and Soybean oils, among others. Major factors in favor of these include biodegradability, cost-effectiveness, renewability and negligible environmental impact. The high viscosity index of these oils ensures their effective lubrication in demanding operating conditions. Being free of carbon further adds to the benefits of vegetable oil-based biolubricants in terms of environmental sustainability and minimization of health risks associated with their production. These oils can also be chemically modified to make other base oils that, despite being synthetic in nature, have a reduced ecological effect. Animal fats are another major source of biolubricants, the market for which is also expected to maintain a healthy growth.

Biolubricants Market Analysis by Application
Application of Biolubricants as Hydraulic Fluids is the largest, as also the fastest growing globally. These eco-friendly lubricants enhance and maintain the functioning of various machines that employ hydraulic systems for power transmission and component lubrication, as in the fields of manufacturing, construction, agriculture, mining and forestry. The high viscosity index of biolubricants ensures reliable performance across a range of temperatures, in addition to providing outstanding lubricity and reducing friction & wear in hydraulic components. Other fast-growing applications for biolubricants include Metal Working Fluids, Gear Oils and Chainsaw Oils.
Biolubricants Market Analysis by End-Use Sector
Apart from being the largest in terms of market demand, the global Commercial & Consumer Automotive sector is also expected to be the fastest growing for Biolubricants. The production and sales of passenger cars and commercial vehicles across the world has been maintaining a steady trend. As per latest statistics from the International Organization of Motor Vehicle Manufacturers (OICA), the total worldwide production of passenger cars and commercial vehicles in 2023 showed an increase of 10%, with the same for sales being nearly 12%. Other than being used for the efficient functioning of vehicles, biolubricants also find application in running and maintaining the vast base of machines employed in the auto sector. Major reasons for growing demand for biolubricants in this sector include low toxicity, strong lubricating properties, high viscosity index and high combustion temperature, all of which contribute to extending the serviceable life of vehicles and machines. Other industrial applications of biolubricants include their use as metal cutting oils and coolants for gear cutting, grinding and general machining. The major benefits offered by these bio-based metalworking fluids comprise excellent viscosity/pressure performance, lower volatility, higher flash point, less smoke and minimal risk of fire. Greases based on biolubricants are found to be highly suited for lubricating forestry equipment, construction vehicles, rail curves, rail flanges and marine equipment.
Biolubricants Market Report Scope
This global report on Biolubricants analyzes the market based on base oil, application and end-use sector for the period 2021-2030 with forecasts from 2024 to 2030 in terms of value in US$. In addition to providing profiles of major companies operating in this space, the latest corporate and industrial developments have been covered to offer a clear panorama of how and where the market is progressing.
Key Metrics
| Historical Period: | 2021-2023 | |
| Base Year: | 2024 | |
| Forecast Period: | 2024-2030 | |
| Units: | Value market in US$ | |
| Companies Mentioned: | 40+ |
Biolubricants Market by Geographic Region
- North America (The United States, Canada and Mexico)
- Europe (France, Germany, Italy, Russia, Spain, The United Kingdom and Rest of Europe)
- Asia-Pacific (China, Japan, India, South Korea and Rest of Asia-Pacific)
- South America (Argentina, Brazil and Rest of South America)
- Middle East & Africa
Biolubricants Market by Base Oil
- Animal Fat
- Beef Tallow
- Fish Oil
- Pork Lard
- Poultry Fat
- Vegetable Oil
- Canola Oil
- Castor Oil
- Soybean Oil
- Other Vegetable Oils (Incl. Palm, Safflower, Rapeseed, Jatropha, Neem, Karanja & Waste Cooking Oils)
- Other Base Oils
- Bio-Based Paraffins
- Synthetic Ester Oils
Biolubricants Market by Application
- Chainsaw Oils
- Gear Oils
- Greases
- Hydraulic Fluids
- Metal Working Fluids
- Mold Release Agents
- Process Oils
- Two Stroke Engine Oils
- Other Applications (Incl. Automotive & Industrial Engine Oils, Crankcase Oils, Firearm Lubricants, General Industrial Oils, Penetrating Oils, Transformer Oils & Transmission Fluids)
Biolubricants Market by End-Use Sector
- Commercial & Consumer Automotive
- Heavy Industrial Machinery
- Marine Equipment
- Power Generation Equipment
- Other End-Use Sectors (Incl. Chemical, Food & Beverage and Forestry)
Biolubricants Market Frequently Asked Questions (FAQs)
The global Biolubricants market is anticipated to grow at a CAGR of 4.6% during the 2024-2030 analysis period.
North America is the largest market for Biolubricants.
Asia-Pacific is expected to be the fastest growing region for Biolubricants.
Vegetable Oils account for the largest market for Biolubricants in regard to base oil.
Commercial & Consumer Automotive is the fastest growing end-use sector for Biolubricants.
The demand for the Cord Blood Stem Cells market is driven by increasing awareness of their therapeutic potential, rising incidences of blood-related diseases and cancers, advancements in stem cell research, and growing applications in regenerative medicine.
Some of the key factors instrumental in driving demand for biolubricants include advances in technology, regulatory guidelines and a rise in consumer awareness. In the automotive and transportation sectors, a shift towards biolubricants from traditional products due to their eco-friendliness and equivalent performance has been promoting wider utilization, a trend that is very likely to sustain.
PART A: GLOBAL MARKET PERSPECTIVE
1. Introduction
- Biolubricants Outline
- Biolubricants Defined
- Base Oil used for Biolubricants
- Animal Fat
- Beef Tallow
- Fish Oil
- Pork Lard
- Poultry Fat
- Vegetable Oil
- Canola Oil
- Castor Oil
- Soybean Oil
- Other Vegetable Oils (Incl. Palm, Safflower, Rapeseed, Jatropha, Neem, Karanja & Waste Cooking Oils)
- Other Base Oils
- Bio-Based Paraffins
- Synthetic Ester Oils
- Biolubricants Applications
- Chainsaw Oils
- Gear Oils
- Greases
- Hydraulic Fluids
- Metal Working Fluids
- Mold Release Agents
- Process Oils
- Two Stroke Engine Oils
- Other Applications (Incl. Automotive & Industrial Engine Oils, Crankcase Oils, Firearm Lubricants, General Industrial Oils, Penetrating Oils, Transformer Oils & Transmission Fluids)
- Biolubricants End-Use Sectors
- Commercial & Consumer Automotive
- Heavy Industrial Machinery
- Marine Equipment
- Power Generation Equipment
- Other End-Use Sectors (Incl. Chemical, Food & Beverage and Forestry)
2. Key Market Trends
3. Key Global Players
- Albemarle Corp
- Axel Christiernsson
- Balmer Lawrie & Co Ltd
- Benjin R Vickers & Sons Ltd
- Binol Biolubricants Ltd
- BioBlend Renewable Resources LLC
- Biona Jersin s.r.o.
- Biosynthetic Technologies LLC
- BP PLC
- Cargill, Inc.
- Carl Bechem GmbH
- Castrol Ltd
- Chevron Corp
- Clarion Lubricants
- Cortec Corp
- DSI Ventures, Inc.
- Elevance Renewable Sciences, Inc.
- Emery Oleochemicals
- Environmental Lubricants Manufacturing, Inc.
- ExxonMobil Corp
- Fuchs SE
- Green Earth Technologies, Inc.
- IGOL
- Kajo Group
- Klondike Lubricants
- Kluber Lubrication Munchen SE & Co. Kg
- LAEMMLE Chemicals AG
- LanoPro Production AS
- Novii LLC
- Petronas Lubricants International
- Polnox Corp
- Quaker Chemical Corp
- Renewable Lubricants, Inc.
- Repsol SA
- RoWe Mineralolwerk GmbH
- Royal Dutch Shell Plc
- RSC Bio Solutions LLC
- Statoil Lubricants ASA
- TotalEnergies SE
- United Bio Lube
4. Key Business & Product Trends
5. Global Market Overview
- Global Biolubricants Market Overview by Base Oil
- Biolubricants Base Oil Market Overview by Global Region
- Animal Fat
- Vegetable Oil
- Other Base Oils
- Global Biolubricants Market Overview by Application
- Biolubricants Application Market Overview by Global Region
- Chainsaw Oils
- Gear Oils
- Greases
- Hydraulic Fluids
- Metal Working Fluids
- Mold Release Agents
- Process Oils
- Two Stroke Engine Oils
- Other Applications
- Global Biolubricants Market Overview by End-Use Sector
- Biolubricants End-use Sector Market Overview by Global Region
- Commercial & Consumer Automotive
- Heavy Industrial Machinery
- Marine Equipment
- Power Generation Equipment
- Other End-Use Sectors
PART B: REGIONAL MARKET PERSPECTIVE
- Global Biolubricants Market Overview by Geographic Region
REGIONAL MARKET OVERVIEW
6. North America
- North American Biolubricants Market Overview by Geographic Region
- North American Biolubricants Market Overview by Base Oil
- North American Biolubricants Market Overview by Application
- North American Biolubricants Market Overview by End-Use Sector
- Country-wise Analysis of North American Biolubricants Market
- The United States
- United States Biolubricants Market Overview by Base Oil
- United States Biolubricants Market Overview by Application
- United States Biolubricants Market Overview by End-Use Sector
- Canada
- Canadian Biolubricants Market Overview by Base Oil
- Canadian Biolubricants Market Overview by Application
- Canadian Biolubricants Market Overview by End-Use Sector
- Mexico
- Mexican Biolubricants Market Overview by Base Oil
- Mexican Biolubricants Market Overview by Application
- Mexican Biolubricants Market Overview by End-Use Sector
7. Europe
- European Biolubricants Market Overview by Geographic Region
- European Biolubricants Market Overview by Base Oil
- European Biolubricants Market Overview by Application
- European Biolubricants Market Overview by End-Use Sector
- Country-wise Analysis of European Biolubricants Market
- France
- French Biolubricants Market Overview by Base Oil
- French Biolubricants Market Overview by Application
- French Biolubricants Market Overview by End-Use Sector
- Germany
- German Biolubricants Market Overview by Base Oil
- German Biolubricants Market Overview by Application
- German Biolubricants Market Overview by End-Use Sector
- Italy
- Italian Biolubricants Market Overview by Base Oil
- Italian Biolubricants Market Overview by Application
- Italian Biolubricants Market Overview by End-Use Sector
- Russia
- Russian Biolubricants Market Overview by Base Oil
- Russian Biolubricants Market Overview by Application
- Russian Biolubricants Market Overview by End-Use Sector
- Spain
- Spanish Biolubricants Market Overview by Base Oil
- Spanish Biolubricants Market Overview by Application
- Spanish Biolubricants Market Overview by End-Use Sector
- The United Kingdom
- United Kingdom Biolubricants Market Overview by Base Oil
- United Kingdom Biolubricants Market Overview by Application
- United Kingdom Biolubricants Market Overview by End-Use Sector
- Rest of Europe
- Rest of Europe Biolubricants Market Overview by Base Oil
- United Kingdom Biolubricants Market Overview by Application
- Rest of Europe Biolubricants Market Overview by End-Use Sector
8. Asia-Pacific
- Asia-Pacific Biolubricants Market Overview by Geographic Region
- Asia-Pacific Biolubricants Market Overview by Base Oil
- Asia-Pacific Biolubricants Market Overview by Application
- Asia-Pacific Biolubricants Market Overview by End-Use Sector
- Country-wise Analysis of Asia-Pacific Biolubricants Market
- China
- Chinese Biolubricants Market Overview by Base Oil
- Chinese Biolubricants Market Overview by Application
- Chinese Biolubricants Market Overview by End-Use Sector
- India
- Indian Biolubricants Market Overview by Base Oil
- Indian Biolubricants Market Overview by Application
- Indian Biolubricants Market Overview by End-Use Sector
- Japan
- Japanese Biolubricants Market Overview by Base Oil
- Japanese Biolubricants Market Overview by Application
- Japanese Biolubricants Market Overview by End-Use Sector
- South Korea
- South Korean Biolubricants Market Overview by Base Oil
- South Korean Biolubricants Market Overview by Application
- South Korean Biolubricants Market Overview by End-Use Sector
- Rest of Asia-Pacific
- Rest of Asia-Pacific Biolubricants Market Overview by Base Oil
- Rest of Asia-Pacific Biolubricants Market Overview by Application
- Rest of Asia-Pacific Biolubricants Market Overview by End-Use Sector
9. South America
- South American Biolubricants Market Overview by Geographic Region
- South American Biolubricants Market Overview by Base Oil
- South American Biolubricants Market Overview by Application
- South American Biolubricants Market Overview by End-Use Sector
- Country-wise Analysis of South American Biolubricants Market
- Argentina
- Argentine Biolubricants Market Overview by Base Oil
- Argentine Biolubricants Market Overview by Application
- Argentine Biolubricants Market Overview by End-Use Sector
- Brazil
- Brazilian Biolubricants Market Overview by Base Oil
- Brazilian Biolubricants Market Overview by Application
- Brazilian Biolubricants Market Overview by End-Use Sector
- Rest of South America
- Rest of South American Biolubricants Market Overview by Base Oil
- Rest of South American Biolubricants Market Overview by Application
- Rest of South American Biolubricants Market Overview by End-Use Sector
10. Middle East & Africa
- Middle East & Africa Biolubricants Market Overview by Base Oil
- Middle East & Africa Biolubricants Market Overview by Application
- Middle East & Africa Biolubricants Market Overview by End-Use Sector
PART C: GUIDE TO THE INDUSTRY
PART D: ANNEXURE
1. RESEARCH METHODOLOGY
2. FEEDBACK
Albemarle Corp
Axel Christiernsson
Balmer Lawrie & Co Ltd
Benjin R Vickers & Sons Ltd
Binol Biolubricants Ltd
BioBlend Renewable Resources LLC
Biona Jersin s.r.o.
Biosynthetic Technologies LLC
BP PLC
Cargill, Inc.
Carl Bechem GmbH
Castrol Ltd
Chevron Corp
Clarion Lubricants
Cortec Corp
DSI Ventures, Inc.
Elevance Renewable Sciences, Inc.
Emery Oleochemicals
Environmental Lubricants Manufacturing, Inc.
ExxonMobil Corp
Fuchs SE
Green Earth Technologies, Inc.
IGOL
Kajo Group
Klondike Lubricants
Kluber Lubrication Munchen SE & Co. Kg
LAEMMLE Chemicals AG
LanoPro Production AS
Novii LLC
Petronas Lubricants International
Polnox Corp
Quaker Chemical Corp
Renewable Lubricants, Inc.
Repsol SA
RoWe Mineralolwerk GmbH
Royal Dutch Shell Plc
RSC Bio Solutions LLC
Statoil Lubricants ASA
TotalEnergies SE
United Bio Lube
RELATED REPORTS
Distributed Generation (DG) - A Global Market Overview
Report Code: ENU012 | Pages: 337 | Price: $4500
Published
Sep 2025

Micro Batteries - A Global Market Overview
Report Code: ENU026 | Pages: 398 | Price: $4950
Published
Aug 2025

Aircraft Fuel Cells - A Global Market Overview
Report Code: ENU006 | Pages: 412 | Price: $4950
Published
Jul 2025

Battery Energy Storage Systems (BESS) - A Global Market Overview
Report Code: ENU005 | Pages: 470 | Price: $5040
Published
Jun 2025